Instability of the 13.8 day period in X-ray emission from 4U 1700–377
Abstract
We present a new result on long-term periodicity searches of the X-ray emission from 4U 1700–377 using RXTE ASM and CGRO BATSE data. The hard X-ray data (20 – 200 keV) from early BATSE observations (1780 days from JD 2448370, before RXTE observations started) show evidence of a 13.8 day periodicity. The long term periodicity became substantially less prominent in the data from later BATSE observations and in the soft X-ray data from the ASM (2 – 10 keV) observations. We demonstrate that disk precession models can explain the 13.8 day period and its instability in the X-ray emission from 4U 1700–377.
1 Introduction
First discovered by Jones et al. (1973), 4U 1700–377 is a 3.4 day X-ray eclipsing binary system. Its optical counterpart, HD 153919, is a bright early-type star. The system has been extensively studied at both optical and X-ray wavelengths. While it is considered to be a neutron star binary system there has been no confirmed detection of pulsation.
König & Maisack (1997) reported a possible 13.8 day periodicity in the X-ray emission from 4U 1700–377. Their results are based on the long term observations by the All-Sky Monitor (ASM, 2 – 10 keV) (Levin et al., 1996) on the Rossi X-ray Timing Explorer (RXTE) and the Burst And Transient Source Experiment (BATSE, 20 – 200 keV) (Fishman et al., 1989; Harmon et al., 2002) on the Compton Gamma Ray Observatory (CGRO). More data has been collected since their report. Here we present the results of long-term period searches using all the data available as of this writing.
2 Data selection and analysis
We employed All-Sky monitor X-ray light curves from BATSE on
CGRO satellite and ASM on the RXTE satellite. All data
presented here are publicly available by an on-line service from the
Laboratory for High Energy Astrophysics (LHEA) at
NASA/GSFC111http://heasarc.gsfc.nasa.gov/ (HEASARC),
http://cossc.gsfc.nasa.gov/archive/ (BATSE),
http://heasarc.gsfc.nasa.gov/docs/xte/xhp_achive.html (RXTE).
Using Earth occultations BATSE provides long term flux histories for bright X-ray sources in the energy range from 20 to 300 keV. In this paper, we used 3321 days (from JD 2448370) of daily-averaged, long-term flux from 4U 1700–377 given by the BATSE occultation technique (Figure 1). The ASM on the RXTE satellite usually dwells on a bright source a few times a day and it covers an energy range from 2 to 10 keV (Figure 1). We used 2221 days (from JD 2450088) of ASM X-ray time series data. No additional cut was applied to the data for analysis.


For the period search, König & Maisack (1997) used the epoch-folding technique, which is based on Leahy et al. (1983). The epoch-folding technique in Leahy et al. (1983) does not take into account phase selection effects. Here we used the phase-averaged epoch-folding technique (Collura et al., 1987). The phase-averaged epoch-folding technique is less vulnerable to false alarms due to random fluctuations than a single-phase epoch-folding technique. In practice, the outcome of the phase-averaged epoch-folding technique is similar to that of the epoch-folding technique with an optimally chosen bin size (Collura et al., 1987).
| Data set | estimatea | estimatea/theoryb | c |
|---|---|---|---|
| days | day | day | |
| BATSE 3321 | 3.41155(10) | 3.11(5)/3.50 | 58.2 |
| ASM 2221 | 3.41161(05) | 5.41(1)/5.24 | 366.4 |
a and is calculated for the sinusoidal signal (Leahy, 1987).
b = /, where is the time span of the data set.
bThe maximum value of the peak
Figure 2 shows the phase-averaged epoch folding results for the light curves of 4U 1700–377 in Figure 1 (15 phase bins). In Table 1, we estimated the orbital period (), assuming the sinusoidal signal of light curves (Leahy, 1987). It should be noted that the true orbital period varies as /yr (Rubin et al., 1996).


In comparison with the previous report (König & Maisack, 1997), the phase-averaged epoch folding on the 1780 days of BATSE data (Figure 3) produces roughly the same level of the noise fluctuations as in Figure 1b of König & Maisack (1997), but at the multiples of the orbital period is about twice as large as those of König & Maisack (1997). This is due to the superior performance of phase-averaging in the epoch-folding technique. In the case of the first 573 days of the ASM data, the noise fluctuation of by the phase-averaged epoch folding is dramatically smaller than that of the previous reports (Figure 3 in König & Maisack (1997)). In Figure 3, the second harmonics of the 13.8 day period is also prominent as a broad peak around 27.6 days.

The first two plots in Figure 4 show a detailed view of the and regions () from the BATSE data. Figure 4 also shows the region of from the first 1780 days and the next 1541 days of the BATSE data. The data were divided in this way in order to make a direct comparison with the results in König & Maisack (1997).
In Figure 4, one can notice that there is a bump around 13.8 days in the region (b), which indicates the presence of 13.8 day periodicity. Judging from the region (a) and the expected width of , the bump is not from the side-lobe of . The bump is more significant from the first 1780 days of data (c) and its peak is at 13.82(2) days, which is consistent with the result in König & Maisack (1997). But there is no clear indication of the 13.8 day periodicity in the rest of the data (d), although the epoch-folding search shows some features around 13.8 days.


Figure 5 shows the and regions of the epoch-folding results using the 2221 days and the first 573 days of the data from the RXTE ASM observations.
As shown in Figure 5 (b), there is no clear indication of the 13.8 day peridocity from the RXTE data. The peak around 13.8 days appears to be a side-lobe of , since the similar feature is present in the regime (a). The two bottom plots employ the same 573 days of the data as in König & Maisack (1997). Judging from the width of the peak in the plot and its expectation ( day where tot = 573 days) we can conclude that the bump around 13.8 days is largely due to the side-lobe of . One could argue that the right side-lobe near 13.8 days is larger than the left side-lobe at 13.5 days in the bottom-right plot, which may be interpreted as the presence of an additional bump, but the similar trend is noticed in other regions.


We divided the data into several sets (for example, dividing into 700 days of data for each set provides 5 sets of BATSE and 3 sets of RXTE data) and applied the epoch-folding technique (in the case of RXTE, a separate light curve is available for three energy bands). All the results (not shown here) indicate that the 13.8 day periodicity in the BATSE data is significant only in the first 1700 days of the data, which were taken before the RXTE observation on the source started.
Figure 6 shows the folded light curve at the 13.8 day period, using the first 1780 days of the CGRO BATSE and the first 573 days of the RXTE ASM data. In the case of the ASM data, there is a series of small peaks caused by the proximity of to the 13.8 day period for the total time span (573 days). However, the peak at the 0.8 phase in the ASM data is similiar to the one in the BATSE data, which is considered the main source of the high value at the 13.8 day period in the epoch folding analysis. This implies that the ASM data may contain a long term periodicity and its signature is too weak to be directly detected, particularly due to the proximity of .
In order to detect the 13.8 day periodicity unambiguously, it is important to remove the contribution from the side lobe of in calculating for a given period. Therefore, we applied the epoch folding procedure only on the uneclipsed data, the orbital phase of which falls in between 0.2 and 0.8. If a folded phase bin at a certain period (usually around the multiple of the orbital period) contains no data due to exclusion of the eclipsed data, we simply ignore the bin for calculation of the at the period222 In the epoch folding procedure, , where is the counting rate in the th phase bin, the average counting rate. Under the null hypothesis, the standard deviations should be defined as , where tot is the standard deviation of the unfolded time series and is the number of data points in the th phase bin (Larsson, 1996). Therefore, when , the th phase bin contributes nothing to ..
The result is shown in Figure 7 and the estimations of the long term periodicity are summarized in Table 2. The figure indicates that the 13.8 day periodicity became weak but it is clearly present in the RXTE data and the later part of the BATSE data. The peak position of the around 13.8 day down-shifted and the peak appears to have spread, indicating that the peak consists of more than one periodicity (Table 2). In Figure 7, one can also notice its second harmonics as well as the 13.8 day periodicity. In the next section, we will discuss the origin of the long term periodicity and its weakening.


| Data set | estimate | estimate/theory | |
| days | day | day | |
| BATSE first 1780 | 13.82(2) | 0.97(11)/1.07 | 4.93 |
| afirst 1780 | 13.82(2) | 0.83(18)/1.07 | 5.05 |
| a,bnext 1541 | 13.71(3) | 2.24(34)/1.22 | 2.80 |
| 3321 | 13.81(1) | 1.21(36)/0.57 | 3.98 |
| a,b3321 | 13.81(1) | 1.34(33)/0.57 | 4.14 |
| ASM a2221 | 13.74(1) | 2.60(13)/0.85 | 13.5 |
athe uneclipsed data (the orbital phase: 0.2 – 0.8)
bexhibits multiple peaks around 13.8 days. Here we consider
them as a part of a single broad peak to estimate the overall peak
location and the width.
3 Discussion
König & Maisack (1997) argued that the origin of the 13.8 day periodicity is a free precession of the neutron star arising from misalignment of the orbital axis and the neutron star spin axis. The analysis of the CGRO BATSE and RXTE ASM data indicates that the 13.8 day periodicity weakened dramatically after JD 2450000. If the precession of the neutron star caused the 13.8 day periodicity, the weakening of the periodicity implies that the neutron star precession has been dissipating. Such an interpretation may not be the most favorable one because it suggests that 4U 1700–377 was experiencing a sudden, unusual change of the system geometry.
In this section, we investigate accretion disk precession models in order to explain the 13.8 day periodicity and the instability of X-ray emission from 4U 1700–377, without invoking a dramatic change of the system geometry. So far about 15 X-ray binary systems are known to show a long term period, often called a superorbital period, in their light curve, and in many cases, the superorbital period is successfully explained by a precession of the accretion disk with respect to the orbital plane (Wijers & Pringle, 1999; Ogilvie & Dubus, 2001). Although 4U 1700–377 is a primarily stellar wind driven system, there are several observational results supporting a possible transient accretion disk in the system. Therefore we first explore the clues and the characteristics of an accretion disk in the system. Second, we apply two different accretion-disk precession models – radiation driven (Ogilvie & Dubus 2001 - hereafter OD), and magnetically driven (Lai, 1999) warped disk precession models and we study the implications.
3.1 A long-term, transient accretion disk?
Disk accretion is one of the most radiation-efficient accretion processes. When a stellar wind driven system like 4U 1700–377 forms an accretion disk, the disk accretion usually enhances the overall accretion rate, leading to higher X-ray emission in general. So a sudden increase of X-ray flux from some systems indicates the formation of an accretion disk in the system. For example, GX 301–2 is a wind-driven high-mass X-ray binary (HMXRB) with a partially underfilled Roche lobe, similar to 4U 1700–377. The observed spin-up episodes in GX 301–2 are successfully explained by the formation of a transient disk and its angular momentum exchange with the neutron star (Koh et al., 1997). Since the spin-up episodes in GX 301–2 are accompanied by enhancement in the X-ray flux from the system, an increase in X-ray emission can be used as indirect evidence of an accretion disk in the system.
In the case of 4U 1700–377, the intensity distribution of the first 1780 days of the BATSE data shows a clear difference from that of the next 1541 days of the data (Fig. 8). In the first 1780 days of the data, which exhibit the 13.8 day periodicity rather strongly, there are relatively more occurrences of high flux events than in the next 1541 days of the data. The difference in the average flux of these two data sets is 0.0083 in the given unit. Randomly dividing the combined data into two sets of data - 1780 and 1541 day long each, we found that the probability of getting such a difference from random fluctuations in a single distribution is negligible ().
The increase in the X-ray flux may be caused by changes in the stellar wind of the companion. However, the correlation between the frequency of high X-ray flux episodes and the strength of the 13.8 day periodicity indicates that both may be related to disk accretion. If the difference in the average flux is caused by changes in disk accretion, the estimated fraction of the X-ray flux from disk accretion is 14%. This is a very crude estimation due to the limited data statistics.

Other compelling evidence of disk accretion is quasi-periodic oscillations (QPOs) of X-ray flux. It is often believed that QPOs are caused by the material orbiting near the inner edge of the accretion disk. In 4U 1700–377, QPOs were observed on several occasions during the uneclipsed phase and they lasted 200 – 1200 seconds (Rubin et al. (1996) and references therein). In order to explain these QPO episodes, Rubin et al. (1996) proposed a beat frequency model (BFM) mechanism operating in a transient accretion disk near the X-ray source. In the BFM, a series of clumps in the accretion disk orbit the neutron star at the magnetopause in Keplerian motion, and the QPOs are a modulation at the beat frequency between the Keplerian rotation frequency at the magnetosphere and the neutron star spin frequency.
The episodic detection of QPOs may imply a transient accretion disk (Rubin et al., 1996). Rubin et al. (1996) estimated (Roche-lobe filling factor), which also supports the idea of accretion through a transient disk. Taking the idea of a transient disk a step further, we suggest that a transient disk in 4U 1700–377 can be quite persistent ( 1000 days).
First, it should be noted that the episodic behaviour could be simply due to the occasional formation of certain clumps in a persistent or transient disk. Second, if the companion O star is a just-underfilled-Roche lobe system (), the star may frequently undergo at least partial Roche-lobe overfilling due to various instabilities. For instance, tidal force driven disruption of the atmosphere of the companion star can cause instability. Naturally the time scale for such overfilling would be related to the orbital period – 3.4 days. Therefore, such instabilities provide a semi-periodic source to feed a transient or permanent accretion disk.
The continual Roche-lobe overfilling may result in accretion through several successive rings rather than a continuous disk. However, as often assumed for many disk models, it is believed that the inward drift rate of such a ring is much slower than the rate of viscous-driven ring broadening. The material is likely to be accreted by one continuous disk rather than multiple rings.
In fact, if the 13.8 day period is due to disk accretion, one can loosely estimate the lifetime of the accretion disk from the epoch-folding search results. In the epoch-folding searches of the first 1780 days of the BATSE data, the width of the peak around 13.8 days indicates that the peak originates in a single periodicity.
However, in the case that a series of short-term transient disks formed and disappeared successively in the given epoch, the long term periodicity is likely made of multiple periods. This results because the long term periodicity caused by the precession of each disk could be slightly different from one another, although it could be roughly the same as long as each disk forms and operates in similar conditions. Furthermore, it is not guaranteed that the periodicity in X-rays from each disk would be in phase unless the disk formation procedure is periodic. The different periodicities and their distinct phases induced by each disk can contribute to wash out the modulation of the folded light curve in epoch folding searches, and these may have caused the observed weakening and spreading of the long term periodicity in the later part of the data.
Consequently, a single, relatively strong 13.8 day periodicity in the early BATSE data is likely due to one or only a few accretion disks, and the duration of the strong 13.8 day periodicity is of order the lifetime of an accretion disk in the system. It is not easy to estimate the exact duration of the 13.8 day periodicity in the data. However, judging from the significance of the over 300 days or 1700 days of data, we estimate that the lifetime of the transient disk could be larger than a few 100 days.
One can also estimate the disk lifetime in relation to the time scale visc of viscous damping of the disk.
where is the viscosity parameter, the neutron star mass in , the accretion rate in g/sec, and the radial distance from the neutron star in cm (Frank, King, & Raine, 1992).
The accretion rate can be calculated from the observed flux erg/sec, and is mostly due to stellar wind capture. Assuming that the radiation efficiency is 0.1 and that 14% of is from disk accretion, we get . The range of for the disk can be estimated, too. The disc is cut off at the tidal radius tides where the tidal torque first changes sign, and thus the outer radius of the disk = tides. According to Wijers & Pringle (1999), tides 0.87 , where is the volume-averaged Roche radius of the accretor. Eggleton (1983) calculated in terms of the binary separation and the mass ratio (= / = , where is the mass of the companion star). Assuming and for 4U 1700–377 (Rubin et al., 1996), we get cm. Finally, according to Rubin et al. (1996), 2.6 .
Now we can estimate the disk lifetime from visc at = . In 4U 1700–377, at = , we gets visc 1900 – 4600 days for a typical in the range of 0.1 – 0.3. As mentioned earlier, the inward drift in the disk is mainly driven by the viscosity, and therefore, such a long viscous time scale implies that the disk can have a long lifetime ( 1000 days).
In summary, 4U 1700–377 can have a transient disk that can last 1000 days due to frequent Roche-lobe overfilling ( 3.4 days). If the precession of such an accreton disk induces the 13.8 day period in X-ray emission, the change of the periodicity is likely related to the stability of the precession. In addition, in this picture of a frequent Roche-lobe overfilled accretion disk model, instability of the accretion disk itself can contribute to the weakening of the 13.8 day periodicity in X-ray emission. For instance, the system may have transitioned into a less frequent Roche-lobe overfilling state that allows the formation of very short-term transient disks only. This is consistent with the observed weakening and spreading of the long term periodicity in the later part of the data.
3.2 Radiation driven disk warping and precession
In the radiation-driven, warped-disk precession model, the radiation from the central source provides a torque to warp the disk and subsequently allows the precession of the disk. The instability criterion for the radiation-driven disk warping is
where is the ratio of the two effective viscosities associated with the shear parallel () and vertical () to the disk plane (OD). Under the assumptions of the model by OD, can be expressed as a function of the viscosity parameter . In Papaloizou & Pringle (1977), the ratio, , can be given by a function of the mass ratio . Therefore, once and are known, one can determine the instability of disk warping from for a given . Figure 9, taken from OD, shows the instability condition in versus ( is now in ).
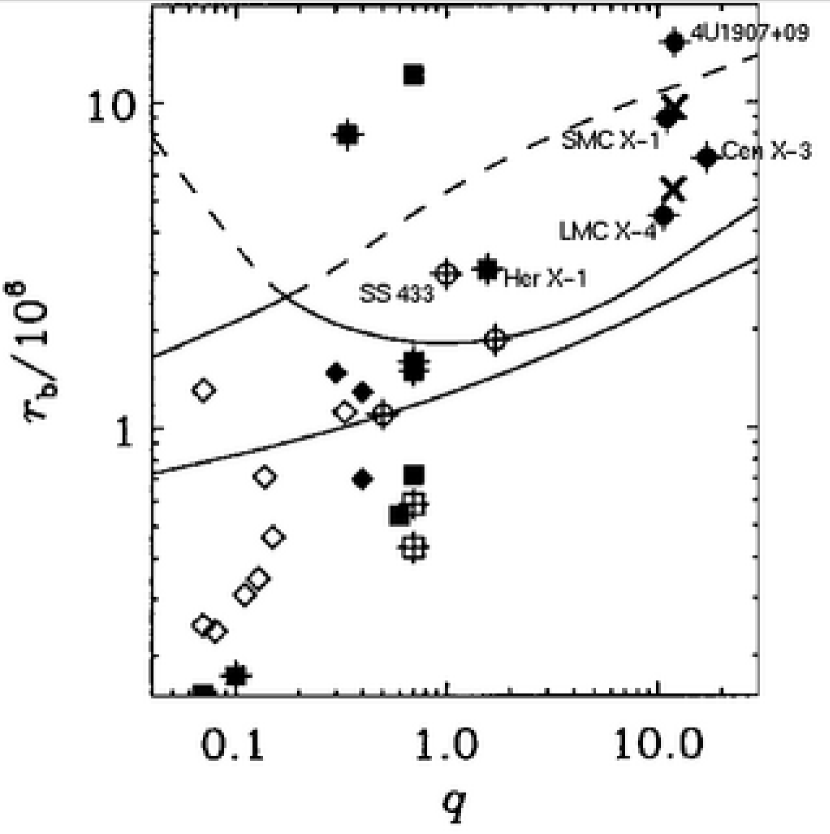
In the figure, OD pointed out that systems near the instability limit tend to show a steady precession (e.g. Her X-1, SS 433, and LMC X-4). The systems that lie away from the instability limit exhibit somewhat unstable precession (e.g. Cen X-3, SMC X-1, 4U1907+09).
In the case of HMXRBs ( 10), the instability condition becomes for and (OD). In the case of 4U 1700–377, assuming 31 and (Rubin et al., 1996), is 5.4. Or if 36 and 1.8 (Heap & Corcoran, 1992), is 9.4. While 4U 1700–377 does satisfy the instability condition of disk warping, it lies somewhat away from the instability limit. Therefore, according to OD, 4U 1700–377 belongs to the group of unstably precessing HMXRBs such as Cen X-3, SMC X-1, and 4U 1907+09. Therefore, if the 13.8 day period of X-ray flux from 4U 1700–377 is due to a radiation driven disk precession, the instability of the periodicity is not surprising.
It should be noted that in the above comparison with the model, many parameters assumed for 4U 1700–377 are not well constrained. In particular, , a critical parameter of the model, is unknown for the disk of 4U 1700–377. Thus, as in OD, we assumed = 0.3, which is a typical value for a nominal disk and this assumption allows a direct comparison with the model described in OD.
The precession period estimate given by OD also indirectly supports the idea of the unstably precessing disk in 4U 1700–377. The estimate in OD is given only for steadily precessing systems and the estimated period depends mostly on and . For , the range of precession frequency is
where is a constant relating the second vertical moment of the density and the surface density of the disk ( = 4.4 in cgs units ; refer to Eq. 9 in OD). The predicted precession period given for Her X-1 in OD allows one to estimate the precession period for other steadily precessing system.
If 4U 1700–377 is a steadily precessing system, the estimated range of the long term period is 290 – 620 days for 2.6 and . Therefore, the observed 13.8 day period is too short for 4U 1700–377 to be a steadily precessing system according to the model. However, OD also stated that the prediction is subject to large errors due to large uncertainties in the model parameters and for 4U 1700–377, is somewhat poorly constrained here.
3.3 Magnetically driven disk warping and precession
Lai (1999) introduced a magnetically driven warping/precession model for superorbital periods in X-ray binaries. In this model, strong magnetic fields in the magnetosphere, in particular ones penetrating the accretion disk, exert a torque necessary for disk warping and precession. In magnetically driven disk warping an inner portion of the disk will be warped and as a result the disk will precess.
In the case of 4U 1700–377, persistent pulsation has not been observed. Therefore, the existence of a strong magnetic field in the system is not confirmed. However, the hard X-ray spectrum implies that the system may have strong magnetic fields. For example, a hard tail in the hard X-ray spectrum is the characteristic of a massive binary system with an X-ray pulsar (Laurent et al., 1992), and the BeppoSAX observation showed some hints of a broad cyclotron absorption feature (Reynolds et al., 1999).
The instability condition of magnetically driven warping is that the magnetic warping gross rate should be larger than the viscous damping rate (Lai, 1999), or
where and is the radius of the magnetosphere boundary, and
where is a constant of order unity and the magnetic dipole moment of the neutron star in G cm3 (Lai, 1999).
For example, in the case of 4U 1700–377, visc 6 day at 0.01 . Since and , if 6 day at = 0.01 , at . Then, the magnetic fields can warp the disk at . For 4U 1700–377, assuming = 1.86 (= /1.4), , and , we get (1.01 cm) . Therefore, in order to have magnetically driven warping at , from .
Lai (1999) provides and the magnetically driven precession frequency in terms of various parameters such as the magnetic dipole moment. Because of the lack of the confirmed persistent pulsation from 4U 1700–377, it is difficult to estimate basic information related to the magnetic field of the system such as the magnetic dipole moment. Thus, it is even more difficult to estimate and . However, we can get a magnetic-field independent relation from the ratio of and (Eq 6.3 and 6.13 in Lai (1999)).
where the angle between the neutron star spin axis and the disk rotation axis, and the angle between the neutron star spin axis and its magnetic moment, max() ( is the half-thickness of the disk and specifies the azimuthal pitch of the field line (in general ).
For a precession of the whole disk, a modal analysis is required for a proper evaluation of . In general, will alternate between its maximum and minumum along the azimuthal direction. Thus, azimuthally averaged . Assuming , (Lai, 1999), and days, the above relation becomes
For , , and ,
at , where and are in cm. Therefore, if a magnetically field driven disk precession caused the 13.8 day period in the X-ray emission from 4U 1700–377,
This result implies that the weaker the field is, the more likely aligned the neutron star spin axis and the magnetic dipole axis are. For example, if 4U 1700–377 develops magnetically driven disk warping at 0.01 ( day), the above relation reduces to o and . Or in the case that relatively weak magnetic fields are present, the warping would occur in a smaller portion of the disk. So, if the warping occurs at 0.002 , day, o, and . If there is indeed such an alignment, it explains the lack of the observed persisent pulsation from 4U 1700–377.
In disk precession models, the central source will be succesively seen in ‘on’ and ‘off’ states due to the varying obscuration by the disk. As a result, a large modulation is expected in the detected light curve, as seen in the well-established disk-precession sources like Her X-1, LMC X-4, and SMC X-1. However, 4U 1700–377 exhibits a somewhat small modulation in the folded light curve at the observed long term period (Figure 6). The small modulation can be explained consistently in the disk precession models. First, there can be some extended emission regions such as disk corona sources (Ogilvie & Dubus, 2001). Second, in 4U 1700–377, it is possible that due to the inherent instability of disk precession (or the disk itself), for a certain fraction of precession cycles the central source is not completely hidden by the disk even at the maximum obscuration. An alternative explanation is the variable-accretion rate model, which is favored for the observed long term period in LMC X-3 (Wilms et al, 2001). Further studies such as the spectral variation analysis are required to assess whether such a model is compatible with 4U 1700–377.
4 Conclusion
We studied the long term – 13.8 day periodicity in X-ray flux from 4U 1700–377. The epoch folding analysis indicates that the periodicity was relatively strong and consisted of a single period in the early data of the BATSE observation. The long periodicity feature weakened and spread over multiple periods after JD 2450000 when RXTE started its observation.
We investigated the origin of the 13.8 day period in X-rays using disk precession models. Disk precession models are a natural way to explain the 13.8 day period and its instability. In particular, the instability of the 13.8 day period is consistent with the radiation-driven warped-disk precession model. Alternatively, the magnetically-driven warped-disk precession model can provide a constraint on the possible alignment of neutron star spin axis and the magnetic dipole axis, which can explain the lack of the observed pulsation from the system.
5 Acknowledgement
The authors wish to thank the anonymous referee for useful discussions and suggestions.
References
- Collura et al. (1987) Collura, A. et al., 1987, ApJ, 315, 340
- Eggleton (1983) Eggleton, P. P., 1983, ApJ, 268, 368.
- Fishman et al. (1989) G.J. Fishman, et al 1989, in Proc. GRO Science Workshop, ed W. N. Johnson (Washington, D.C.: NASA), 2-39
- Harmon et al. (2002) Harmon, B. A., et al , ApJS, 138, 149
- Heap & Corcoran (1992) Heap, S. R. & Corcoran, M. F., 1992, ApJ, 387, 340.
- Jones et al. (1973) Jones, C. et al. 1973, ApJ, 181, L43
- Frank, King, & Raine (1992) Frank, J., King, A., & Raine, D., 1992 Accretion power in Astrophsics (Cambridge: Cambridge Univ. Press)
- Katz (1973) Katz, J. I., 1973, Nature Physc. Sci., 246 87
- Koh et al. (1997) Koh, D. T., et al. 1997, ApJ, 479, 933
- König & Maisack (1997) König, M. & Maisack, M., 1997, A&A, 327, 33L
- Lai (1999) Lai, D., 1999, ApJ, 524, 1030
- Larsson (1996) Larsson, S., 1996, A&AS, 117, 197
- Laurent et al. (1992) Laurent, P., et al. 1992, A&A, 260, 237
- Larwood (1998) Larwood, J., 1998, MNRAS, 299, 32
- Leahy et al. (1983) Leahy, D. A., et al., 1983, ApJ, 272, 256
- Leahy (1987) Leahy, D. A., 1987, ApJ, 180, 275
- Levin et al. (1996) Levine, A. M., et al., 1996, ApJ, 469, L33
- Malet et al. (1995) Malet, I., et al. 1995, ApJ, 444, 222
- Ogilvie & Dubus (2001) Ogilvie, G. I. & Dubus, G., 2001, MNRAS, 320, 485 (OD)
- Papaloizou & Pringle (1977) Papaloizou, J. C. B. & Pringle, J. E., 1977, MNRAS, 181, 441
- Papaloizou & Terquem (1995) Papaloizou, J. C. B. & Terquem, C., 1995, MNRAS, 274, 987
- Paczyński (1977) Paczyński, B., 1977, ApJ, 216, 822
- Reynolds et al. (1999) Reynolds, P., et al. 1999, A&A, 349, 873
- Rubin et al. (1996) Rubin, B. C. et al. 1996, ApJ, 459, 259
- Wijers & Pringle (1999) Wijers, R. A. M. J. & Pringle, J. E. 1999, MNRAS, 308, 207
- Wilms et al (2001) Wilms J. et al. 2001, MNRAS, 320, 327