Propane on Titan
Abstract
We present the first observations of propane (C3H8) on Titan that unambiguously resolve propane features from other numerous stratospheric emissions. This is accomplished using a spectrometer (TEXES) to observe propane’s rotation-vibration band near 748 cm-1. We find a best-fit fractional abundance of propane in Titan’s stratosphere of in the altitude range to which we are sensitive (90-250 km or 13-0.24 mbar).
Subject headings:
planets and satellites: Titan, infrared: solar system, molecular data1. Introduction
Titan’s thick atmosphere is simultaneously analogous to and extraordinarily different from that of Earth. Both atmospheres are composed mostly of nitrogen. Both atmospheres have a major component that can exist as a solid, liquid, or gas (water on Earth, methane on Titan). Both have similar vertical temperature-pressure structures, although Titan’s atmosphere is 200 K cooler and is greatly extended relative to Earth due to much lower surface gravity. On Titan a complicated network of photochemical reactions leads from methane (CH4) to the formation of numerous heavier hydrocarbons, including propane (). Measuring the abundances of Titan’s hydrocarbons provides an important test of models of Titan’s atmospheric chemistry and, more generally, of our fundamental understanding of atmospheric chemical and physical processes.
Photochemical models (e.g. Yung, Allen, & Pinto, 1984; Toublanc et al., 1995; Lara et al., 1996; Banaszkiewicz et al., 2000) predict that propane is formed via C2H5 + CH3 + M C3H8 + M where CH3 is created by methane photolysis and C2H5 by C2H4 + H + M C2H5 + M. The primary removal mechanism for propane is condensation at the cold tropopause, although photolytic destruction and reaction with C2H consume 5-15 of the propane formed. In the model of Lara et al. (1996) propane condensed onto Titan’s surface accounts for 1 of the carbon removed from Titan’s atmosphere.
Detections of propane’s rotation-vibration band near 748 cm-1 were based on Voyager I and Infrared Space Observatory (ISO) spectra. Voyager spectra had 4.3 cm-1 resolution ( at cm-1) and initial claims of a propane abundance of 2 (Maguire et al., 1981) were later reduced to 7 (Coustenis et al., 1989). The resolution of these spectra left every band of propane blended with other emission features. At 748 cm-1 the band of propane was blended with features of acetylene () and the derived abundance (or even detection) of propane is strongly dependent on the assumed vertical abundance profile. Spectra taken by ISO were of higher resolution ( at cm-1) but were still unable to resolve propane from acetylene. From these data Coustenis et al. (2003) derived a nominal propane abundance of 2, although they acknowledged the substantial difficulties of disentangling propane emission from that of acetylene.
2. Observations
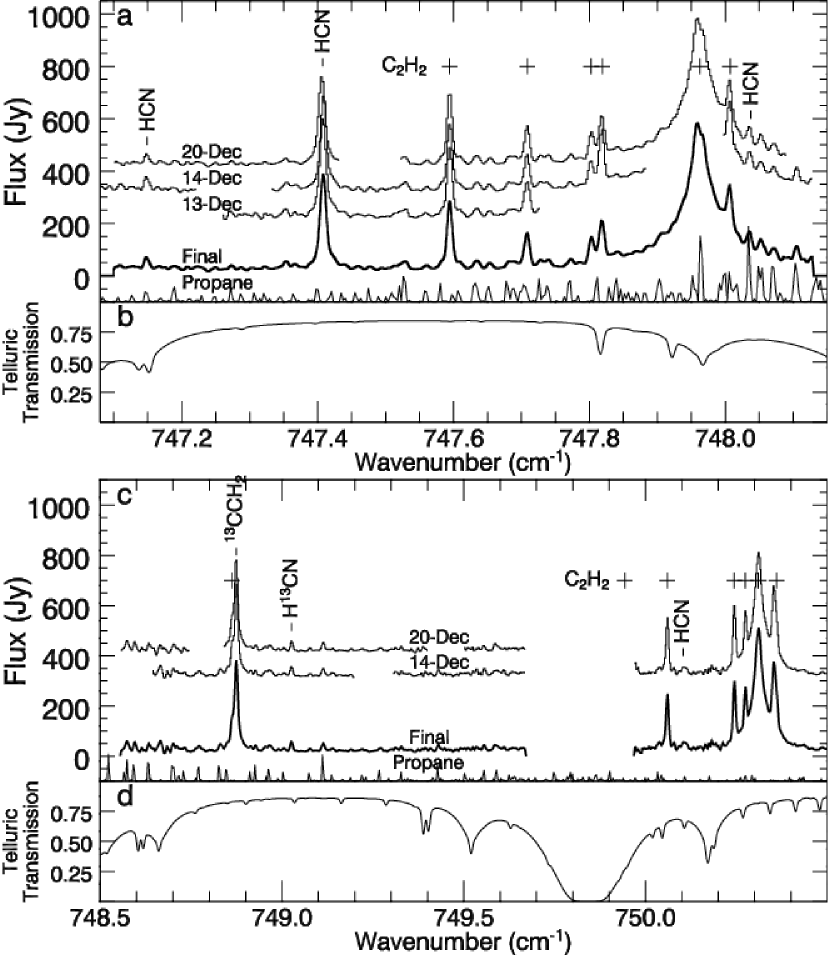
Observations were made at the 3.0 meter NASA Infrared Telescope Facility (IRTF) using the TEXES mid-infrared high-resolution grating spectrograph (Lacy et al., 2002) on 13, 14, and 20 December 2002 UT in several overlapping spectral settings around propane’s fundamental vibration at 748 cm-1. At this wavenumber a single spectral setting covers 5 cm-1 at a resolution of with slight gaps between spectral orders. The strongest propane lines are blocked by telluric absorption at 748.3 cm-1. The diffraction limit of IRTF at these wavelengths and Titan’s diameter are both . With a slit width of our data represent a disk average spectrum of Titan. The reduced spectrum from each night, corrected for the appropriate Doppler shift, is shown in Fig. 1 along with the final combined spectrum. All data were reduced using the standard pipeline reduction detailed in Lacy et al. (2002). Telluric transmission was corrected with Callisto on the first two nights and the Becklin-Neugebauer object (Becklin & Neugebauer, 1967) on the third night. We flux calibrated using observations of Gem (Cohen et al., 1995) on the final night, and estimate that this calibration is accurate to 10-20%.
3. Radiative transfer modeling
We use a new line-by-line code (Roe, 2002), dividing Titan’s atmosphere below 1000 km into 50 spherical shells evenly spaced in and using spectral bins of cm-1 in order to resolve even the narrowest emission lines. Line parameters for acetylene (C2H2) and HCN are from HITRAN (Rothman et al. 1998), with the HCN line positions adjusted to agree with the observations of Duxbury & Gang (1989). The temperature-pressure profile is the ‘recommended’ profile of Yelle et al. (1997). Scattering effects are ignored and Titan’s haze is modeled as a single layer with a lower cutoff of 50 km and with haze opacity scale height equal to the gas density scale height. The abundances of HCN and are each parameterized with their fractional abundances at 1 mbar (, ) and with the slope of (abundance)-(pressure) (, ), i.e. . We investigated both a constant propane vertical profile as well as scaled versions of an abundance profile predicted by photochemical modeling (Lara et al., 1996; Banaszkiewicz et al., 2000). Species are held to saturation vapor pressures below their condensation altitudes. In order to calculate Titan’s total flux, the model is run at 32 points from the center of Titan’s disk to off the edge of Titan’s solid limb, with the calculation points more closely spaced near the limb.
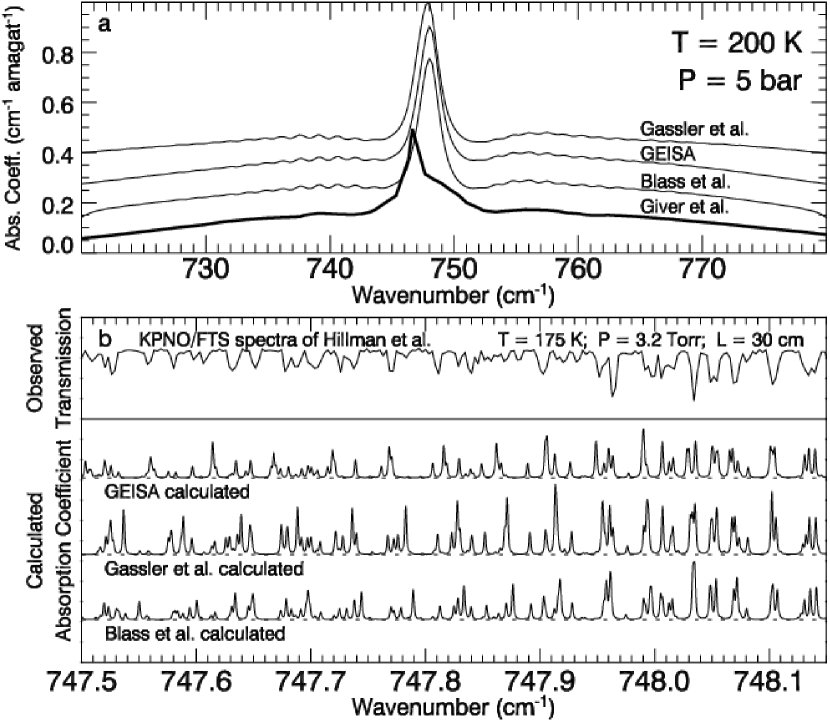
The modeling of propane’s emission spectrum requires additional discussion. Several linelists exist for propane’s band at 748 cm-1. These include: the GEISA databank (Jacquinet-Husson et al. 1999); an unpublished list based on fits to the laboratory spectra of Nadler & Jennings (1989) and Hillman et al. (1992) (Blass et al. 1988); and a list generated using the code of Typke (1976) and the parameters of Gassler et al. (1989). Figure 2 shows calculated spectra using each of these linelists compared to low-resolution laboratory spectra of Giver et al. (1984) and to the high-resolution spectra used in Hillman et al. (1992). Given the poor fit of the calculated spectra to the observed spectra in Fig. 2 at the wavenumbers we observed, we opted to use the low-pressure (1-3 Torr) low-temperature (175 K) high-resolution (R) transmission spectra of Hillman et al. (1992)111Available at http://diglib.nso.edu/nso_user.html to construct an empirical absorption coefficient () spectrum for propane. This involved fitting for the smoothly varying baseline and then converting to units (cm-1 amagat-1) using the sample’s known pathlength (30 cm), pressure, and temperature. In using this empirical spectrum we are implicitly assuming that is independent of temperature. Our propane observations primarily probe regions of Titan’s atmosphere that are at 135 to 175 K and are therefore reasonably well matched by the conditions of these laboratory data used to construct . Most of our spectral fitting was performed using this empirical for propane. As a test of the importance of the mismatch between Titan atmospheric and laboratory temperatures we re-fit our data using the Blass et al. linelist scaled to fit our empirical at 175 K, along with the partition sum parameterization of Fischer & Gamache (2002), to represent propane.
4. Fitting model to data
We fit model to data with an ‘amoeba’-type minimization while varying six parameters: total haze opacity (), propane (), acetylene (, ), and HCN (, ). Figure 3 compares the observed spectrum with the best-fit model with and without propane, in one case using the Blass et al. linelist and in the other using our empirical to represent propane. The detection of propane is unambiguous and the best-fit abundance assuming a constant vertical profile and using our empirical is . For acetylene and HCN our best fits are characterized by and . The haze is best fit by , although this value is extremely dependent on the assumed vertical haze profile and should not be over interpreted.
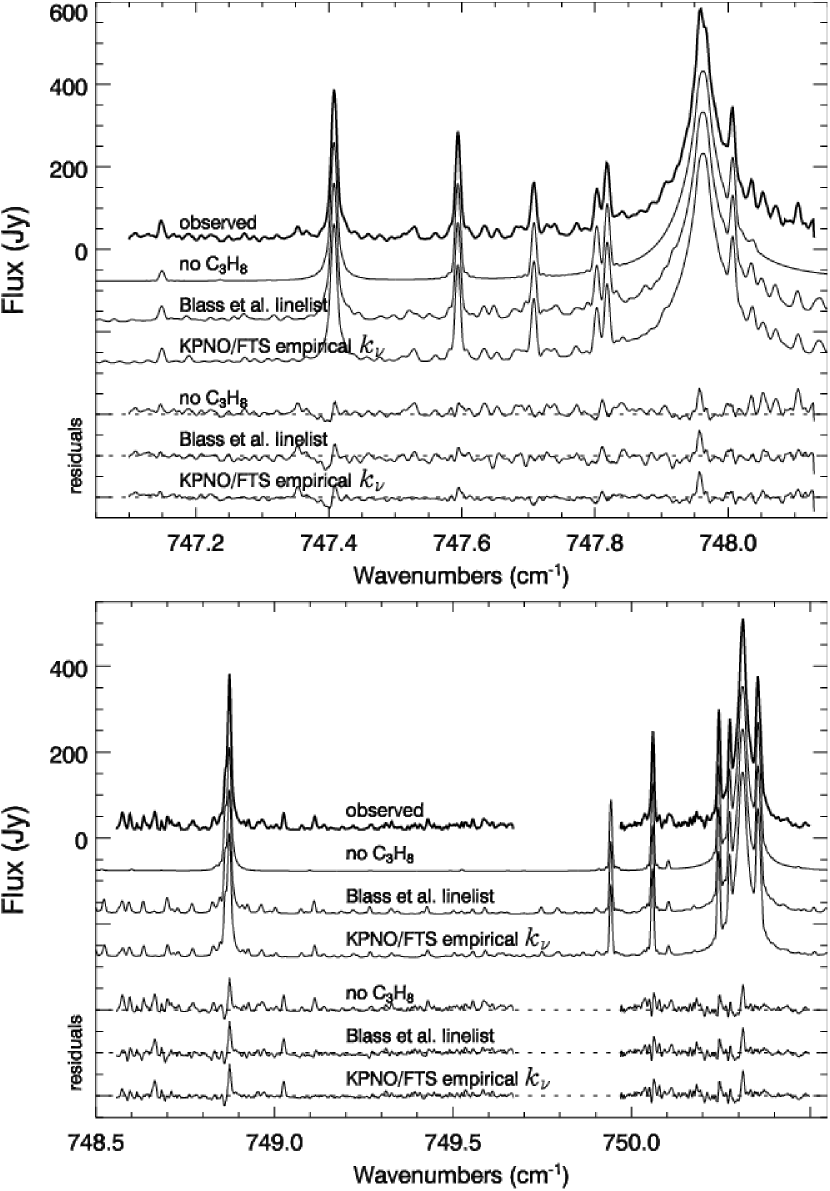
We found that reasonable fits to the HCN and features required a non-constant vertical abundance. Even with our two variable log-log parameterization we see non-zero residuals on these features, suggesting a more complicated vertical structure which we will explore further in future work with similar spectra covering many more transitions. Other significant non-zero residuals are explained as: an unidentified species at 747.35 cm-1, an imperfectly corrected telluric feature at 748.68 cm-1, not fitting for the 13CCH2/C2H2 ratio at 748.88 cm-1, and an H13CN feature at 749.02 cm-1 that is missing from the model.
Our focus here is propane and thus we do not present uncertainties on the vertical abundance parameters for HCN and . As is apparent in Fig. 1, random errors are negligible in our spectra. The other sources of uncertainty are: flux calibration, errors associated with our empirical absorption coefficient method, the extent to which propane abundance is not constant with altitude, the extent to which Titan’s temperature-pressure profile deviates from that derived by Yelle et al. (1997), and the extent to which propane’s abundance varies with latitude.
The uncertainty in flux calibration is at worst 20%, which maps almost linearly into a 20% uncertainty in propane abundance. The primary potential error from our empirical absorption coefficient method is the mismatch of laboratory sample temperature (175 K) to the temperature of the propane in Titan’s stratosphere. In our model spectra % of the propane flux arises from the pressure range 13-0.24 mbar (90-250 km altitude), where temperatures range over 135-175 K. To investigate this uncertainty we re-fit using the Blass et al. linelist (See Fig. 3.). The overall fit is lower quality than with our empirical and the best-fit propane abundance is only 1.10.1 times more.
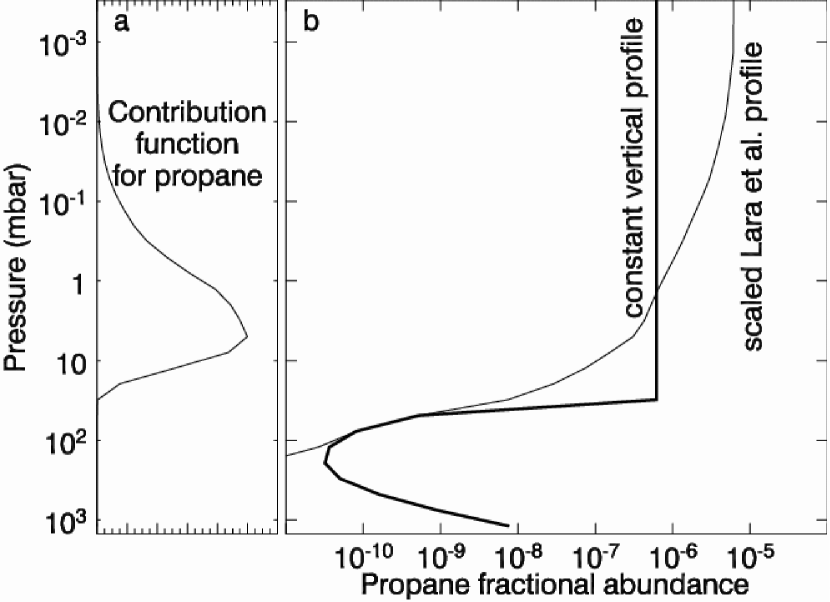
Recent photochemical models (e.g. Lara et al., 1996; Banaszkiewicz et al., 2000) predict that the propane abundance is relatively constant over 400-850 km (11-1.5 bar). Above these altitudes propane is depleted by photolysis and reaction with C2H, while below this range the effect of eddy diffusion and the cold-trap of the tropopause is to reduce the propane abundance. Our observations are primarily sensitive to the pressure range 13-0.24 mbar (90-250 km altitude), as shown in Fig. 4a. We re-fit our spectra using the model predicted propane vertical profile and found a best fit when the model predicted profile is multipled by a factor of 2.9. Figure 4b shows this best-fit scaled profile of Lara et al. (1996) along with the best-fit constant vertical abundance profile. The quality of the fits to our data do not distinguish between these two cases.
The uncertainty in the Yelle et al. (1997) temperature-pressure profile is not well quantified, and therefore our reported uncertainties do not account for this source of error. Roughly, a change in stratospheric temperature of 5 K requires a 20 change in propane abundance.
There is no strong evidence that propane abundance is constant with latitude on Titan. A first attempt at modeling the seasonal variation of photochemistry on Titan (Lebonnois et al., 2001) predicts that propane abundance will vary by a factor of a few from north to south depending on season. With TEXES on an 8-10 meter telescope we would be able to measure the abundance as a function of latitude, which will place new strong constraints on models of seasonal photochemistry.
5. Summary
We present the first spectrally resolved detection of propane in Titan’s atmosphere. We measure propane’s fractional abundance to be , assuming the recommended temperature-pressure profile of Yelle et al. (1997) and a constant abundance with altitude and latitude. Our observations are primarily sensitive to 13-0.24 mbar (90-250 km altitude). Alternatively, our data require the predicted propane profile of Lara et al. (1996) to be increased by a factor of 2.9.
The current theoretical understanding of propane’s vibration-rotation spectrum is inadequate and available linelists do not fit our Titan spectra nor laboratory propane spectra well. Therefore we fit for Titan’s propane abundance using an empirical absorption coefficient spectrum derived from low temperature laboratory spectra of propane.
The most important observational advance that can be made towards detecting new species in planetary atmospheres is to increase the spectral resolving power to few such that individual lines are resolved and separated. High spectral resolution allows us to separate the contribution of a minor species (propane) from a strongly emitting species (acetylene).
References
- Banaszkiewicz et al. (2000) Banaszkiewicz, M., Lara, L. M., Rodrigo, R., López-Moreno, J. J., & Molina-Cuberos, G. J. 2000, Icarus, 147, 386
- Becklin & Neugebauer (1967) Becklin, E. E., & Neugebauer, G. 1967, ApJ, 147, 799
- Blass et al. (1988) Blass, W. E., Ataken, A., Brault, J. W., Daunt, S. J., Halsey, G. W., Jennings, D. E., & Reuter, D. C. 1988, The 13.37 Micron Band of Propane, UTMSL Technical Memorandum, University of Tennessee, Knoxville
- Cohen et al. (1995) Cohen, M., Witteborn, F. C., Walker, R. G., Bregman, J. D., & Wooden, D. H. 1995, AJ, 110, 275
- Coustenis et al. (1989) Coustenis, A., Bezard, B., & Gautier, D. 1989, Icarus, 80, 54
- Coustenis et al. (2003) Coustenis, A., Salama, A., Schulz, B., Ott, S., Lellouch, E., Encrenaz, T. H., Gautier, D., & Feuchtgruber, H. 2003, Icarus, 161, 383
- Duxbury & Gang (1989) Duxbury, G., & Gang, Y. 1989, \jmolspec, 138, 541
- Fischer & Gamache (2002) Fischer, J., & Gamache, R. 2002, J. Quant. Spec. Radiat. Transf., 74, 263
- Gassler et al. (1989) Gassler, G., Reissnauer, B., & Huttner, W. 1989, Zeitschrift fur Naturforschung A, 44, 316
- Giver et al. (1984) Giver, L. P., Varanasi, P., & Valero, F. P. J. 1984, J. Quant. Spec. Radiat. Transf., 31, 203
- Hillman et al. (1992) Hillman, J. J., Reuter, D. C., Jennings, D. E., Bjoraker, G. L., & Blass, W. E. 1992, Spec. Acta. A., 48, 1249
- Jacquinet-Husson, N. and 47 co-authors (1999) Jacquinet-Husson, N. and 47 co-authors. 1999, J. Quant. Spec. Radiat. Transf., 62, 205
- Lacy et al. (2002) Lacy, J. H., Richter, M. J., Greathouse, T. K., Jaffe, D. T., & Zhu, Q. 2002, PASP, 114, 153
- Lara et al. (1996) Lara, L. M., Lellouch, F., Lopez-Moreno, J. J., & Rodrigo, R. 1996, J. Geophys. Res., 101, 23261
- Lebonnois et al. (2001) Lebonnois, S., Toublanc, D., Hourdin, F., & Rannou, P. 2001, Icarus, 152, 384
- Maguire et al. (1981) Maguire, W. C., Hanel, R. A., Jennings, D. E., Kunde, V. G., & Samuelson, R. E. 1981, Nature, 292, 683
- Nadler & Jennings (1989) Nadler, S., & Jennings, D. E. 1989, J. Quant. Spec. Radiat. Transf., 42, 399
- Roe (2002) Roe, H. G. 2002, PhD thesis, University of California, Berkeley
- Rothman, L. S. and 19 co-authors (1998) Rothman, L. S. and 19 co-authors. 1998, J. Quant. Spec. Radiat. Transf., 60, 665
- Toublanc et al. (1995) Toublanc, D., Parisot, J. P., Brillet, J., Gautier, D., Raulin, F., & McKay, C. P. 1995, Icarus, 113, 2
- Typke (1976) Typke, V. 1976, \jmolspec, 63, 170
- Yelle et al. (1997) Yelle, R. V., Strobell, D. F., Lellouch, E., & Gautier, D. 1997, in Huygens: Science, Payload and Mission, 243–256
- Yung, Allen, & Pinto (1984) Yung, Y. L., Allen, M., & Pinto, J. P. 1984, ApJS, 55, 465