Hydra A at Low Radio Frequencies
Abstract
We present new, low-frequency images of the powerful FR I radio galaxy Hydra A (3C 218 (catalog )). Images were made with the Very Large Array (VLA)111operated by The National Radio Astronomy Observatory, a facility of the National Science Foundation operated under cooperative agreement by Associated Universities, Inc. at frequencies of , , and MHz, with resolutions on the order of . The morphology of the source is seen to be more complex and even larger than previously known, and extends nearly (530 kpc) in a North-South direction. The southern lobe is bent to the east and extends in that direction for nearly (200 kpc). In addition, we find that the northern lobe has a flatter spectral slope than the southern lobe, consistent with the appearance of greater confinement to the south. We measure overall spectral indices and .
1 Introduction
Hydra A (3C 218) is a high luminosity Fanaroff-Riley type I (FR I) radio galaxy. Existing radio maps at frequencies greater than 5 GHz have mapped only the central, bright portions of the source. The inner jets extend for roughly along an axis at , and exhibit a high degree of “S” symmetry, which Taylor et al. (1990) suggest may be due to precession of the central engine. Very Long Baseline Array (VLBA) maps at 1.3, 5, and 15 GHz also show a highly symmetric source on parsec scales, while VLBA measurements of HI absorption against the core suggest an HI disk with a height of pc and a rotation axis which is aligned with the jet axis (Taylor 1996). Measurements with the Very Large Array (VLA) did not find any HI absorption against the kpc-scale jets (Dwarakanath, Owen, & van Gorkom 1995). The source has been mapped with low angular resolution (″) at 1500 MHz (Taylor et al. 1990), revealing a far more extended structure which covers nearly in a north-south direction, but obscuring its details. Hydra A has not been studied in detail at any lower radio frequencies.
The host system is identified as a cD galaxy (Matthews, Morgan, & Schmidt 1964) with a double optical nucleus (Ekers & Simkin 1983). It is the dominant member of the poor Abell cluster A780 (Abell 1958), and lies at a redshift (Dwarakanath et al. 1995; Owen, Ledlow & Keel 1995; Taylor 1996). A central gas disk, as measured by optical emission lines, has a rotation axis of (eg. Simkin 1979), in good agreement with the kpc-scale radio jet axis.
The cluster is a strong X-ray source and has been classified as a cooling flow cluster with a mass accretion rate of M⊙ yr-1 (David et al. 2001). Using data from the Chandra telescope, Sambruna et al. (2000) find a point source which is spatially coincident with the radio core, embedded in a diffuse X-ray halo. They interpret this as evidence for a low luminosity active galactic nucleus (AGN), with most of its optical/UV emission obscured by intrinsic reddening.
The high symmetry and near-unity jet-counterjet ratios of the core structures in the VLBA maps suggest that Hydra A is aligned within a few degrees of the plane of the sky on parsec scales (Taylor 1996). However a strong Faraday rotation measure (RM) and asymmetry in both the RM and depolarization between the kpc-scale jets suggest an inclination angle of (Taylor & Perley 1993), with the northern jet lying closer to us. The difference in these measurements may be explained if the jet gas either undergoes a sharp bend or is moving non-relativistically.
Here we present moderate resolution maps of Hydra A at three low-radio frequencies: MHz, MHz, and MHz. Throughout this paper we use H km s-1 Mpc-1, and define spectral index such that S.
2 Radio Data
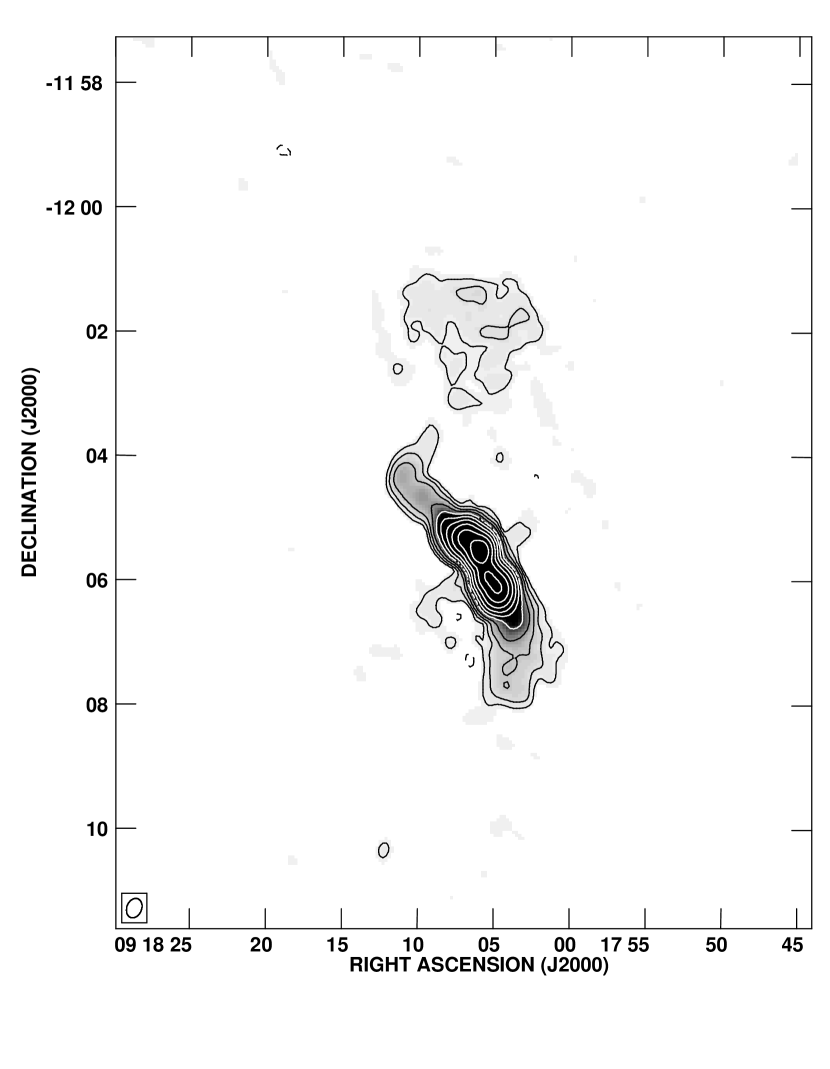
Hydra A was observed in the C- and D-configurations of the VLA at frequencies near 1415 MHz in 1988/1989 (see Table 1). The observations were made in a continuum mode, with bandwidths of 12.5 MHz. The original goal of these observations was to study the polarization properties of the source. We have re-reduced and imaged the data using standard routines in the Astronomical Image Processing System (AIPS). The majority of the flux at this frequency lies in the inner jets. In order to better map the lower flux density features of the weak extended lobes, we improved our dynamic range with a baseline correction, which we calculated using the observed primary flux calibrators 3C 286 and 3C 147. The final image (see Figure 1) has a resolution of at a position angle of . The noise in the map remains limited by the dynamic range, which is 5500:1. In addition, incomplete uv-coverage has led to noise artifacts near the source.
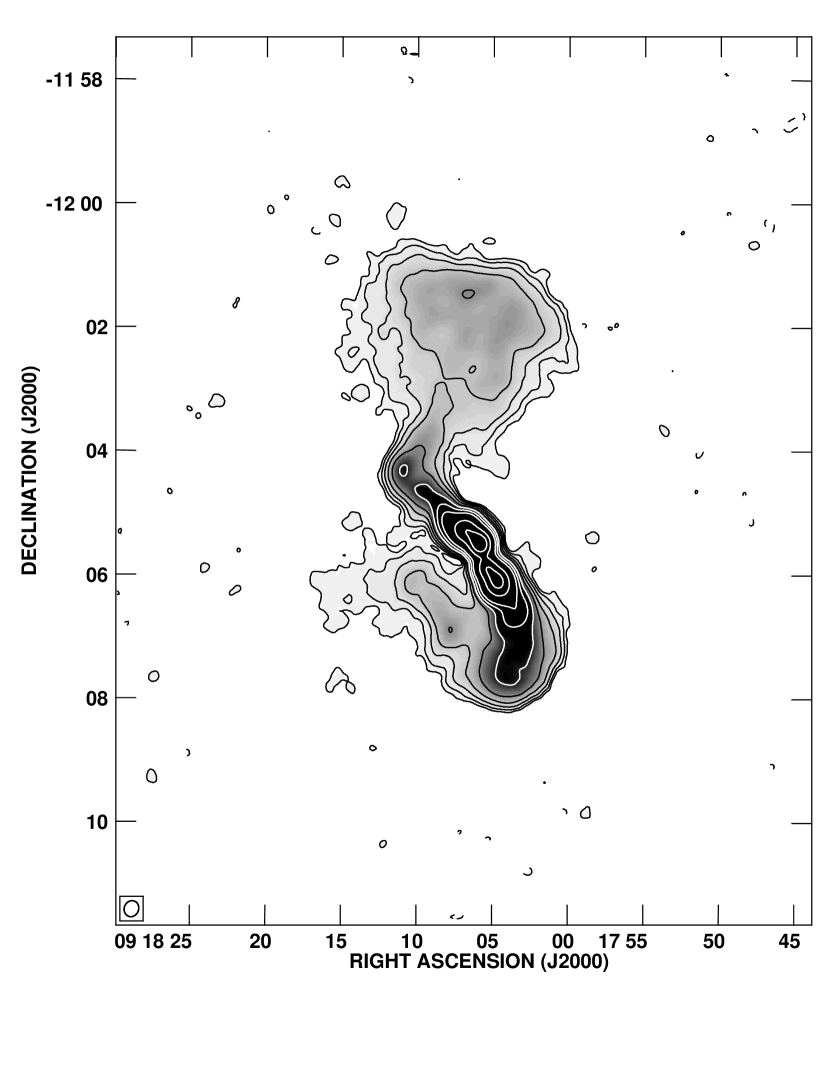
Short observations in the A-, B-, and C- configurations of the VLA were carried out at frequencies near 330 MHz on various dates between 1990 and 1998 (see Table 1). Most of these data were intended to provide phase-referencing information for simultaneous observations at 74 MHz. The observations were set up as multiple short integrations spread out over a wide hour angle range to provide good uv-coverage. Standard calibration observations were used. The data were mapped in AIPS using wide-field imaging techniques, which correct for distortions in the image caused by the non-coplanarity of the VLA over a wide field of view (the 3-D effect) by using a set of small overlapping maps, or “facets” to cover the desired image area (Cornwell & Perley 1992). The rms noise in the final image is limited by the dynamic range of 5000:1 (see Figure 2). The dataset has a maximum resolution of . In order to more clearly show the extended lobe emission we have chosen a display resolution of about .
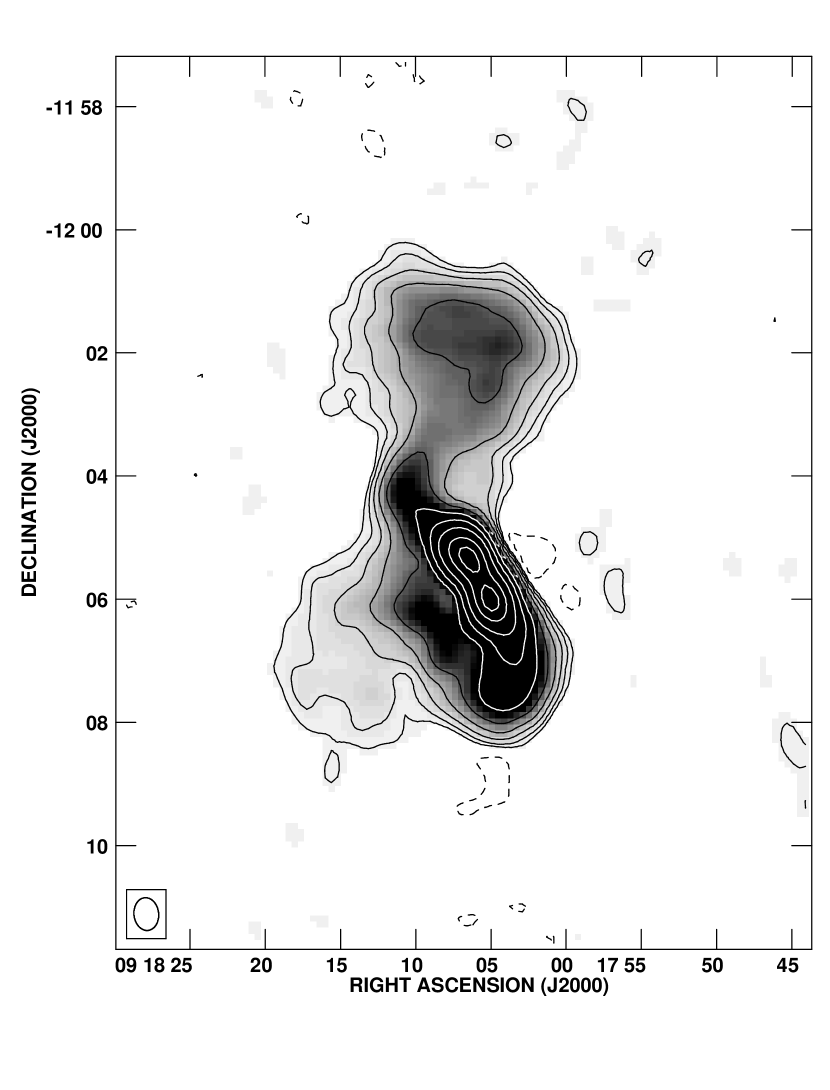
Observations at 74 MHz were made in the A-configuration of the VLA on 2002 April 29 for 4.2 hours. These data were taken as part of a program to observe the galaxy cluster Abell 754 which is located from Hydra A, well within the primary beam of the antennae at 74 MHz, which have a full-width at half maximum of . The data were taken in spectral-line mode to help with radio frequency interference excision, and the total bandwidth is 1.56 MHz. Observations and models of Cygnus A were used to correct the bandpass and set the antenna gains. The data were averaged to a channel resolution of 97.7 kHz and imaged using the wide-field imaging technique described above. One of the individual facets was centered on Hydra A: it is this image we present in Figure 3. The dynamic range in the image is 1450:1, and the rms noise after correcting for the attenuation of the primary beam is 67 mJy bm-1. The angular resolution is at a position angle of .
Maps at all three frequencies do not resolve the core, but show the inner bright jets extending north and south to cover (100 kpc), and longer, outer jets extending (265 kpc). The jets are then seen to bend sharply and expand into diffuse, extended lobes. The northern lobe is seen at all three radio frequencies, while the southern lobe is visible only at the two lower frequencies. The entire structure covers roughly (530 kpc) in a north-south direction, and displays an “S”-shaped appearance.
Previous higher frequency observations did not detect the extended diffuse radio lobes in this source (eg. Taylor et al. 1990). This is not completely a surprise given that the radiative lifetime of the particles is longer at lower frequencies. Although there is currently insufficient data at appropriate sensitivity and resolution combinations to determine if such extended structure is typical of FR1’s as a class, it has been observed in a few other objects (eg., M87; Owen, Eilek & Kassim 2000).
3 Spectral Index
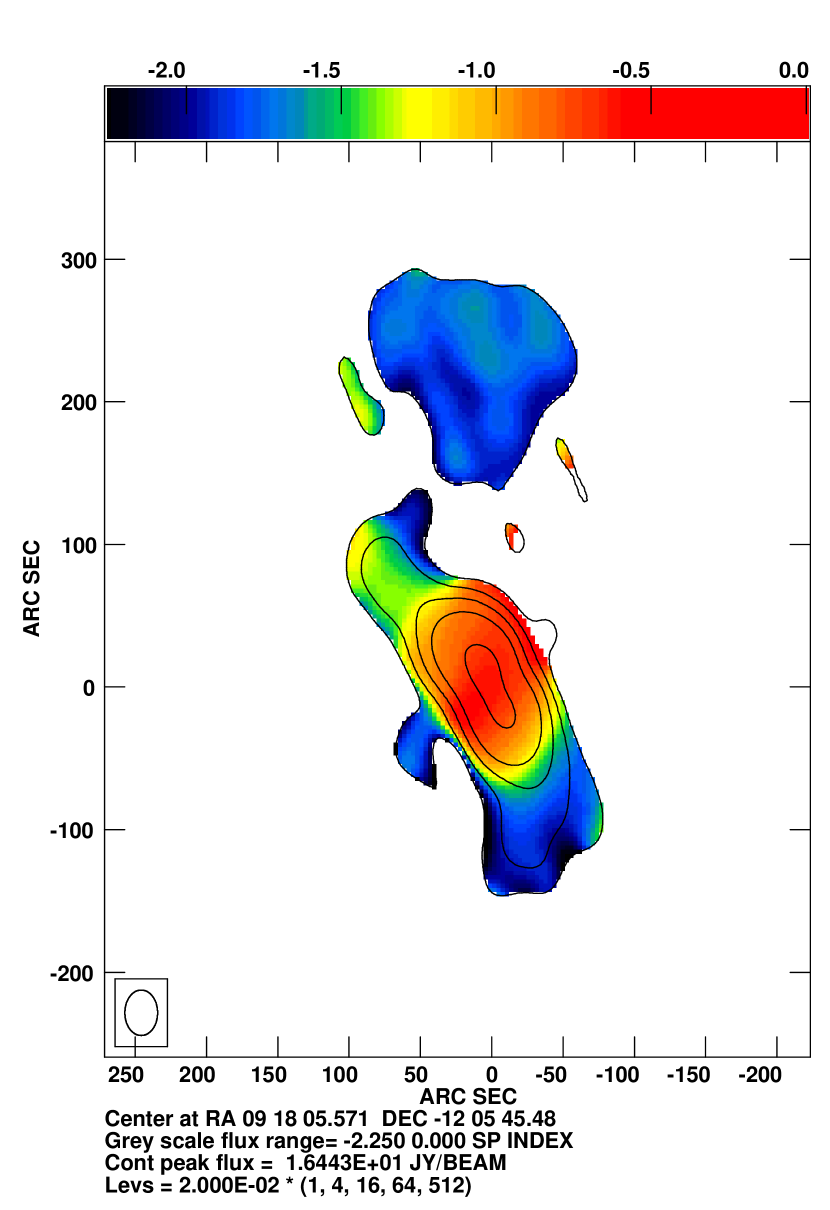
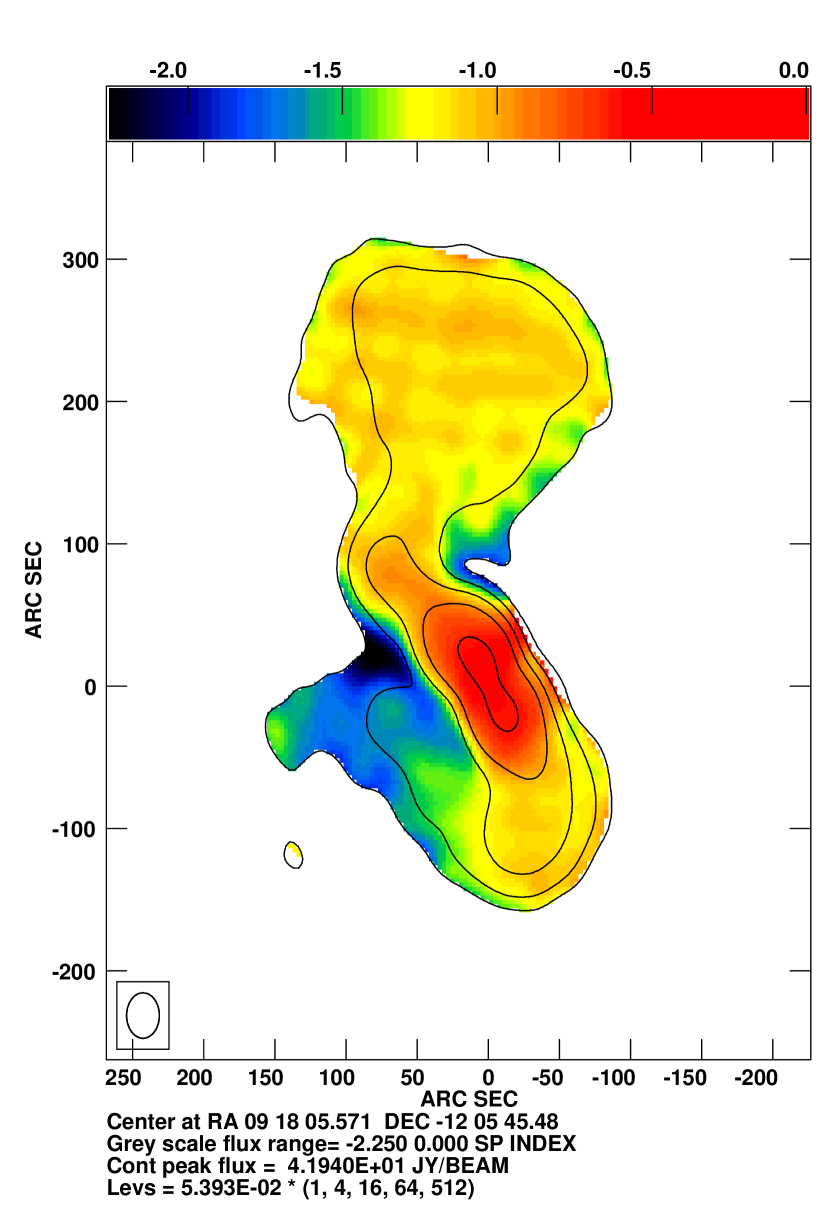
In order to enable a direct comparison between data at different frequencies, the UV-data were limited in UV-range to , and tapered to match the dirty beams as closely as possible at each frequency. An identical clean beam of at a position angle of was used to restore the maps. The images were then aligned, clipped at a level, and combined to create spectral index images (see Figure 4). Errors were estimated based on a combination of the signal to noise ratio at a given pixel, and the assumption of a amplitude calibration accuracy at each frequency. We assume that at these frequencies there are no significant flux density variations in the source over the 14 years spanned by the data.
The spectral index between 1415 and 330 MHz is near the core of the source. The northern jet spectral index changes slowly to at and then reaches as it turns and broadens into the northern lobe. In contrast, the southern jet slope steepens quickly from at , to at . The southern lobe is not reliably detected by the 1415 MHz map.
The 330 to 74 MHz spectral index at the core is . In the northern direction the spectral index decreases gradually to along the arm out to , and reaches in the northern lobe. The apparent small scale structure in the northern lobe is mostly due to low-level doconvolution artifacts in the 74 MHz image. On the southern side, the spectral index reaches at a distance of along the jets, and continues to decrease into the southern lobe, finally reaching .
4 Discussion
There are clear differences between the lower frequency (330 to 74 MHz) spectral index and that at the higher frequency (330 to 1415 MHz) at a given position within Hydra A. In Figure 5 we plot a few representative positions along the northern and southern jets. The difference in spectral index is small but consistent, and significant at greater than a level. The spectral curvature follows an expected pattern (e.g., Parma et al. 2002); the spectral slope is steeper at higher frequencies due to aging of the relativistic particle spectrum over time.
On the other hand the spectral indices calculated from the total flux at each of our three frequencies indicate that the entire source has a spectral slope only slightly steeper than the “typical” extragalactic source spectral index of (Bridle & Perley 1984); we find and (errors are and we assume a flux calibration precision at each frequency). Within the errors, there is little change in the spectral slope over this frequency range. These numbers are also consistent with previous estimates for spectral index in this source (eg. ; Kühr et al. 1981). Using to interpolate the 74 MHz total flux to 178 MHz, we find that Hydra A has W Hz-1 sr-1. This is in good agreement with previous estimates for this source (Taylor 1996).
Finally we note that the northern lobe has a flatter spectral slope than the southern lobe at a given separation from the nucleus. This is consistent with it being both the brighter side of the source and the less depolarized of the two lobes (Taylor 1996; Garrington, Conway, & Leahy, 1991; Liu & Pooley, 1991). It seems probable that the southern emission is turning away from us while the northern emission bends towards us. Thus the geometry and spectral indices support the conclusion that Hydra A is inclined to the plane of the sky, with the northern side lieing closer to us (Taylor 1996).
The northern jet exhibits a turn of about 90 degrees before it expands into a diffuse lobe, and the jet and lobe are clearly separated in the image. In contrast, the radio emission to the south appears to be bent around by nearly 180 degrees before it finally escapes to the East in a diffuse lobe. The steeper spectral slope in the southern jet could be caused by a superposition of the jet and lobe emission along the line of sight. It may also be related to the greater confinement of the radio source to the south.
5 Conclusions
We present moderate resolution VLA maps of Hydra A at 74, 330 and 1415 MHz. These new images reveal a complicated extended structure, only hinted at in previously published maps for this powerful FR I radio source. Nulsen et al. (2002) show that the cool, X-ray emitting gas in the central region of Hydra A extends beyond the 6 cm radio contours. A comparison to our new low frequency observations of Hydra A shows that these cool regions roughly align with the larger scale radio emission. Given the shape and well-defined border of the northern lobe, we suggest that it may in fact be filling a bubble in the X-ray gas, analogous to buoyant structures inferred to exist in clusters such as Perseus A (Fabian et al. 2002). If so, it would be the largest example of such a feature identified to date. A detailed comparison with the X-ray observations would be required to investigate this idea.
References
- Abell (1958) Abell, G. O. 1958, ApJS, 3, 211
- Bridle & Perley (1984) Bridle, A. H. & Perley, R. A. 1984, ARA&A, 22, 319
- Cornwell & Perley (1992) Cornwell, T. J. & Perley, R. A. 1992, A&A, 261, 353
- David et al. (2001) David, L.P., Nulsen, P.E.J., McNamara, B.R., Forman, W., Jones, C., Ponman, T., Robertson, B., & Wise, M. 2001, ApJ, 557, 546
- Dwarakanath, Owen, & van Gorkom (1995) Dwarakanath, K.S., Owen, F.N., & van Gorkom, J.H. 1995, ApJ, 442, L1
- Ekers & Simkin (1983) Ekers, R.D., & Simkin, S.M. 1983, ApJ, 265, 85
- Fabian et al. (2002) Fabian, A. C., Celotti, A., Blundell, K. M., Kassim, N. E., & Perley, R. A. 2002, MNRAS, 331, 369
- Garrington, Conway, & Leahy (1991) Garrington, S. T., Conway, R. G., & Leahy, J. P. 1991, MNRAS, 250, 171
- Kühr, Witzel, Pauliny-Toth, & Nauber (1981) Kühr, H., Witzel, A., Pauliny-Toth, I. I. K., & Nauber, U. 1981, A&AS, 45, 367
- Liu & Pooley (1991) Liu, R. & Pooley, G. 1991, MNRAS, 249, 343
- Matthews, Morgan, & Schmidt (1964) Matthews, T.A., Morgan, W.W., & Schmidt, M. 1964, ApJ, 140, 35
- Nulsen et al. (2002) Nulsen, P. E. J., David, L. P., McNamara, B. R., Jones, C., Forman, W. R., & Wise, M. 2002, ApJ, 568, 163
- Owen, Eilek, & Kassim (2000) Owen, F. N., Eilek, J. A., & Kassim, N. E. 2000, ApJ, 543, 611
- Owen, Ledlow, & Keel (1995) Owen, F.N., Ledlow, M.J., & Keel, W.C. 1995, AJ, 109, 14
- Parma, Murgia, de Ruiter, & Fanti (2002) Parma, P., Murgia, M., de Ruiter, H. R., & Fanti, R. 2002, New Astronomy Review, 46, 313
- Sambruna et al. (2000) Sambruna, R.M., Chartas, G., Eracleous, M., Mushotzky, R.F., & Nousek, J.A. 2000, ApJ, 532, L91
- Simkin (1979) Simkin, S.M. 1979, ApJ, 234, 56
- Taylor (1996) Taylor, G.B. 1996, ApJ, 470, 394
- Taylor & Perley (1993) Taylor, G.B., & Perley, R.A. 1993, ApJ, 416, 554
- Taylor et al. (1990) Taylor, G.B., Perley, R.A., Inoue, M., Kato, T., Tabara, H., & Aizu, K. 1990, ApJ, 360, 41

| Date | Configuration | Frequency | Bandwidth | Integration |
|---|---|---|---|---|
| (MHz) | (MHz) | (min) | ||
| 1988 Aug 14 | D | 1464.9 | 50 | 28 |
| D | 1514.9 | 50 | 28 | |
| 1989 Aug 29 | C | 1415.0 | 12.5 | 80 |
| C | 1430.0 | 12.5 | 80 | |
| C | 1515.0 | 12.5 | 79 | |
| C | 1530.0 | 12.5 | 79 | |
| 1989 Oct 1 | C | 1415.0 | 12.5 | 79 |
| C | 1430.0 | 12.5 | 79 | |
| C | 1515.0 | 12.5 | 79 | |
| C | 1530.0 | 12.5 | 79 | |
| 1990 Mar 31 | A | 320.0 | 6.25 | 36 |
| 1990 Mar 31 | A | 330.0 | 6.25 | 36 |
| 1990 Jul 28 | B | 330.0 | 6.25 | 39 |
| 1992 May 1 | C | 332.9 | 3.125 | 24 |
| 1992 Oct 24 | A | 332.9 | 3.125 | 147 |
| 1993 Feb 27 | B | 332.9 | 3.125 | 36 |
| 1993 Jul 8 | C | 332.9 | 3.125 | 57 |
| 1995 Jul 1 | A | 333.0 | 3.125 | 20 |
| 1995 Aug 6 | A | 332.9 | 3.125 | 45 |
| 1995 Oct 15 | B | 332.9 | 3.125 | 64 |
| 1998 Mar 8 | A | 327.5 | 3.125 | 7 |
| 1998 Oct 4 | B | 327.5 | 3.125 | 15 |
| 1998 Dec 4 | C | 327.5 | 3.125 | 10 |
| 2002 Apr 29 | A | 73.8 | 1.56 | 252 |