The Clustering of Intergalactic Metals
Abstract
We measure the spatial clustering of metals in the intergalactic medium from to , as traced by 643 C iv and 104 Si iv cm-2 absorption systems in 19 high signal-to-noise (40-80) and high resolution () quasar spectra. The number densities and two-point correlation functions of both these species are largely constant with redshift, suggesting the bulk of metal ejection occurred at However, at some additional signature appears in the C iv correlation function at 500 km/s, associated with four strong and peculiar systems. At all redshifts, the C iv and Si iv correlation functions exhibit a steep rise at large separations and a flatter profile at small separations, with an elbow occurring at km/s. We show that these properties are consistent with metals confined within bubbles with a typical radius about sources of mass , and use numerical simulations to derive best-fit values of comoving Mpc and at . This does not exclude that metals could have been produced at higher redshifts in smaller, but equally rare, objects. At the level of detection of this survey, IGM enrichment is likely to be incomplete and inhomogeneous, with a filling factor
Subject headings:
intergalactic medium, quasars: absorption lines, cosmology: observations, large-scale structure of the universe1. Introduction
No one knows where they came from, how they got there, or when it happened, but quasar (QSO) absorption line studies have encountered heavy elements in all regions of the tenuous intergalactic medium (IGM) in which they were detectable (eg. Songalia & Cowie 1996). First, measurements of indicated that typically in somewhat overdense regions at , with an order of magnitude scatter (eg. Rauch, Haehnelt, & Steinmetz 1997). Later, statistical methods pushed further, showing that C iv may be present in underdense regions (Ellison et al. 2000), and that a minimum IGM metallicity of approximately is already in place at (Songaila 2001; hereafter S01). Although the presence of metals in underdense regions has not yet been firmly established (eg. Petitjean 2001; Carswell et al. 2002; Schaye et al. 2003; Aracil et al. 2003a), their very existence outside galaxies has profound cosmological implications.
As the long cooling times of large clouds of primordial composition are shortened by even modest levels of enrichment (Sutherland & Dopita; Scannapieco & Broadhurst 2001), IGM metals accelerated the formation of massive () galaxies. Similarly, the violent events that ejected heavy elements from galaxies have important implications for the thermal and velocity structure of the IGM (eg. Gnedin & Ostriker 1997), and would have exerted strong feedback on dwarf galaxies forming nearby (eg. Thacker, Scannapieco, & Davis 2002).
Still, no one knows where they came from. Although numerous starburst-driven outflows have been observed at (Pettini et al. 2001; Frye, Broadhurst, & Benitez 2002), it is unclear whether such objects are responsible for the majority of IGM enrichment. In fact a variety of theoretical arguments suggest that these galaxies represent only the tail of a larger population of small “pre-galactic” starbursts that formed earlier (Madau, Ferrara, & Rees 2001; Scannapieco, Ferrara, & Madau 2002). On the other hand active galactic nuclei are observed to host massive outflows (Weyman 1997), whose contribution remains unknown. Finally, theoretical studies have suggested that the primordial generation of metal-free stars were very massive (eg. Schneider et al. 2002), resulting in a profusion of tremendously powerful pair-production supernovae that distributed metals at (Bromm et al. 2003).
This paper describes the first direct attempt to use clustering measurements to discriminate between these disparate models. Making use of 643 C iv and 104 Si iv absorption systems, measured in 19 high signal-to-noise quasar spectra, we are able to place strong constraints on the spatial distribution of intergalactic metals at intermediate redshifts ( and a detection limit of cm-2). Whatever the objects that enriched the IGM, it is clear that they formed in the densest regions of space, regions that were highly clustered. As this “geometrical biasing” is a systematic function of mass (eg. Kaiser 1984), the large-scale clustering of metal-line systems encodes valuable information on the masses of the sources from which they were ejected. Likewise, we are able to relate the small-scale clustering of metals to the typical radius enriched by each source.
The structure of this work is as follows. In §2 we summarize the properties of our data set and reduction methods. In §3 we present the number density of C iv and Si iv absorption systems and their two point correlations. In §4 we compare these correlations with simulations to constrain the masses and ejection energies of the sources responsible for IGM metal enrichment. A discussion is given in §5.
2. Data Set and Reduction
2.1. Observations
The ESO Large Programme “The Cosmic Evolution of the IGM” was devised to provide a homogeneous sample of QSO sight-lines suitable for studying the IGM from = 1.74.5. High resolution ( 45000), high signal-to-noise (40 and 80 per pixel at 3500 and 6000 Å, respectively) spectra were taken over the wavelength ranges 3100–5400 and 5450–9000 Å, using the UVES spectrograph on the Very Large Telescope. Although the complete emission redshift range is covered, emphasis is given to lower redshifts, and the C iv and Si iv metal lines discussed in this paper were well-detected over the redshift ranges of 1.5-3.0 and 1.8-3.0 respectively, as described in Table 1.
Observations were performed in service mode over two years. The data were reduced using the UVES context of the ESO MIDAS data reduction package, applying the optimal extraction method, and following the pipeline reduction step by step. The details of this reduction and spectrum normalization are described in further detail in Aracil et al. (2003a).
Name Coverage C iv Si iv PKS2126158 3.280 2.363.24 2.743.24 Q0420388 3.117 2.233.08 2.593.08 HE09401050 3.084 2.213.04 2.563.04 HE23474342 2.871 2.042.83 2.382.83 HE01514326 2.789 1.972.75 2.312.75 Q0002422 2.767 1.962.73 2.292.73 PKS0329255 2.703 1.912.66 2.232.66 Q0453423 2.658 1.872.62 2.192.62 HE13472457 2.611 1.832.57 2.152.57 HE11581843 2.449 1.712.41 2.012.41 Q0329385 2.435 1.702.40 2.002.40 HE22172818 2.414 1.682.37 1.982.37 Q11221328 2.410 1.682.37 1.982.37 Q01093518 2.404 1.672.36 1.972.36 HE00012340 2.263 1.562.22 1.842.22 PKS023723 2.222 1.532.18 1.812.18 PKS1448232 2.220 1.532.18 1.812.18 Q0122380 2.190 1.502.15 1.782.15 HE13411020 2.135 1.462.10 1.742.10
Table 1. List of lines of sight. Here is the quasar emission redshift. Only C iv and Si iv systems detected redward of the Ly forest and at least 3000 km/s blueward of are used.
2.2. Line Identification
Metal-line systems were identified using an automated two-step procedure. For each species we applied a pixel-by-pixel procedure which compared the spectrum with one that was rescaled and shifted according to the ratio of the oscillator strengths, extracting the minimal flux and accounting for blends. A detection threshold was then applied to these spectra, such that only absorption features with equivalent widths (EWs) larger than 5 times the noise rms were accepted. Finally a set of physical criteria were applied, to eliminate false detections.
For each identified system the final decomposition into subcomponents was carried out using VPFIT (Carswell et al. 1987). For each component, initial values were taken from the central wavelengths of the sub-features, while initial values for the Doppler parameter and column density were computed directly from the EW and peak absorption of each sub-feature. This procedure is described in detail in Aracil et al. (2003b) and has been tested on simulated spectra, doing well for all systems with realistic values of and .
Finally we applied a set of four cuts to the automated list generated by VPFIT: due to the detection limit of our procedure, km/s to avoid false detections due to noise spikes, to remove two very badly saturated subcomponents, and km/s to avoid false systems due to errors in continuum fitting. Our cuts resulted in a final data set of 643 C iv and 104 Si iv systems, drawn from an original sample of 748 and 149 respectively.
3. Analysis
3.1. Distribution Functions
This sample was first used to compute the column density distribution function . Following Tytler (1987), is defined as the number of absorbing systems per unit column density and per unit redshift path . In an universe, which is a reasonable approximation over the redshift range considered, does not evolve for a population whose physical size and comoving space density are constant.
![[Uncaptioned image]](/html/astro-ph/0309646/assets/x1.png)
Fig. 1.—Column density distribution of C iv (upper panel) and Si iv (lower panel) absorption systems. In each panel, systems are divided
into two redshift bins: (squares) and (triangles). Column density bins are
cm-2 wide and error bars are given, computed from
the variance of the data between spectra. The dashed lines are the
power law fit measured in S01.
In Fig. 1 we plot for both C iv and Si iv systems, dividing our sample into two redshift bins (1.5-2.3 and 2.3-3.1). Both species are consistent with a lack of redshift evolution, as found by previous studies of C iv and Si iv absorption systems (S01; Ellison et al. 2000). Furthermore the overall density distribution of C iv is consistent with a power-law of the form as fit by S01. From this figure, we see that some incompleteness sets in around cm-2. While fewer in total, Si iv systems are also consistent with a lack of evolution, and follow a similar power law with a lower overall magnitude.
3.2. Clustering of Metal Absorption Systems
Having constructed a sample of well-identified metal absorption systems, whose distributions are consistent with previous measurements, we then computed their two-point correlation function in redshift space, . This quantity was last studied by Rauch et al. (1996) and Boksenberg, Sargent, & Rauch (2003) who noted a marked similarity between of C iv and Mg II (see also Petitjean & Bergeron 1990, 1994). For each quasar, we computed a histogram of all velocity separations and divided by the number expected for a random distribution. We then combined these distributions, weighting them according to the number of pairs in each quasar, yielding . The corresponding error bars were computed according to the appropriate weighted variance between quasars.
![[Uncaptioned image]](/html/astro-ph/0309646/assets/x2.png)
Fig. 2.—Two point correlation function of C iv (upper panel) and
Si iv (lower panel) absorption systems. In each panel our systems
have been divided into two redshifts bins, with symbols as in Fig. 1.
The solid line in the upper panel includes the four unusual
low-redshift systems (see text).
The resulting correlation functions are shown in Fig. 2, again split into two redshift bins. While the spatial distribution of both species shows no evolution at separations km/s, our comparison uncovers a low-redshift feature in the 500 km/s C iv bin. This we have traced back to arising from four extended systems amongst our 19 QSO sightlines, and seems to be due to some peculiarity in the internal structure of these systems. These will be studied in detail in a future publication, and are excluded from our model comparisons below, although this cut has no effect on our final fits.
The overall shape and amplitude of the C iv and Si iv correlation functions are strikingly similar and are consistent to within the Si iv measurement errors. Both functions exhibit a steep rise at large separations and a flatter profile at small separations, with an elbow occurring at km/s. Unlike Ly absorption systems (see Cristiani et al. 1997), the correlation of C iv does not seem to depend strongly on absorption column densities. While choosing subsets below a fixed increases the noise of our measurements, the shape of is preserved to within error bars.
4. Constraints on Metal Sources
The two-slope shape of the measured correlation functions is highly suggestive of a picture in which metal bubbles of a typical size (associated with the small scale clustering) are generated about objects of a typical mass (whose geometrical bias is associated with the large-scale clustering) (see also Petitjean & Bergeron 1990). In order to explore this connection further, we generated a simple model, based on a dark-matter-only simulation. As no evolution was detected, and the properties of both species were similar, we focused our attention on comparing the properties of C iv absorbers with simulated groups at a single representative redshift of three.
We adopted a Cold Dark Matter cosmological model with , = 0.3, = 0.7, , , and , where , , and are the total matter, vacuum, and baryonic densities in units of the critical density (), is the variance of linear fluctuations on the scale, and is the “tilt” of the primordial power spectrum. We made use of a simulation with dark matter particles, contained with a box comoving Mpc on a side. The mass of each particle was , which gives a minimum mass resolution for our group finding of as we select only groups with 40 or more particles. The initial conditions were produced using GRAFIC (Bertschinger 2001) and were used as the inputs to the parallel version of GADGET (Springel et al. 2001). Halo detection was performed using the HOP algorithm (Eisenstein & Hut 1998) with the cuts , , and .
The resulting list of groups was then used to construct a simple simulated picture of IGM metal enrichment. We selected all groups above a threshold group mass as markers of the centers of enrichment events, about which we painted spheres of radius . Note that our choice of this set is not meant to imply that enrichment occurred at , but rather that it occurred at an unknown redshift higher than the observed range, centered on groups whose large-scale clustering was equivalent to objects of mass . All smaller groups within such spheres were associated with C iv absorbers, each with an overall impact parameter equal to a factor times its dark matter radius. The observed number of C iv systems per unit redshift path was well-reproduced by fixing
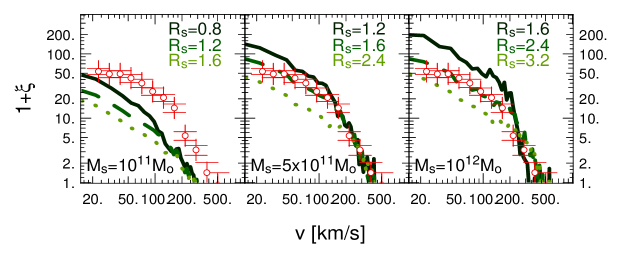
Thirty-two planes were taken, and for each plane all 512 sightlines were drawn; the average two-point correlation was then compared with detected values, as shown in Fig. 3. As expected, the large scale correlations are almost completely dependent on while the position of the elbow in is set by . Our measurements are clearly suggestive of Mpc and objects, corresponding to a filling factor of , at the level of detection of our survey. Varying over a wide range of values has only a minor impact on this comparison, changing the inner slope of slightly while giving a much poorer fit for the overall number of systems.
A straightforward geometric argument allows us to associate with a wind ejection energy per object, . Here we adopt a simple picture in which the average bubble expands according to a Sedov-Taylor solution (Sedov 1959). In this case is related to the bubble radius as , where is the expansion time and is in physical units such that , where is the redshifts of observation, respectively. If we assume for simplicity that is approximately the Hubble time (2.3 Gyrs at in our cosmological model) and that the shell expands into material at the mean density at this redshift, this gives erg, which is equal to the kinetic energy input from roughly TypeII supernovae (SNIIe). This is roughly consistent with the overall number of C iv systems, which can be converted into a cosmological density of as described in S01.
5. Discussion
We have studied the clustering of 643 C iv and 104 Si iv systems detected in UVES observations of 19 high- QSOs using an automatic procedure. The independently derived correlation functions of C iv and Si iv are similar, giving confidence in our automated approach. The shape of the correlation function is consistent with a picture where metals are confined within bubbles of Mpc about halos at . This implies that the filling factor of the metals is only 10% at the detection limit of the survey.
As our overall mass constraint is derived only from the geometrical bias of the sources, however, we cannot exclude models in which equally rare, but somewhat smaller higher-redshift objects are responsible for metal enrichment. Furthermore, the observed number density of C iv shows little evolution at as at higher redshift (eg. S01). While more detailed investigations are necessary, it remains that all such models will be strongly constrained by the clustering of intergalactic metals.
References
- (1)
- (2) Aracil, B. Petitjean, P., Pichon, C., & Bergeron, J. 2003a, ApJ, submitted
- (3) Aracil, S., Pichon, C., Petitjean, P., & Thiébaut, E. 2003b, in preparation
- (4) Bertschinger, E. 2001, ApJS, 137, 1
- (5) Boksenberg, A., Sargent, W. L. W., & Rauch, M. 2003, ApJ, submitted (astro-ph/0307557)
- (6) Bromm, V., Yoshida, N., & Hernquist, L. 2003, ApJL, submitted (astro-ph/0305333)
- (7) Carswell, R. F., Schaye, J., & Kim, T. S. 2002, ApJ, 578, 43
- (8) Carswell, R. F., Webb, J. K., Baldwin, J. A., & Atwood, B. 1987, ApJ, 319, 709
- (9) Cristiani, S., D’Odorico, S., D’Odorico V., Fontana, A., Giallongo, E., & Savaglio, S., 1997, MNRAS, 285 209
- (10) Ellison, S. L., Songaila, A., Schaye, J., & Pettini, M. 2000, AJ, 120, 1175
- (11) Eisenstein, D. J. & Hut, P. 1998, ApJ, 498, 137
- (12) Frye, B., Broadhurst, T., & Benitez, N., 2002, ApJ, 568, 558
- (13) Gnedin, N. Y. & Ostriker, J. P. 1997, ApJ, 486, 581
- (14) Kaiser, N. 1984, ApJ, 284, L9
- (15) Madau, P., Ferrara, A., & Rees, M. J. 2001, ApJ, 555, 9
- (16) Petitjean, P. & Bergeron, J. 1990, A&A, 231, 309
- (17) Petitjean, P. & Bergeron, J. 1994, A&A, 283, 759
- (18) Petitjean, P. 2001, ApSS 277, 517
- (19) Pettini, M. et al. 2001, ApJ, 554, 981
- (20) Rauch, M., Sargent, W. L., Womble, D. S., & Barlow, T. A. 1996, ApJ, 467, L5
- (21) Rauch, M., Haehnelt, M.G., & Steinmetz, M. 1997, ApJ, 481, 601
- (22) Scannapieco, E. & Broadhurst, T. 2001, ApJ, 549, 28
- (23) Scannapieco, E., Ferrara, A., & Madau, P. 2002, ApJ, 574, 590
- (24) Schaye, J., Aguirre, A., Kim T.-S., Theuns, T., Rauch, M., & Sargent, W. L. W. 2003, ApJ, accepted (astro-ph/0306469)
- (25) Schneider, R., Ferrara, A., Natarajan, P., & Omukai, K. 2002, ApJ, 571, 30
- (26) Sedov, L. I. 1959, (New York: Academic Press)
- (27) Songaila, A. 1996 & Cowie L. L. 1996, AJ, 112, 335
- (28) Songaila, A. 2001, ApJ, 561, L153 (S01)
- (29) Springel, V., Yoshida, N., & White, S. D. M. 2001, NewA, 6, 79
- (30) Sutherland, R. S., & Dopita, M. A. 1993, ApJS, 88, 253
- (31) Thacker, R. J., Scannapieco, E., & Davis, M. 2002, ApJ, 202, 581
- (32) Tytler, D. 1987, ApJ, 321, 49
- (33) Weymann, R. J. 1997, in ASP Conf. Ser. 128, Mass Ejection from AGN, ed. N. Arav, I. Shlosman, R. J. Weymann (San Francisco: ASP), 3
- (34)