SN 2003du: Signatures of the Circumstellar Environment in a Normal Type Ia Supernova? 111Based on observations obtained with the Hobby-Eberly Telescope, which is a joint project of the University of Texas at Austin, the Pennsylvania State University, Stanford University, Ludwig-Maximillians-Universitaet Muenchen, and Georg-August-Universitaet Goettingen.
Abstract
We present observations of the Type Ia supernova 2003du obtained with the Hobby∗Eberly Telescope (HET) and report the detection of a high-velocity component in the Ca II infrared triplet near 8000 Å, similar to features previously observed in SN 2000cx and SN 2001el. This feature exhibits a large expansion velocity ( 18,000 km s-1) which is nearly constant between and days relative to maximum light, and disappears shortly thereafter. Other than this feature, the spectral evolution and light curve of SN 2003du resemble those of a normal SN Ia.
We consider a possible origin for this high-velocity Ca II line in the context of a self-consistent spherical delayed-detonation model for the supernova. We find that the Ca II feature can be caused by a dense shell formed when circumstellar material of solar abundance is overrun by the rapidly expanding outermost layers of the SN ejecta. Model calculations show that the optical and infrared spectra are remarkably unaffected by the circumstellar interaction and the resulting shell. In particular, no hydrogen lines are detectable in either absorption or emission after the phase of dynamic interaction. The only qualitatively different features in the model spectra are the strong, high velocity feature in the Ca II IR-triplet around 8,000 Å, and a somewhat weaker O I feature near 7,300 Å. The Doppler shift and time evolution of these features provides an estimate for the amount of accumulated matter (decreasing Doppler shift with increasing shell mass) and also an indication of the mixing within the dense shell. For high shell masses (), the high-velocity component of the Ca II line merges with the photospheric line forming a broad feature. A cut-off of the blue wings of strong, un-blended lines (particularly the Si II feature at about 6,000 Å) may also be observable for larger shell-masses. The model SN Ia light curves are little effected except at very early times when the shell is partially optically thick due to Thomson scattering, resulting in larger colors by up to .
We apply these diagnostic tools to SN 2003du and infer that about of solar abundance material may have accumulated in a shell prior to the observations. Furthermore, in this interpretation, the early light curve data imply that the circumstellar material was originally very close to the progenitor system, perhaps from an accretion disk, Roche lobe, or common envelope. Because of the observed confinement of Ca II in velocity space and the lack of ongoing interaction inferred from the light curve, the matter cannot be placed in the outer layers of the exploding white dwarf star or related to a recent period of high mass loss in the progenitor system prior to the explosion. We note that the signatures of circumstellar interaction could be rather common in SNe Ia and may have eluded discovery because optical spectra often do not extend significantly beyond 7500 Å.
1 Introduction
There is general agreement that Type Ia Supernovae (SNe Ia) result from some process involving the combustion of a degenerate C/O white dwarf (WD) (Hoyle & Fower, 1960). Within this general picture, two classes of models are most likely: (1) An explosion of a C/O-WD with a mass close to the Chandrasekhar limit (), which accretes matter through Roche-lobe overflow from an evolved companion star (Whelan & Iben, 1973). In this case, the explosion is triggered by compressional heating near the WD center. Alternatively, (2) the SN could be an explosion of a rotating configuration formed from the merging of two low-mass WDs, after the loss of angular momentum due to gravitational radiation (Webbink, 1984; Iben & Tutukov, 1984; Paczyński, 1985). Candidate progenitor systems have been observed for both scenarios: WD binary systems with the correct period to merge in a Hubble time and an appropriate total mass (Maxted, March & North, 2000); and supersoft X-ray sources (Greiner, Hasinger & Kahabka, 1991; Van den Heuvel et al, 1992; Rappaport et al., 1994; Kahabka & van den Heuvel, 1997) showing accretion onto the WD from an evolved companion. However, there are still open questions about the details of both the merging and accretion processes (e. g. Nomoto, 1982; Benz et al., 1990; Piersanti et al., 2000; Nomoto et al., 2000, 2003).
From the observed spectral and light curve properties, the first scenario appears to be the most likely candidate for the majority of normal SNe Ia. In particular, delayed detonation (DD) models (Khokhlov, 1991; Yamaoka et al., 1992; Woosley & Weaver, 1994) have been found to reproduce the majority of the observed optical/infrared light curves (LC) and spectra of SNe Ia reasonably well (Höflich, 1995a; Fisher et al., 1995; Höflich & Khokhlov, 1996; Wheeler et al., 1998; Lentz et al., 2001; Höflich et al., 2002). In the DD scenario, a slow deflagration front turns into a detonation. We note, however, that detailed analyses of the observed spectra and light curves indicate that mergers may still contribute to the supernova population (Höflich & Khokhlov, 1996; Hatano et al., 2000). For recent reviews see Branch (1999); Hillebrandt & Niemeyer (2000); Höflich et al. (2003).
In both of these scenarios, a certain amount of loosely bound material associated with the mass transfer is likely to remain in the system at the time of the explosion. In the binary mass transfer scenario, the donor star itself may be the source of such material. Based on hydrodynamic calculations, Marietta, Burrows, & Fryxell (2000) found that the SN ejecta wraps around the donor star and, depending on the donor’s evolutionary phase, may strip off up to several tenths of a solar mass of H/He rich gas. As a result, H or He might be observed with expansion velocities of a few hundred km s-1. To date, however, no convincing evidence for this kind of stripped material has been observed.
Indeed, a number of possible signatures of interaction with a circumstellar environment have been studied, including X-rays (Schlegel & Petre, 1993; Schlegel, 1995), radio (Boffi & Branch, 1995) and, most often, narrow absorption and emission lines due to H I, He I, and He II lines (Chugai, 1986; Livne, Tuchman, & Wheeler, 1992; Branch et al., 1995). However, most SNe Ia show no observational evidence for any of these indicators. The most comprehensive search for H I emission lines been done for SN 1994D by Cumming et al. (1996) who found an upper limit for the progenitor mass loss of .
Similarly in the case of WD mergers, the exploding star is expected to be surrounded by debris from the merging process which will not undergo thermonuclear burning (e. g. Benz et al., 1990). Khokhlov, Müller, & Höflich (1993) showed that the interaction of the supernova with this material may lead to a shell structure in the ejecta, and the observable consequences for the SN light curve and spectra have been studied subsequently (Höflich & Khokhlov, 1996). Although a few events (e. g. SN 1990N; Höflich & Khokhlov 1996) show some evidence for this kind of structure, a strong case for such a shell has yet to be found.
Thus, despite significant progress in our understanding of Type Ia supernovae, we still have few observational constraints on the progenitor environment. Likewise, little is known about the variety of the progenitor systems Wheeler (1991).
However, the recent discovery of strong hydrogen lines in SN 2002ic (Hamuy et al., 2003) has drawn new interest in this subject, and emphasized the importance of detecting circumstellar material as a tool for understanding the progenitor system. Whereas most of the optical spectrum of SN 2003ic closely resembles that of a normal SN Ia, it also exhibits H lines similar to those seen in SNe IIn with both broad and narrow components. Significantly more than of H-rich material is required to explain the features in SN 2003ic, with the H-rich gas at distances between –cm. This matter might be attributed to a short period of high mass loss in a binary system or during a planetary nebula phase several thousand years before the explosion (Hamuy et al., 2003; Wang et al., 2003b; Livio & Riess, 2003).
In this work, we revisit the question of circumstellar interaction in SNe Ia in the context of a high-velocity component of the Ca II infrared triplet feature, which we observe in the optical spectra of SN 2003du. Similar strong, high-velocity Ca II components have been observed in SN 2001el, an otherwise normal SN Ia (Krisciunas et al., 2003), and also in the unusual supernova SN 2000cx (Li et al., 2001; Thomas et al., 2003). In SN 2001el, this high-velocity Ca II feature was well separated in velocity space from the photospheric calcium, and was strongly polarized (Wang et al., 2003a). Wang et al. (2003a; see also Kasen et al. 2003) suggest that this feature in SN 2001el could be a consequence of nuclear burning in the WD (perhaps during the deflagration to detonation transition) which causes the ejection of a high-velocity, Ca-rich filament. Alternatively, they suggest that it might be attributed to the surrounding accretion disk likely having undergone nuclear burning to increase the Ca abundance.
We note that observations of some other SNe Ia have also shown a high-velocity component of the Ca II IR triplet (e.g. SN 1994D; Hatano et al. 1999; Fisher et al. 2000), which may be understood as a transient ionization effect when Ca III recombines to Ca II (Höflich, Wheeler, & Thielemann, 1998). However, given the steep density gradient expected in the outer regions of the SN ejecta, it may be difficult to create a high-velocity Ca II feature as persistent as those seen in SN 2000cx, and SN 2001el (or in SN 2003du).
Through a quantitative study of the formation of this IR Ca II feature and related spectral properties, we examine a possible signature of solar abundance circumstellar matter. In § 2, we discuss the observations and data reduction. In § 3, we use detailed models for the explosion, light curves and spectra to study the signatures of the accumulation of hydrogen-rich matter by a SNe Ia. We then develop these signatures as diagnostic tools for probing the circumstellar environment of SNe Ia. In § 4, these tools are applied to the observations of SN 2003du, and we show that the spectral features are consistent with a H-rich shell formed by the interaction with matter related to the mass transfer in the progenitor system. Finally, in § 5 we discuss the results in the general context and address the limits of our study.
2 Observations and Data Reduction
SN 2003du was discovered in UGC 9391 by LOTOSS (Schwartz & Holvorcem, 2003) on 22 April 2003 (UT) at about . It was classified as Type Ia by Kotak & Meikle (2003) on 24 April 2003 and resembled SN 2002bo about two weeks before maximum light.
We obtained low-resolution () optical spectra of SN 2003du using the Marcario Low Resolution Spectrograph (LRS; Hill et al. 1998) on the Hobby∗Eberly Telescope (HET; Ramsey et al. 1998). For each epoch, two different setups were used giving effective wavelength ranges of 4100–7800 Å and 5150–10 000 Å. The data for each setup were reduced separately using standard IRAF routines, and then flux-matched in the overlapping region and combined to create a single 4100–10 000 Å spectrum for each night. Relative spectrophotometric calibration was accomplished by observing standards from Massey et al. (1988), Massey & Gronwall (1990), and Oke (1990). We are not able to obtain accurate absolute fluxes with LRS due to the time-variable effective aperture of the HET, and so the absolute flux levels of these spectra are only approximate.
In addition to the HET spectroscopic observations, we also imaged SN 2003du with the 0.45 m robotic ROTSE IIIb telescope (Akerlof et al., 2003) to obtain an un-filtered broad-band light-curve. ROTSE IIIb observed SN 2003du at roughly 1 hour intervals during each night when conditions were safe to open the telescope enclosure. The data were processed using the ROTSE automated reduction pipeline software, which delivers magnitudes for every source identified, relative to the red magnitudes of USNO A2.0 stars in the field. The pipeline photometry typically show a scatter of about 0.1 – 0.2 mag for all well-detected sources. (These data have been acquired during the commissioning phase of ROTSE and test images suggest that the reduced CCD frames are significantly more accurate than the results of the current ROTSE pipeline.) For this work, we averaged the output of the pipeline data for each night and the resulting light curve is presented in Figure 1. The arrows indicate the timing of the HET observations, as well as the timing of one epoch, near maximum-light, of UBVRI observations obtained using the 0.8 m telescope at McDonald Observatory.
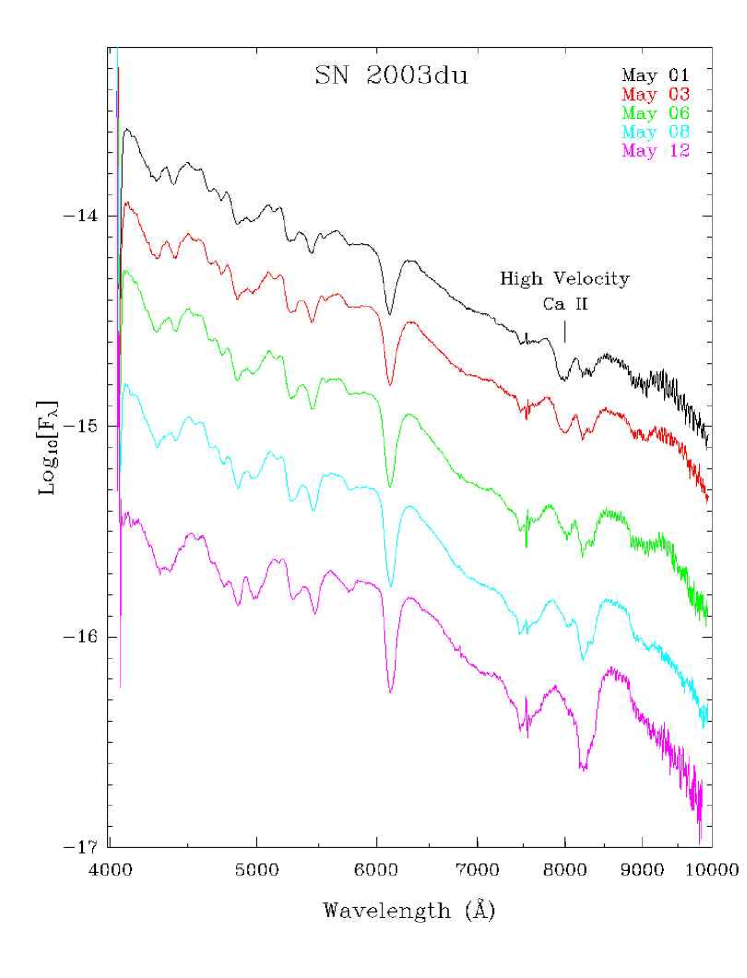
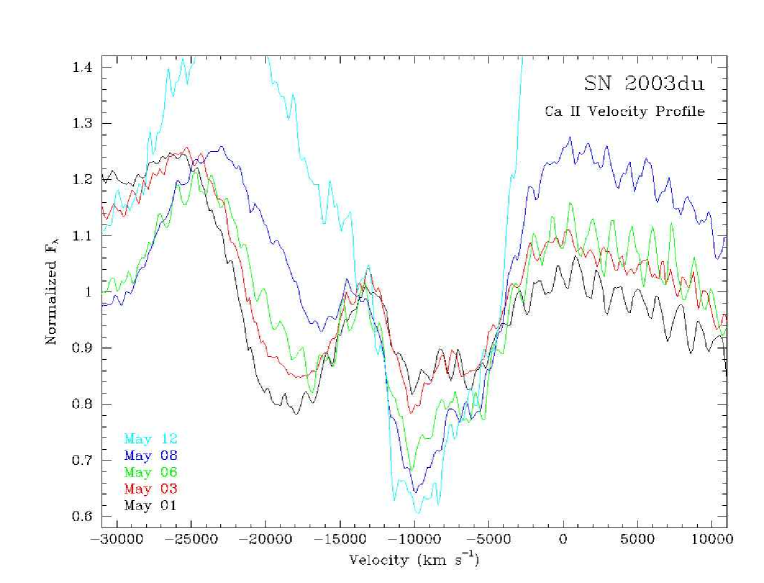
The observed spectroscopic evolution of SN 2003du is presented in Figure 2. These spectra exhibit a high-velocity blueshifted component in the Ca II feature near 8000 Å. The Doppler shift of this feature ( km s-1) remains well above the photospheric velocity ( 11,000 km s-1) until the feature fades shortly after maximum light. Note that although the centroid of the absorption feature shifts somewhat to the red as it evolves (Fig. 3), this is due to the blue side fading earlier than the red, rather than a shift of the entire feature. The high-velocity absorption remains constrained in velocity space, and in particular, the red edge of the absorption remains constant at about -13,000 km s-1. In all other respects, the observed optical spectral evolution closely resembles that of a normal Type Ia supernova such as SN 1994D (Branch, Romanishin, & Baron, 1996; Branch, 1999). The near-maximum UBVRI colors (Table 1) of SN 2003du are also consistent with the expected colors of a normal SN Ia (Phillips et al., 1999).
To provide further constraint on the color evolution, we convolved the reduced HET spectra with the BVRI filter functions of Bessel (1990) to obtain effective photometry for each of the HET observations. Zero-points for the effective photometry were obtained by convolving the same filter functions with the synthetic spectrum of Vega presented by Castelli & Kurucz (1994). While the absolute fluxing of the HET data is poor, the relative spectrophotometry is accurate and thus the derived colors are meaningful. (Note that for the B-band we performed the convolution over only part of the Bessel bandpass, since the data cut off below 4200 Å. For this reason, the HET colors are somewhat less accurate than the and colors.) The resulting colors are presented in Table 1, along with the real UBVRI colors measured on 07 May 2003. Comparison of the HET derived colors on 06 May and 08 May with the UBVRI measurements suggest that the HET derived colors are probably accurate to about 0.1 mag. When compared to the Riess, Press, & Kirshner (1996) templates, the observed SN 2003du colors lie within the “1-” region for normal SNe Ia.
3 Model Calculations
To examine the effects of interaction with circumstellar material, we begin with a 1-D delayed detonation model for the supernova. The chemical and density structure of the outer regions of the SN ejecta are modified to model the hydrodynamic effect of the circumstellar interaction. The result is then input into a radiation transport code to calculate synthetic non-LTE light curves and spectra (see Appendix).
Previous analyses of the Ca II feature for SN 2000cx and SN 2001el (Kasen et al. 2003; Thomas et al. 2003) are based on 3D parameterized density structures and assuming LTE population numbers, leaving a large number of free parameters. In contrast, we try to minimize the number of free parameters by using more realistic physics but a spherical configuration. Our study presented here is based on detailed explosion models and NLTE light curves and spectra. For example, in our analysis the velocity of the shell is linked directly to the mass of the shell, and non-LTE provides a proper treatment of the ionization balance and detailed atomic models, needed since the level populations and opacities in supernovae are are very different from LTE. In the conclusions, we discuss the limitations of our models and how asphericity will influence the results.
3.1 Delayed-Detonation SN model
Our study is based on the delayed detonation scenario (Khokhlov, 1991) which has been found to reproduce the optical and infrared light curves and spectra of typical SNe Ia reasonably well (e.g. Höflich, 1995a; Höflich & Khokhlov, 1996; Nugent et al., 1997; Fisher et al., 1995; Wheeler et al., 1998; Lentz et al., 2001; Höflich et al., 2002). It also provides a natural explanation for the brightness decline relation (Phillips, 1993; Hamuy et al., 1996a, b) as a consequence of opacity effects in combination with nearly constant explosion energies for SNe Ia (Höflich et al., 1996; Maeda et al, 2003).
Hydrodynamic explosions, light curves, and synthetic spectra are all calculated self-consistently using only physically motivated connections between the different calculations. Given an initial structure for the progenitor and a description of the nuclear burning front, the light curves and spectra are calculated directly from the explosion model without any additional tunable parameters. This methodology forges a strong link between the physical processes being modeled and the predicted observables. As a result, comparing the model results with observations can provide a great deal of insight, at the expense of having to perform rather more difficult calculations.
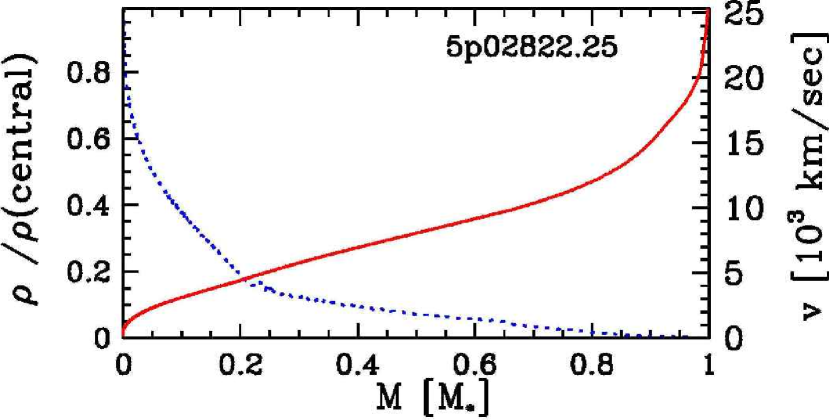
For this study, a single SN model (Fig. 4) was chosen, which roughly matches the observed properties of normal Type Ia supernovae. However, no attempt has been made to fine-tune the SN model to “fit” the observations of SN 2003du. The details of the numerical methods and the resulting SN model used for these calculations are presented in Appendix A.
3.2 Circumstellar Interaction Model
We consider the case of homologously expanding SN envelope running into a stationary circumstellar medium of solar-abundance gas. We model the region of circumstellar interaction in a manner similar to Chevalier (1982) and the density profiles of the interaction region are based on his self-similar solution. The collision of the SN ejecta and environment sets up a forward- and reverse-shock structure, separated by a contact discontinuity at a distance . This produces a high-density region with shocked ejecta and swept up matter, subsequently referred to as the shell, and a low-density precursor region of ambient gas. The inner edge of the shell is given by the location () of the reverse, adiabatic shock. Because the shock front is Rayleigh-Taylor unstable (Chevalier, 1982; Dwarkadas & Chevalier, 1998) we assume that the reverse shocked region consists of a mixture of SN and circumstellar matter. We use a rather generic profile for shell because the details of the structure depend on the exact location, origin and morphology of the environment. Moreover, we apply parameters, which result in a maximum density contrast of four between SN ejecta and the shocked region as expected for adiabatic shocks whereas other conditions, such as nearby interaction (Höflich & Khokhlov 1996) or more sophisticated environments (Dwarkadas & Chevalier, 1998) produce shells with higher contrast. In such models, the strength of the individual features may be enhanced but we do not expect significant changes to our deceleration of the ejecta and the resulting position of the shell (in velocity) as a function of circumstellar mass. These parameters depend on energy and momentum conservation and are thus relatively insensitive to such details.
For the calculation of synthetic spectra, we assume that the circumstellar matter originates close to the supernova and has been overrun by the SN ejecta well before the observations. As a consequence, the structure of the interaction region undergoes free homologous expansion in our model structure, with little or no appreciable emission from the forward shock. Furthermore, at the time of the observations, rapid expansion and radiative cooling will have erased the thermal signature from the shock interaction itself. The temperature structure of the expanding shell is calculated by taking into account radiative processes, gamma-ray heating, and adiabatic cooling. Thus the interaction will not significantly contribute to the luminosity if the interaction takes place early on, i.e. at distances small compared to the SN photosphere at the time of the observation. (As we discuss below, the light-curve of SN 2003du indeed suggests that any strong circumstellar interaction occurred before its discovery around two weeks before maximum light.)
We note that this model makes certain implicit simplifying assumptions, such as spherical symmetry, power law density profiles for the ejecta and the surrounding medium, and pure adiabatic shocks. However, the qualitative results are relatively robust. While deviations away from these assumptions will tend to change the quantitative details of the resulting shell structure somewhat, the models are sufficient for the qualitative and order-of-magnitude quantitative analysis presented here.
3.3 Model Results
3.3.1 General Considerations
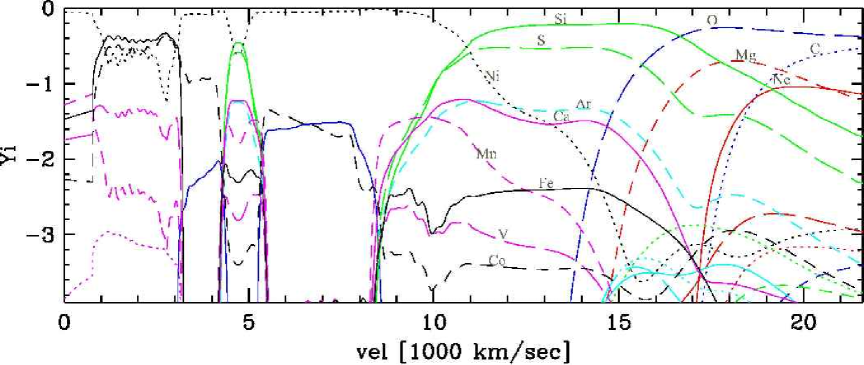
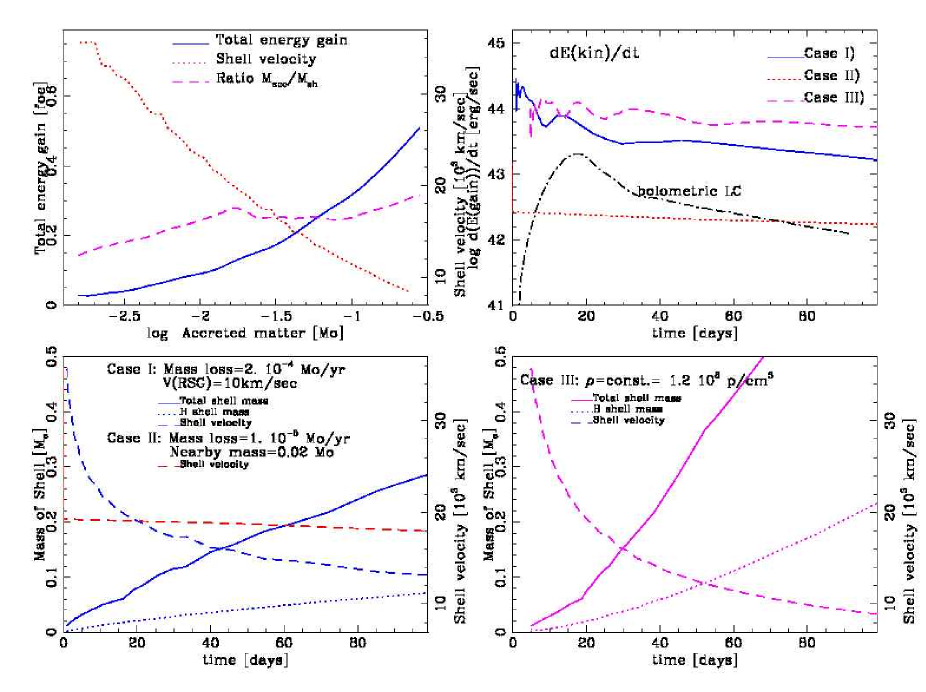
The basic result of the interaction is the accumulation of circumstellar matter (of mass ) in a shell (of mass ). As the highest velocity ejecta runs into the reverse shock, it is decelerated down to the shell velocity . Some of the basic quantities of the shell are shown in Figure 5. Both the shell velocity and the total amount of kinetic energy converted by the interaction depend on . Typically, the shell consists of about 1/3 accumulated solar-abundance circumstellar matter and 2/3 SN ejecta with a composition depending on the shock velocity (compare Figs. 4 & 5).
For a given SN explosion model, the relation between the shell mass and its velocity is fixed. Within the delayed-detonation scenario, the energy generation is nearly independent of changes in the explosion model because for models, the mass and density structure of the SN envelope hardly changes, although the chemistry of the outer envelope is different (Höflich et al., 2002). Conversely, only part of the C/O WD is burned in a pure deflagration scenario, reducing the kinetic energy of the ejecta. As a consequence, we expect lower shell velocities for those models.
As example cases, we consider shells which are produced by running into (case I) a stellar wind with a velocity , (case II) a combination of a nearby mass and a stellar wind, or (case III) a constant density environment. For the first two cases, the mass accumulated in the shell at time can be obtained by scaling the relation for a constant mass loss rate
where , and are the shell velocity, the wind velocity of the progenitor system and the mass loss rate, respectively. For an environment of constant particle density (case III), we have
where and are the mean molecule mass and Avogadro’s number, respectively.
For this discussion, we consider H-rich shells produced by the accumulation of M⊙. The properties of the system are M⊙ yr-1 and km s-1 (case I), M⊙ yr-1 plus an early accumulation of M⊙, (case II), and a constant particle density g cm-3 (case III).
3.3.2 Conversion of Kinetic Energy
A general study of light curves for interactions between the SN shell and the environment is well beyond the scope of this paper. Therefore, we want to present a qualitative discussion which let us to select our setup for the detailed calculation. The arguments are based on energy and momentum conservation and should apply rather generally but, as a consequence, the conclusions are rather qualitative, and should be regarded as a check for consistency rather than than quantitative.
In the upper right of Figure 5, we plot the rate of kinetic energy conversion in the shock. Though some of this energy will go into turbulent motion, and ionization of the gas, we expect significant modification of the X-Ray/UV/optical radiation (Fransson, Lunquist & Chevalier, 1996). To decelerate the highest velocity ejecta to about about 20,000 km s-1 as observed in SN2003du, the energy gain by continuous accretion exceeds those of the underlying SN light curve (powered by radioactive heating via 56Ni and 56Co decay) by an order of magnitude. Thus, we expect significant modification of the light curves for case I and III, and even case II unless the wind component is very small.
For SNe Ia, such as SN 2003du, that exhibit essentially normal light curves, we can therefore rule out that the accumulated matter originates predominantly from mass loss over an extended period of time or from a constant density environment. In our light curve (Fig. 1), we do not see any significant additional energy input 60 days after the explosion (about 40 days after maximum) which, in the context of this analysis, limits to about M⊙ yr-1. We note that this limit is consistent with upper limits for the mass loss in SN 1994D by Cumming et al. (1996) based on the lack of observed emission. However, since we have not calculated detailed self-consistent LCs with ongoing interaction it is not clear exactly how much ongoing interaction could be actually hidden in normal SNe Ia. More detailed analysis may require correction factors for this simple analysis although LCs and spectra of SNe are rather sensitive to a change in the energetics. In any case, it is worth noting that the additional energy will likely dominate the LC at some point in time and decrease its slope. However, late time light curves of typical SNe Ia do not show evidence for any additional energy source even after several years (e. g. Wells et al., 1994; Schmidt et al., 1994).
3.3.3 Light Curve and Spectral Signatures
In light of this constraint, we will consider shells that are formed early on in absence of continuous mass loss (case II with ). Such a shell might originate, for example, from an accretion disk, the Roche-lobe of a companion donor star, or a common envelope of the progenitor system. To construct the density structure of the expanding shell, we assume the ejecta freely expand out to before running into circumstellar matter of constant density with a thickness of . To construct the shell, we assume power law densities for the outer SN ejecta (), with given by the explosion model (close to ; see Fig. 4)
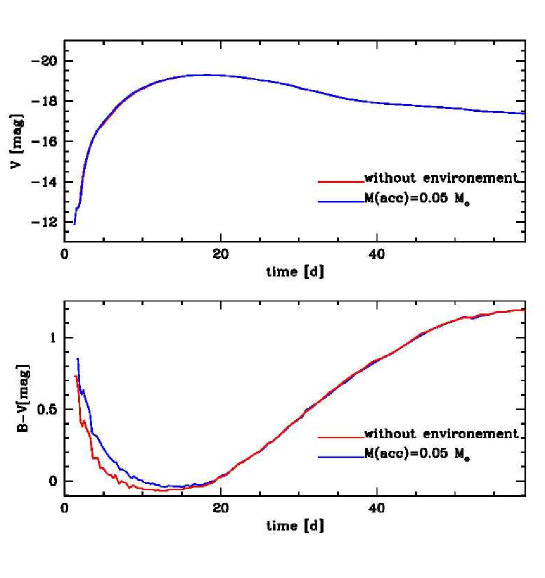
Light curves and detailed spectra have been calculated for a SN Ia without a shell, and for cases with shell masses of and at several epochs. In Figure 6, the evolution of and is given. Overall, even the high mass shell has comparably little effect on the light curves because it hardly influences the diffusion time scales and the lack of energy generation without ongoing interaction (see Figs. 5 & 7). Because the Thomson optical depth of the shell scales with about , it is partially optically thick up to about 10 days after the explosion. As a result, the model photosphere becomes somewhat cooler and redder () but still within the observed variations for normal SNe Ia.
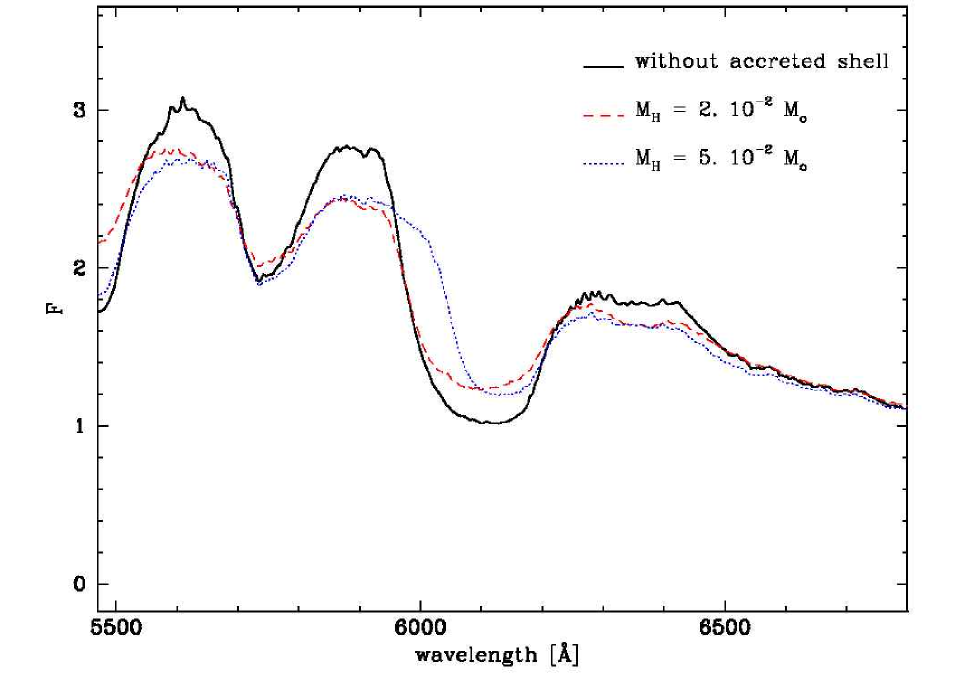
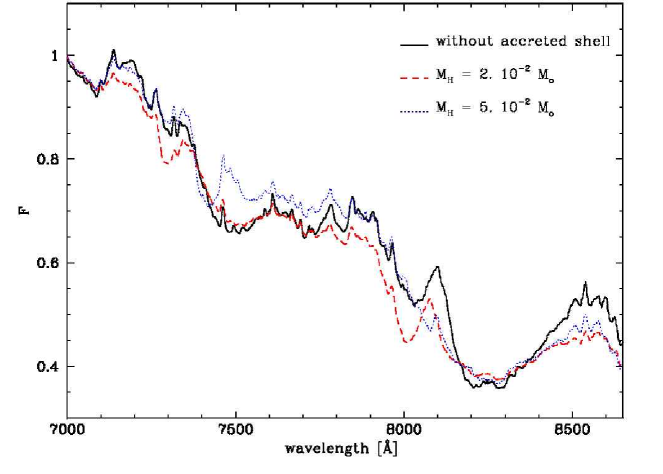
For illustration, optical and near IR spectra are shown in Figure 7 for day 15 (about 3 days before maximum light). We chose to exhibit this epoch of the spectral evolution as an example because the high-velocity Ca II feature is well developed (the photosphere is far inside the shell region). Furthermore, at this epoch, the transient high-velocity feature due to the recombination of Ca III to Ca II is at its most pronounced (Höflich, Wheeler, & Thielemann, 1998). Thus thus epoch represents a “worst-case” for distinguishing between the shell and ionization interpretations of the high-velocity calcium feature. We will discuss this potential complication in detail in § 3.3.4.
Overall, the model spectra with the three different shell masses are remarkably similar, although large electron cross sections and backscattering cause some “smearing out” of the line features in the higher shell mass models. This insensitivity of the overall spectrum to the shell mass is a result of the large distance between the shell and the line forming region. Nearly all of the spectral features are formed in regions well inside the shell, and are therefore largely unaffected by the interaction. There are a few places where O I and Ti II lines form subtly different features in the model spectra. However, these are highly blended with lines of singly and doubly ionized iron-peak elements. Furthermore, these weak features are below the accuracy of our numerical models (primarily due to the depth discretization; see Appendix). Models with an analytic density structure are more suitable for investigation of these features. (See Branch et al. 2003).
In most optical and IR features, the main difference is the cutoff at the blue edge of strong lines due to the deceleration of the high-velocity ejecta by the reverse shock (see Fig. 8). Still, for the most part, the shell has little effect on the spectra beyond quantitative changes at the level of the intrinsic variability in normal SNe Ia. Even shells with about might elude discovery.
However, there are two features that exhibit clear qualitative rather than quantitative changes with increasing shell mass. In the presence of a shell, high-velocity components appear in the Ca II IR triplet at about 8000 Å and in a feature between 7300 and 7500 Å due to a blend of O I/Mg II (Fig. 9). Because these features are qualitatively different in the interaction scenario, they can be used to probe for such an interaction without having to rely on the detailed quantitative accuracy of model spectra.
With a strong high-velocity feature forming in the Ca II IR-triplet, a similar feature may be expected in the Ca II H&K lines. However, in our models the spectral region below 4000 Å, containing the Ca II H&K lines, is highly contaminated with other features. At early times lines of Fe/Co/Ni III populate this spectral region, and beginning about 7 days before maximum light a strong Si II appears at the expected wavelength of a high-velocity component for the Ca II H&K features. In contrast, the Ca II IR triplet lies in a comparatively empty spectral region, making it much better suited as a spectral diagnostic. For further discussion of high-velocity components in the Ca II H&K lines, see Branch et al. 2003.
3.3.4 High-Velocity Ca II IR Triplet Feature
In the models which include a shell from circumstellar interaction, a rather strong high-velocity component appears in the Ca II IR triplet (Fig. 9), with a Doppler shift corresponding to the expansion velocity of the shell (Fig. 5) rather than the photospheric velocity. In combination with explosion models (but actually relatively insensitive to the model details within a delayed-detonation scenario), this provides a good measure for the mass of circumstellar material accumulated in the shell. For example, with , and the high-velocity Ca II Doppler shift corresponds to about 19,000 km s-1 and 14,000 km s-1, respectively. In the model with the higher shell mass the deceleration of the outermost SN ejecta is sufficient to cause a partial merging of the high velocity component with the photospheric line. The resulting feature looks more like a very broad feature rather than two distinct components.
However, Figure 9 also illustrates a complication such an analysis. At the epoch shown in the top panel of Figure 9 (about three days before maximum light), the model without an accreted shell also shows a strong high-velocity component to the IR triplet feature. As we noted in the introduction, observations of some SNe Ia (e.g. SN 1994D) show a short-lived high-velocity component of Ca II IR triplet shortly before maximum light. In SNe Ia where the high-velocity Ca II feature is short-lived, or observed at only a single epoch near maximum light, this feature can also be interpreted as a transient ionization effect as Ca III recombines to Ca II (Höflich, 1995a; Höflich, Wheeler, & Thielemann, 1998; Lentz et al., 2001). During this recombination phase, models for normal SNe Ia show an outer and inner region of Ca II separated by Ca III. The recombination from Ca III to Ca II occurs around maximum light over the course of a couple of days. As a result, a two-component Ca II feature due only to this recombination effect is rather short-lived, and the Doppler shift of the high-velocity absorption component recedes rapidly and merges with the photospheric Ca II feature. Because of the steeply declining density gradient in the ejecta, a high-velocity component formed in this way is rather weak, only about 20% relative to the continuum in our model.
In contrast to this transient ionization effect, the high-velocity component formed by a dense shell evolves much more slowly, and has a Doppler shift that is nearly constant if the mass of the shell is not significantly changing. The time evolution of features due to these two effects are compared in the lower panels of Figure 9. The high-velocity feature in the shell model can be seen as early as 5 days after the explosion, while the feature due to the ionization effect is visible only in the day 15 spectrum. In both cases, the feature disappears around maximum light.
Note that even in a SN with a statically evolving shell, a slight shift in the centroid of the high-velocity absorption is to be expected. Since the shell is also undergoing free homologous expansion, the outer regions of the shell will undergo geometric dilution faster than the inner edge. As a result, the feature fades faster at the blue, high-velocity end than the red end, shifting the feature’s centroid to the red.
3.3.5 High-Velocity O I Feature
The other new feature in the models which include a shell is an absorption between 7300 and 7400 Å due to an O I blend (7775, 7774 & 7772 Å). This feature shows the same Doppler shift and evolution with time as the Ca II feature (i.e. related to the dynamics of the shell and not the photosphere). However, unlike the Ca feature, the oxygen is not primordial but produced during explosion. Burned matter contributes about 2/3 of the shell mass (see Figs. 4 & 5). Solar abundances of oxygen do not provide sufficient optical depth in the shell to cause a strong feature. The appearance of this feature would imply that a significant amount of burnt SN ejecta has piled up in the dense shell.
3.3.6 Hydrogen, Helium, & Carbon
Although 20 % of the shell consists of hydrogen, the model spectra do not exhibit any significant Balmer or Paschen lines, even for of . In the absence of heating by an ongoing interaction between the SN and its environment, the temperature in the shell is low ( 4500 – 5000 K). At these temperatures, excitation of metal lines is strongly favored over hydrogen, due to the much lower excitation energies. (e.g. 10.2 eV for H I vs. 2.22 eV (), 9.0 eV (), 1.57 eV () for the singlet, triplet, and quintet state of calcium and, 1.9 eV for collisional coupling between the singlet and triplet state). The optical depth of the shell is small for rays ( in all cases), keeping the non-thermal excitation of hydrogen low, and thus the hydrogen is mainly neutral. Since most H I atoms are in the ground state, the optical depth of the shell is very small for Balmer and Paschen lines and no absorption features are produced in the models. Furthermore, the models do not predict any significant emission component due to hydrogen. In the presence of heavy elements, strong charge exchange reactions between hydrogen and metals (with a lower ionization potential) are the preferred path for H recombination rather than the radiative process. These same arguments hold even more true for He I. Note that while strong charge exchange reactions are expected to suppress H and He features, they are not really needed because, even without microscopic mixing, detection of the broad, weak H emission features ( 1 to 2 % of continuum in case II) would hardly be possible.
On the other hand, because carbon and oxygen have excitation energies and line cross sections closer to those of Ca, we could expect strong C I features due to transitions at 9405 Å, and 10691 Å (as was observed in the subluminous SN 1999by; Höflich et al. 2002). In normal-bright delayed detonation models, these C I lines do not show up strongly because nearly all of the WD is incinerated, leaving little carbon in the ejecta. However, in alternative scenarios for SNe Ia such as deflagration and merger models, more than 0.1 of the WD remains unburned. For example, in the W7 model (Nomoto, Thielemann, & Yokoi, 1984), about does not undergo nuclear burning and, as a consequence, approximately equal amounts of O and C would be seen in the shell. A clear detection of this high-velocity O I feature in would indicate that the outermost ejecta had been trapped by the circumstellar interaction and piled up in a dense shell. Any significant ammount of unburned carbon in these outer layers would also necessarily result in strong high-velocity features of C I. A lack of high-velocity C I in the presence of high-velocity O I would therefore argue for nearly complete burning of the WD progenitor.
4 Comparison with Observations
What follows is a comparison of the above model predictions with our observations of SN 2003du, to determine whether such an interaction scenario might plausibly reproduce the observed phenomenon. However, we will not attempt to make a detailed comparison between theory of the underlying SN explosion and these observations as has been done, for example, for SN 1994D and SN 1999by; (Höflich, 1995a; Höflich et al., 2002). Such an analysis would involve fine tuning of the supernova model parameters: the initial progenitor, properties of the burning front and the central density of the exploding WD. Instead, we have simply used a delayed-detonation model which roughly reproduces the features of a normal Type Ia SN, without attempting to tune this model to match the specific features of SN 2003du. As an example, in Figure 10, the theoretical spectra have been plotted at about 3 days before maximum light, along with the May 06 data. The continuum slope of the model roughly matches the spectrum and the Doppler shifts of lines generally agree to within about km s-1. (Note that the vertical offset in the red is an artifact due to a poor match of the calibration between the two spectroscopic setups.) Thus our model, although not tuned in any manner, is a decent match for SN 2003du.
Figure 11 shows a blow-up of the comparison of Figure 10, showing the region of the Ca II IR triplet feature. The strength and Doppler shift of the high-velocity component of the Ca II is roughly consistent with . The observed line profile is broader than the model profile, which is an indication that the absorbing material is somewhat less confined than in the model. As seen in the observations, the model predicts that the high-velocity Ca II starts to become weak around maximum light, and disappears a few days later. The higher mass model can clearly be ruled out, as the high-velocity feature in this model is essentially completely blended with the photospheric absorption, and does not appear as a well separated feature at all.
The model without a shell does exhibit a high-velocity component to the Ca II feature, although the total absorption is somewhat weaker than the observations (at least with this SN model). However, this epoch (three days before maximum light) was specifically chosen as a “worst case” for distinguishing our interaction scenario from the short lived ionization effect discussed above. The high-velocity feature in the model without a shell exhibits an entirely different evolution than is seen in SN 2003du. As the SN ejecta expands and cools, the inner and outer regions of the Ca III region begin to recombine to Ca II. Thus the observed high-velocity feature would shift rapidly to the red, merging with the photospheric line, and fading over the course of 2 – 3 days.
In contrast, the observed evolution of the high-velocity feature more closely resembles the expected evolution for a shell that is fixed in velocity space. The line centroid shifts slightly to the red as the feature ages, but the absorption never moves beyond its upper or lower boundaries. In the shell model, the slight shift of the minimum in the high-velocity component occurs because the inner layers of the shell contribute more to the opacity as it expands homologously, and also because the absorption depression is formed on the steep blue edge of the main component of Ca II, which gains considerable strength during the observations. Note that the observed red edge of the high-velocity feature, corresponding to the inner edge of the shell, remains constant. This is consistent with the notion that the kinematics of the shell are unchanged, and only the relative density of the inner and outer regions of this finite thickness shell are evolving.
Such kinematic stability suggest a shell in free expansion, which implies that most of the circumstellar matter must have been accumulated prior to the first spectroscopic observations. This, in turn, imposes an upper limit for the distance between the circumstellar material and the WD progenitor of cm. Such a distance constrains the origin of the material, which might originate from an accretion disk around the white dwarf, mass filling the Roche lobe of the donor star, a common envelope in which the WD is embedded, or perhaps a period of very high mass loss immediately prior to the explosion. The last is rather unlikely, as the period of mass loss must be shorter than 50 years prior to the explosion, even if we assume a wind of 10 km s-1 which is at the low end for red supergiant winds. Moreover, the interaction with such a wind would convert bulk flow kinetic energy at a rate of erg s-1 (Fig. 5), a significant fraction of which should be visible as additional luminosity, but we see no evidence for any significant excess in the observed light curve.
A further constraint on the source of the circumstellar material can be inferred from the early light curve. SN 2003du was discovered on April 22, about 3 days after the explosion in the timeline of our SN model. At this epoch, SN 2003du was about below its maximum light brightness, which is typical for normal SNe Ia (e.g. Phillips et al. 1999). A strong interaction with the surrounding CSM at such an epoch would likely dramatically alter the observed light curve as some fraction of the kinetic energy of the ejecta is converted into light. Since the light curve of SN 2003du does not appear to have been highly unusual, we can infer that the bulk of any extended interaction occurred prior to the supernova’s discovery. This leads to an estimate for . Furthermore, since the kinetic energy conversion is proportional to the mass accumulation rate in the shell, to produce the same shell by interaction with a stellar wind would either result in very unrealistic luminosities early on, or the deposited energy has to go into expansion work rather than luminosity.
Indeed, the lack of any observed interaction in the light curve argues that the bulk of the interaction likely occurred close to the progenitor system, so that adiabatic expansion of the freely expanding shell dissipated most of the shock energy. These constraints tend to argue that the circumstellar material is most likely directly related to the progenitor system as in the accretion disk or Roche lobe scenarios, rather than an effect of the random environment around the progenitor at the time of the explosion.
Note that for small , a shell may not stay as confined as assumed in our models since there will have been more time for internal dynamics to “smear-out” the sharp edges of the shell. Such an effect would tend to broaden the shell features, and produce an absorption more akin to the high-velocity Ca feature observed in SN 2003du. If the shell were significantly non-spherical (as in the case of an accretion disk, for example) the kinematics would also likely be significantly affected.
On the other hand, because of the observed confinement of Ca II in velocity space, the matter cannot be attributed to the outer layers of the WD itself. Redistribution of energy during the hydrodynamical phase would produce a smooth velocity profile very similar to the freely expanding ejecta (Fig. 4). Since no dense shell would be formed in the outer layers, any material from the surface of the WD would have a very low optical depth and the observed spectrum would look essentially identical to a normal SN Ia.
5 Final Discussion
Summary:
We have presented a series of optical spectra and broad band photometry of SN 2003du
showing that its spectral evolution and light curve resemble that of a normal bright SNe Ia, except
for a high-velocity component to the Ca II IR triplet near 8000Å. This high-velocity
component exhibits an expansion velocity of about 18,000 km s-1, significantly larger than the
photospheric velocity implied from the other spectral features. We propose that this high-velocity Ca feature may be the spectroscopic signature
of a shell formed by the interaction of the supernova ejecta with the circumstellar environment.
Based on model calculations for the explosion, light curves and spectra, the observable effects of such a shell have been examined. The model shell is formed by interaction between SN ejecta and circumstellar material of solar abundance, with the assumption that the circumstellar material has been overtaken by the expanding envelope prior to the time of our observations, with little or no significant ongoing interaction. We find that the high-velocity component of the Ca II IR triplet can indeed be understood as being caused by solar abundance material piled up in a dense shell behind the shock. This material is likely mixed via Rayleigh-Taylor instabilities with the reverse-shocked outer layers of the SN ejecta. Overall, the SN light curves are little effected except at very early times when the shell is partially optically thick due to Thomson scattering resulting in larger colors by up to . Similarly, we find that the optical and IR spectra are otherwize little effected by a shell with an accumulated mass of up to a few hundredths of a solar mass. In particular, hydrogen and helium lines are strongly suppressed due to the low temperatures in the shells and charge exchange with heavy elements being the preferred method of hydrogen recombination.
The main signatures of the shell in our model spectra are the high-velocity component of the Ca II IR triplet, and a weaker O I line near 7300 to 7400 Å. Although similar in nature, these features probe different effects. The Doppler shift of the high-velocity component of Ca II is a sensitive measure of the amount of accumulated matter in the circumstellar shock, whereas the Doppler shift of the O I can be used as a test for mixing of shell and envelope material. Unlike the Ca II feature, the O I feature is only formed with oxygen abundances which exceed the solar value by about 2 orders of magnitude.
Related to the interaction process and the deceleration of high-velocity ejecta is the conversion of kinetic energy. Assuming reasonable factors of efficiency for the conversion to photons, the lack of evidence for any additional associated luminosity strongly argues in favor of a very low density environment for SN 2003du (outside of the immediate vicinity of the progenitor system) and provides additional constraints for the origin of any circumstellar material.
For SN 2003du, we find that the observations can be understood as a result of a shell formed by the accumulation of about of solar composition material. The early light curve data strongly suggest that the matter originates from close to or within the progenitor system, as an accretion disk, the Roche lobe of the companion, or a common envelope. An episode of strong mass loss would require unrealistically short durations, very high mass loss rates and probably very high luminosities early on.
Relation to Observations of Other SNe Ia:
Our models indicate that moderate mass shells of around show no significant signatures in the
optical and NIR
except the high-velocity Ca II feature near 8000 Å and the O I feature at about
7300 Å. In the past, both could easily elude detection because observations often did not extend
far enough to the red, and even when they did, the increasing noise longwards of 7000 Å and
contamination by atmospheric absorption bands confuse the issue.
SN 2003du may not, in fact, be all that unusual an event. Other SNe Ia (SN 2002cx, SN 2001el)
have shown similar Ca II features, and a systematic search for this phenomenon in
SNe Ia may provide significant constraints on the environment and progenitor systems of these
objects.
In light of these results, the interpretation of the high-velocity Ca II IR feature seen in SN 2001el and SN 2000cx should be revisited. Our results here suggest that calcium enrichment may not be required to reproduce the effect seen in SN 2001el. The stronger Ca II feature and the observed polarization provide somewhat stronger constraints, however, and will require a more detailed calculation which is beyond the scope of this work. We note, however, that the circumstellar phenomena we suggest here for SN2003du are unlike those for SN 2003ci which require a large H mass at large distances (– cm; Wang et al. 2003b)
Limitations and Future Work:
The analysis presented here, while suggestive, does not provide a definitive conclusion as to the nature of
the high-velocity Ca absorption, as alternative explanations may still be viable.
In particular, we have not ruled out that the
Ca feature is produced by processed Ca-rich material originating from burning under very special
conditions in a disk
or as a consequence of nuclear burning in the WD which causes ejection of a
high-velocity, Ca-rich filament.
Rather we have shown that interaction with solar
abundance circumstellar material is a plausible explanation for this phenomenon.
In examining the implications for such an interpretation, we have developed observational tools which could be used to probe the circumstellar environment. However, these tools still need significant refinement. Our study has only covered a small parameter space and, for the most part, has been limited to the case without ongoing interaction. For the formation of the shell, we assumed adiabatic shocks. Depending on the origin of the accreted matter, some of the shell material may be accumulated before the phase of homologous expansion has been established for the SN ejecta, and the shell structure might therefore be modified. The larger width of the high-velocity Ca II component of SN 2003du (compared to the models) may already be an indication of such an effect.
Also, we have not accounted for the likely 3-D nature of either the SN ejecta or the circumstellar material. Indeed, the polarization measurements for SN 2002el (Wang et al., 2003a) indicate that the Ca II (and thus, in this interpretation, the shell) is not spherical but may be toroidal, or a large scale clump with a significant scale height which selectively blocks light from the underlying photosphere and causes polarization (Höflich, 1995a; Höflich et al., 2002; Kasen et al., 2003). Moreover, the polarization confirms that the high-velocity Ca II in SN 2001el is related to a region morphologically separated from the overall SN ejecta. The 3-D nature of the absorbing gas will also affect the implied mass of circumstellar material. The high-velocity component of the IR Ca II measures a column depth along the line of sight and the the masses quoted here assume spherical symmetry. Thus the actual mass may be lower by a factor of a few depending on the covering factor of the absorbing material. Finally, asymmetry may also change the early light curve because the luminosity becomes directionally dependent (Höflich 1991), with higher or lower luminosity depending on whether we observe the shell from the top or ’equator on’ (the latter showing the strong high-velocity Ca II feature). Within our configuration, the latter would produce a decrease in the V luminosity and even redder color at early times. To address these questions, detailed 3D calculations for the interaction of ejecta and environment should be performed similar to those for the interaction of the donor star by Marietta, Burrows, & Fryxell (2000)
Appendix A Details of the SN Model
A.1 Numerical Methods
Our calculations take into account detailed hydrodynamics, nuclear networks, radiation transport for low and high energy photons, opacities and include solvers to calculate the atomic level populations in full (albeit simplified) NLTE for both light curves and synthetic spectra utilizing accelerated Lambda Iteration and level merging as commonly used in stellar atmospheres (also known as superlevels, e.g. Hillier, 2003; Hubeny & Lanz, 2003; Werner et al., 2003). These computational tools have been used to carry out several previous analyses of SN Ia (e.g. Höflich, 1995a; Höflich et al., 2002). For more details, see Höflich (2003a, b), and references therein.
Spectra are computed using the chemical, density, and luminosity structure as well as the -ray deposition resulting from the light curve code. For the detailed atomic models, typically between 27 and 137 bound levels are taken into account for the main ionization stages. For each of these detailed atomic models, neighboring ionization stages have been approximated by simplified atomic models restricted to just LTE levels with a few NLTE levels. The energy levels and cross sections for bound-bound transitions are taken from Kurucz (1993) starting at the ground state. Here, we use H I(14/31/91), He I(15/28/46), C I (27/123/242), C II(23/31/57), O I (43/129/431), O II(28/43/75), Mg II (20/60/153), Si II (35/212/506), Ca II (41/195/742), Ti II (62/75/592), Fe II (137/3120/7293), Co II (84/1355/5396), and Ni II (71/865/3064), where the first, second and third numbers in brackets denote the number of levels, the number of bound-bound transitions, and the number of discrete lines used for the radiation transport. The third number is larger than the second because nearby levels within multiplets have been merged for the rates. In addition, 404508 LTE-lines are taken into account using an equivalent-two level approach.
For calculating detailed spectra, the explosion models have been remapped from 912 to about 200 radial grid points for the atmospheres with the zones concentrated in the line forming region. frequency points have been used, oversampling the synthetic spectra. In an expanding atmosphere, the frequency and velocity space are coupled and thus the effective spectral resolution of the synthetic spectra is about 1000. The noise in the spectra (see Fig. 8) below this effective resolution is a direct result of the oversampling in the frequency space and can be used as an estimate for the internal numerical accuracy.
A.2 SN Model Results
The structure of the initial model of the C/O white dwarf is based on a star with 5 solar masses at the main sequence and solar metallicity which, at the end of its evolution, has lost all of its H and He-rich layers. By accretion, its core has grown close to the Chandrasekhar limit. At the time of the explosion of the WD, the central density is 2.0 g cm-3 and its mass is close to 1.37. The deflagration-detonation transition density is g cm-3. During the explosion, about 0.6 of radioactive are produced. The density and chemical structure are shown in Figure 4. The maximum brightness in V, the color near maximum, the rise time to maximum light, and decline ratio in V over 15 days are , , 18.6 days, and , respectively; typical for normal SNe Ia. Further details for this reference model, including the progenitor evolution, explosion, and light curves can be found in Dominguez, Höflich & Straniero (2001) and Höflich et al. (2002), where it is named 5p0z22.25.
References
- Akerlof et al. (2003) Akerlof, C. W., et al. 2003, PASP, 115, 132
- Benz et al. (1990) Benz, W. Cameron, A. G. W., Press, W. H. & Bowers, R. L. 1990, ApJ, 348, 647
- Bessel (1990) Bessel, M. S. 1990, PASP, 102, 1181
- Boffi & Branch (1995) Boffi, F., Branch, D. 1995, PASP, 107, 347
- Branch et al. (1995) Branch, D., Livio, M., Yungelson, L. R., Boffi, F. R., Baron, E. 1995, PASP, 107, 1019
- Branch, Romanishin, & Baron (1996) Branch, D., Romanishin, W., Baron, E. 1996, ApJ, 465, 73
- Branch (1999) Branch, D. 1999, ARA&A, 36, 17
- Branch (2003) Branch, D. et al. 2003, SYNOW paper, in preparation
- Castelli & Kurucz (1994) Castelli, F., & Kurucz, R. L. 1994, A&A, 281, 817
- Cumming et al. (1996) Cumming, R., Lundqvist, P., Smith, L., Pettini, M., King, D. L. 1996, MNRAS, 283, 1355
- Dominguez, Höflich & Straniero (2001) Dominguez, I., Höflich, P., Straniero, O. 2001, ApJ, 557, 279
- Chevalier (1982) Chevalier, R. 1982, ApJ, 259, 302
- Chevalier (1984) Chevalier, R. 1984, ApJ, 285, L63
- Chugai (1986) Chugai, N. N. 1986, SvA, 30, 563
- Dwarkadas & Chevalier (1998) Dwarkadas, V. V., Chevalier, R. A. 1998, ApJ, 497, 807
- Fisher et al. (1995) Fisher, A., Branch, D., Höflich, P., Khokhlov, A. 1995, ApJ 447, 73
- Fisher et al. (2000) Fisher, A. 2000, PhD Thesis, University of Oklahoma, Aug. 2000
- Fransson, Lunquist & Chevalier (1996) Fransson, C., Lundqvist, P., Chevalier, R. A. 1996, ApJ, 461, 993
- Greiner, Hasinger & Kahabka (1991) Greiner, J., Hasinger, G., Kahabka, P. 1991, A&A, 246, 17
- Hamuy et al. (1996a) Hamuy, M., Phillips, M. M, Schommer, R. A. Suntzeff, N. B, Maza, J., Aviles, A. 1996a, AJ, 112, 2391
- Hamuy et al. (1996b) Hamuy, M., Phillips, M. M., Suntzeff, N. B., Schommer, R. A., Maza, J., Aviles, A. 1996b, AJ, 112, 2398
- Hamuy et al. (2003) Hamuy, M., et al. 2003, Nature, in press
- Hatano et al. (1999) Hatano, K, Branch, D., Fisher, A., Baron, E., & Filippenko, A. V. 1999, ApJ, 525, 881
- Hatano et al. (2000) Hatano, K., Branch, D., Lentz, E. J., Baron, E., Filippenko, A. V., Garnavich, P. 2000, ApJ, 543, L94
- Hill et al. (1998) Hill, G.J., Nicklas, H.E., MacQueen, P.J., Tejada, C., Cobos Duenas, F.J., and Mitsch, W. 1998, Proc. SPIE, 3355, 375
- Hillier (2003) Hillier D.J. 2003, in: Stellar Atmosphere Modelling, ASP Conference Proceedings 288, eds. I. Hubeney, D. Mihalas & K. Werner, p. 199
- Hillebrandt & Niemeyer (2000) Hillebrandt, W., Niemeyer, J. 2000, ARA&A, 38, 191
- Höflich (1995a) Höflich, P. 1995a, ApJ, 443, 89
- Höflich (1995b) Höflich, P. 1995b, ApJ, 440, 821
- Höflich & Khokhlov (1996) Höflich, P., Khokhlov, A. 1996, ApJ, 457, 500
- Höflich et al. (1996) Höflich, P., Khokhlov, A., Wheeler, J. C., Phillips, M. M., Suntzeff, N. B., & Hamuy, M. 1996, ApJ, 472, L81
- Höflich, Wheeler, & Thielemann (1998) Höflich, P., Wheeler, J. C., & Thielemann, F. K. 1998, ApJ, 495, 617
- Höflich et al. (2000) Höflich, P., Nomoto, K., Umeda, H., Wheeler, J.C. 2000, ApJ, 528, 590
- Höflich et al. (2002) Höflich, P., Gerardy, C., Fesen, R., & Sakai, S. 2002, ApJ, 568, 791
- Höflich et al. (2003) Höflich, P., Gerardy, C., Linder, E., & Marion, H. 2003, in: Stellar Candles, eds. Gieren et al., Lecture Notes in Physics, Springer Press, in press & astro-ph/0301334
- Höflich (2003a) Höflich, P. 2003a, in: Stellar Atmosphere Modelling, ASP Conference Proceedings 288, eds. I. Hubeney, D. Mihalas & K. Werner, p. 185
- Höflich (2003b) Höflich, P. 2003b, in: Stellar Atmosphere Modelling, ASP Conference Proceedings 288, eds. I. Hubeney, D. Mihalas & K. Werner, p. 371
- Hubeny & Lanz (2003) Hubeny, I., Lanz, T. 2003, in: Stellar Atmosphere Modelling, ASP Conference Proceedings 288, eds. I. Hubeney, D. Mihalas & K. Werner, p. 51
- Howell et al. (2001) Howell, A., Höflich, P., Wang, L., Wheeler, J. C. 2001, ApJ, 556, 302
- Hoyle & Fower (1960) Hoyle, P., & Fowler, W. A. 1960, ApJ, 132, 565
- Iben & Tutukov (1984) Iben, I. J, Tutukov, A. V. 1984, ApJS, 54, 335
- Kahabka & van den Heuvel (1997) Kahabka, P., van den Heuvel, E. P. J. 1997 ARA&A, 35, 69
- Kasen et al. (2003) Kasen, D., Nugent, P., Wang, L., Howell, A., Wheeler, J. C., Höflich, P., Baade, D., Baron, E., Hauschildt, P. 2003, ApJ, in press & astro-ph/0301312
- Khokhlov (1991) Khokhlov, A. 1991, ApJ, 245 114
- Khokhlov, Müller, & Höflich (1993) Khokhlov, A., Müller, E., & Höflich, P. 1993, A&A, 270, 233
- Kotak & Meikle (2003) Kotak, R. & Meikle, W. P. S. 2003, IAU Circ. 8122
- Krisciunas et al. (2003) Krisciunas K., et al. 2003, AJ, 125, 166
- Kurucz (1993) Kurucz, R. L. 1993, Atomic Data for Opacity Calculations, Cambridge/Center for Astrophysics, CD 1
- Langer et al. (2000) Langer, N., Deutschmann, A., Wellstein,S., & Höflich, P. 2000, A&A 362, 1046
- Lentz et al. (2001) Lentz, E. J., Baron, E., Branch, D., Hauschildt, P., Nugent, P. E. 2001, ApJ, 530, 966L
- Li et al. (2001) Li, W., Filippenko, A. V., Gates, E., Chornock, R., Gal-Yam, A., Ofek, E. O., Leonard, D. C., Modjaz, M., Rich, R. M., Riess, A. G., & Treffers, R. R. 2001, PASP, 113, 1178
- Livio & Riess (2003) Livio, M., & Riess, A. 2003, ApJ, 594, L93
- Livne, Tuchman, & Wheeler (1992) Livne, E., Tuchman, Y., Wheeler, J. C. 1992, ApJ, 399, 665
- Maeda et al (2003) Maeda, K., Mazzali, P., Deng, J., Nomoto, K., Yoshhi, Y., Tomika, H., Kobayashi, Y. 2003, ApJ, 593, 22
- Marietta, Burrows, & Fryxell (2000) Marietta, E., Burrows, A., Fryxell, B. 2000, ApJS, 128, 615
- Massey et al. (1988) Massey, P., Strobel, K., Barnes, J. V., & Anderson, E. 1988, ApJ, 328, 315
- Massey & Gronwall (1990) Massey, P., & Gronwall, C. 1990, ApJ, 358, 344
- Maxted, March & North (2000) Maxted, P. F. L., Marsh, T. R., North, R. C. 2000, MNRAS, 317, 41
- Nomoto (1982) Nomoto, K. 1982 ApJ, 253, 798
- Nomoto, Thielemann, & Yokoi (1984) Nomoto, K., Thielemann, F. -K., & Yokoi, K. 1984, ApJ, 286, 644
- Nomoto et al. (2000) Nomoto, K., Umeda, H., Hachisu, I., Kato, M., Kobayashi, C., & Tsujimoto, T., 2000, in Type Ia Supernovae: Theory and Cosmology, ed. J. Truran, J. Niemeyer (Cambridge: Cambridge University Press), 63
- Nomoto et al. (2003) Nomoto, K., Uenishi, T., Kobayashi, C., Umeda, H., Ohkubo, T., Hachisu, I., & Kato, M. 2003, in From Twilight to Highlight: The Physics of Supernovae, eds. W. Hillebrandt & B. Leibundgut, ESO Astrophysics Symposia (Berlin: Springer), 115 (astro-ph/0308138)
- Nugent et al. (1997) Nugent, P., Baron, E., Branch, D., Fisher, A. Hauschildt, P. 1997 ApJ, 485, 812
- Oke (1990) Oke, J. B. 1990, AJ, 99, 1621
- Paczyński (1985) Paczyński, B. 1985, in Cataclysmic Variables and Low-Mass X-Ray Binaries, eds. D.Q. Lamb & J. Patterson, (Dordrecht: Reidel) p. 1
- Patat et al. (1996) Patat, F., Benetti, S., Cappellaro, E., Danziger, I. J., Della Valle, M., Mazzali, P. A., & Turatto, M. 1996, MNRAS, 278, 111
- Perlmutter et al. (1997) Perlmutter C. et al. 1997, ApJ, 483, 565
- Phillips (1993) Phillips, M.M., 1993, ApJ, 413, 105
- Phillips et al. (1999) Phillips, M. M., Lira, P., Suntzeff, N. B., Schommer, R. A., Hamuy, M., & Maza, J. 1999, AJ, 118, 1766
- Piersanti et al. (2000) Piersanti, L., Cassisi, S., Iben, I. Jr., Tornambé, A. 2000, ApJ, 535, 932
- Rappaport et al. (1994) Rappaport, S., Chiang, E., Kallman, T., Malina, R. 1994 , ApJ, 431, 237
- Rappaport, Di Stephano & Smith (1994) Rappaport, S. Di Stefano, R., Smith J. 1994 ApJ, 426, 692
- Ramsey et al. (1998) Ramsey, L. W., et al. 1998, Proc. SPIE, 3352, 34
- Riess, Press, & Kirshner (1996) Reiss, A. G., Press, W. H., & Kirshner, R. P. 1996, ApJ, 473. 588
- Schlegel (1995) Schlegel, E. M. 1995, Rep.Prog.Phys. 58, 1375
- Schlegel & Petre (1993) Schlegel, E. M., Petre, R. 1993, ApJ, 418, L53
- Schmidt et al. (1994) Schmidt, B., Kirshner, R. P., Leibundgut, B., Wells, L. A., Porter, A. C., Ruiz-Lapuente, P., Challis, P., & Filippenko, A. V. 1994, ApJ, 434, 19
- Schwartz & Holvorcem (2003) Schwartz, M. & Holvorcem, P. R. 2003, IAU Circ. 8121
- Thomas et al. (2003) Thomas R.C., Branch D., Baron E., Nomoto K., Weidong L., 2003, ApJ, submitted & astro-ph/0302260 IAU Circ. 8121
- Van den Heuvel et al (1992) Van den Heuvel, E. P. J., Bhattacharya, D., Nomoto, K., & Rappaport, S. 1992, A&A, 262, 97
- Wang, Wheeler, & Höflich (1997) Wang, L., Wheeler, J. C., Höflich, P. 1997, ApJ, 476, 27
- Wang et al. (2003a) Wang, L., Baade, D., Höflich, P., Khokhlov, A, Wheeler, J. C., Kasen, D., Nugent P., Perlmutter S., Fransson C., Lundqvist P. 2003, ApJ 591, 1110
- Wang et al. (2003b) Wang, L., Baade, D., Höflich, P., Wheeler, J. C., Kawabata, K., Nomoto, K. 2003, ApJ, submitted
- Webbink (1984) Webbink, R. F. 1984, ApJ, 277, 355
- Wells et al. (1994) Wells, L. A. et al. 1994, AJ, 108, 2233
- Werner et al. (2003) Werner K., Hubeny, I., Lanz, T. 2003, in: Stellar Atmosphere Modelling, ASP Conference Proceedings 288, eds. I. Hubeney, D. Mihalas & K. Werner, p. 31
- Wheeler (1991) Wheeler, J. C., in: Frontiers of Stellar Evolution, ed. D. L. Lambert (San Francisco: Astronomical Society of the Pacific), 483
- Wheeler et al. (1998) Wheeler, J. C., Höflich, P., Harkness, R. P., Spyromilio J. 1998, ApJ, 496, 908
- Whelan & Iben (1973) Whelan, J., & Iben, I. Jr. 1973, ApJ, 186, 1007
- Woosley & Weaver (1994) Woosley, S. E., & Weaver, T. A. 1994, ApJ, 423, 371
- Yamaoka et al. (1992) Yamaoka, H., Nomoto, K., Shigeyama, T., & Thielemann, F. 1992, ApJ, 393, 55
| Date | () | ()aaFor HET data, B-band is cut off at 4200 Å. | () | () | Telescope |
|---|---|---|---|---|---|
| 01 May | HET | ||||
| 02 May | HET | ||||
| 06 May | HET | ||||
| 07 May | 0.8 m | ||||
| 08 May | HET | ||||
| 12 May | HET | ||||
| 30 May | HET |