A 3D Optical Spectroscopy Study of Low Surface Brightness Galaxies
Abstract
We present H emission line velocity fields of two Low Surface Brightness galaxies (LSBs) - UGC 628 and UGC 5005 - obtained using Fabry-Perot (FP) interferometry observations at the Canada-France-Hawaii telescope. Our goal is to study the dynamics of LSBs.
1 Dept. de Physique, Université de Montréal, C.P. 6128, Succ. Centre-ville, Montréal, Qc, Canada, H3C 3J7
2 GEPI, Observatoire de Paris, 5 Pl. J. Janssen, 92195 Meudon, France
3 Observatoire Astronomique de Marseille-Provence, 2 Pl. Le Verrier, 13248 Marseille, France
1. Introduction
Low Surface Brightness galaxies are ideal laboratories to study the dark matter (DM) properties and it is still debated whether their dark haloes are cuspy or core-dominated (de Blok et al. 2001, Marchesini et al. 2002, Swaters et al. 2003).
FP interferometry is a powerful tool for studying the DM properties of LSBs for two major reasons:
the accurate determination of the DM distribution in galaxies
requires high angular resolution observations (see eg. Blais-Ouellette et al. 1999),
3D spectroscopy like FP provides more accurate kinematical parameters and rotation curves than long-slit observations
as it samples the whole velocity field of a galaxy.
Using a new generation of detectors with unprecedented sensitivity (Gach et al. 2002), we began a campaign of FP observations of LSBs in order to study the kinematics of the ionized gas and their dynamics (Chemin et al. in prep).
2. Observations, results and discussion
The H emission line in UGC 628 and UGC 5005 was observed on October 2002 and April 2003 (resp.) at the Canada-France-Hawaii telescope, using FaNTOmM111http://www.astro.umontreal.ca/fantomm, a scanning FP interferometer coupled with a photon counting camera. The angular resolution is 0.49” and the spectral sampling is 7 km/s for UGC 5005 and 16 km/s for UGC 628. Exposure times are of the order of 3h per galaxy.
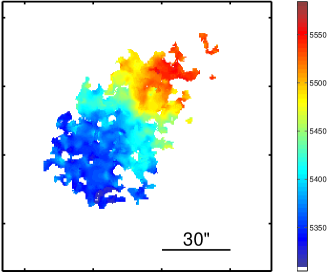
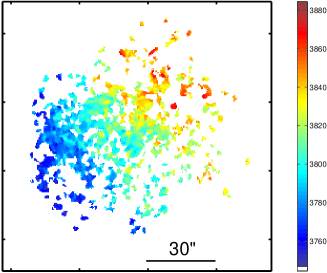
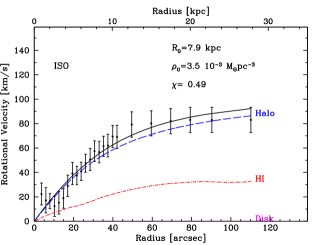
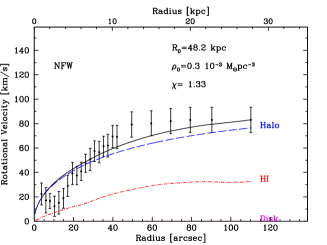
Figures 1 and 2 present some provisional results. Figure 1 shows the velocity fields of UGC 628 and UGC 5005. Figure 2 shows the mass models (Blais-Ouellette et al. 2001) for UGC 5005 with the pseudo-isothermal (ISO) sphere (left) and the NFW (right) DM halo profiles.
A dozen objects were observed as of date. The high angular resolution FP observations will allow a detailed study of LSBs velocity fields and rotation curves and their DM content. We will also study the effects of non-circular motions on their mass distribution (Chemin et al. in prep).
References
Blais-Ouellette, S., et al. 1999, AJ, 118, 2123
Blais-Ouellette, S., Amram, P., & Carignan, C. 2001, AJ, 121, 1952
de Blok, W. J. G., McGaugh, S. S., & Rubin, V. C. 2001, AJ, 122, 2396
Gach, J.-L., et al. 2002, PASP, 114, 1043
Marchesini, D., et al. 2002, ApJ, 575, 801
Swaters., R. A., et al. 2003, ApJ, 583, 732
van der Hulst, J. M., et al. 1993, AJ, 106, 548