Detection of reactive ions in the ultracompact Hii regions Mon R2 and G29.96-0.02
Abstract
We report the first detection of the reactive ions CO+ and HOC+ towards ultracompact (UC) Hii regions, particularly in Mon R2 and G29.96-0.02. We have observed two positions in Mon R2, namely the peak of the UC Hii region and the surrounding high density molecular cloud. CO+ and HOC+ were detected at the UC Hii region but not at the molecular cloud, as expected if both ions arise in the PDR surrounding the UC Hii region. The measured column densities are of the order of 1011 cm-2 in both sources, which yields a strikingly low [HCO+]/[HOC+] abundance ratio of 460 in Mon R2. These values are similar to those found in some other well-known PDRs, like NGC 7023 and the Orion Bar. We briefly discuss the chemical implications of these results.
1 Introduction
The chemistry of PDRs is nowadays the subject of an important amount of observational and theoretical works. The reactive ions are among the best tracers of PDRs, because their abundances are expected to be negligible in the shielded parts of molecular clouds. Actually, these compounds react on virtually every collision with H2 and only in the hot layers of PDRs, where a significant fraction of hydrogen is still in atomic form, does the abundance of these ions become significant (Sternberg & Dalgarno 1995). Recently, our group has carried out a survey of reactive ions (CO+, HOC+, SO+) towards the prototypical PDR regions NGC 7023, the Orion Bar and the planetary nebula NGC 7027 (Fuente et al. 2003). Our results confirm that the abundance of reactive ions is strongly enhanced in PDRs, although strong differences may exist among PDRs depending on their physical and chemical conditions.
So far, all the observational knowledge about reactive ions in PDRs are based on a few sources. Very little is known about the chemistry of the PDRs associated to ultracompact (UC) Hii regions. The high densities ( 106 cm-3) and kinetic temperatures ( 100 K) of these regions, together with the ionizing radiation (G in units of Habing field), could drive a chemistry presumably different from that found in other PDRs. In this paper we present the detection of CO+ and HOC+ towards the UC Hii regions Mon R2 and G29.96-0.02. These are the first detections of CO+ and HOC+ in this kind of regions and prove the feasibility of chemical studies of the PDRs associated with UC Hii regions, even at large distances, as in the case of G29.96-0.02 (6 or 9 kpc, Pratap et al. 1999).
2 Observations
We have carried out a survey of the reactive ions CO+ and HOC+ towards the PDRs associated to the UC Hii regions Mon R2 and G29.96-0.02. Besides CO+ and HOC+, we have also observed some rotational transitions of SiO, H13CO+ and HC18O+. The observations were carried out using the IRAM 30m radio telescope in Pico de Veleta (Spain) during July 2002. The observed transitions, their frequencies and the telescope parameters are shown in Table 1.
3 Mon R2
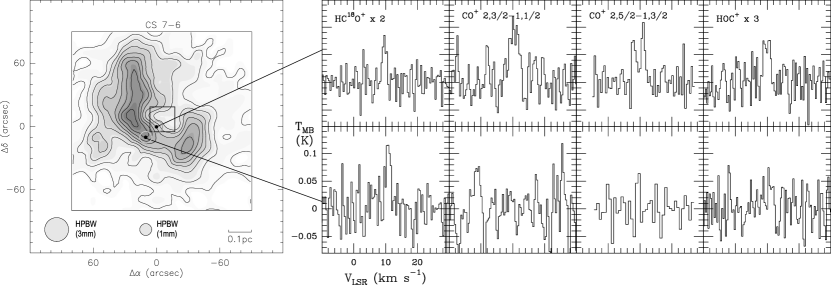
Mon R2, located at a distance of 950 pc, is the closest UC Hii region and has an angular diameter of 22′′ (0.1 pc). It is comparable to the beam of the 30m radio telescope at 3mm, which allows us to spatially separate the UC Hii region and the surrounding molecular cloud. The situation is clearly illustrated in Fig. 1. In the left panel, the CS 76 emission map from Choi et al. (2000) is shown. The central square roughly indicates the angular extension of the UC Hii region at 6cm-continuum (Wood & Churchwell 1989). The beamsize both at 3mm and 1mm are also sketched. The CS emission shows an arc-like structure surrounding the Hii region, with the maximum of emission to the southeast. The UC Hii region is highly asymmetric and has a cometary shape, reaching its maximum toward its exciting star Mon R2 IRS1, which is also the origin of angular offsets. We have performed the observations towards this maximum of the ionized gas, at (0″, 0″), and toward the peak of CS emission, at (10″, -10″). Some of the observed spectra at both positions are shown in the right panel of Fig. 1. While the HC18O+ emission is more intense in the molecular cloud than in the Hii region position, the reactive ions CO+ and HOC+ have only been detected towards the UC Hii region. Both CO+ lines have been detected towards the UC Hii region, and fulfill the line ratio of 0.55 expected for optically thin emission.
The parameters of the Gaussian fits to all the observed lines at the two positions in Mon R2 (and also the single position in G29.96-0.02) are shown in Table 2. The H13CO+ and HC18O+ lines seem to mimic the CS J = 76 line emission –a well known tracer of high density gas–, because both lines are enhanced in the molecular cloud with respect to the Hii region. This enhancement is indeed a lower limit, because these lines were observed with a 29″ beam. However, the behaviour of CO+ and HOC+ is the opposite. Since the dipole moments of both ions are similar to that of HC18O+ and H13CO+, this effect may not be due to an excitation effect. Actually, the detection of these ions towards the ionized region and the lack of detection towards the molecular envelope can only be understood if the abundances of CO+ and HOC+ are strongly enhanced toward the position of the UC Hii region relative to those in the molecular cloud. Very likely, the emitting region of these ions would be the PDR associated to Mon R2.
4 G29.96-0.02
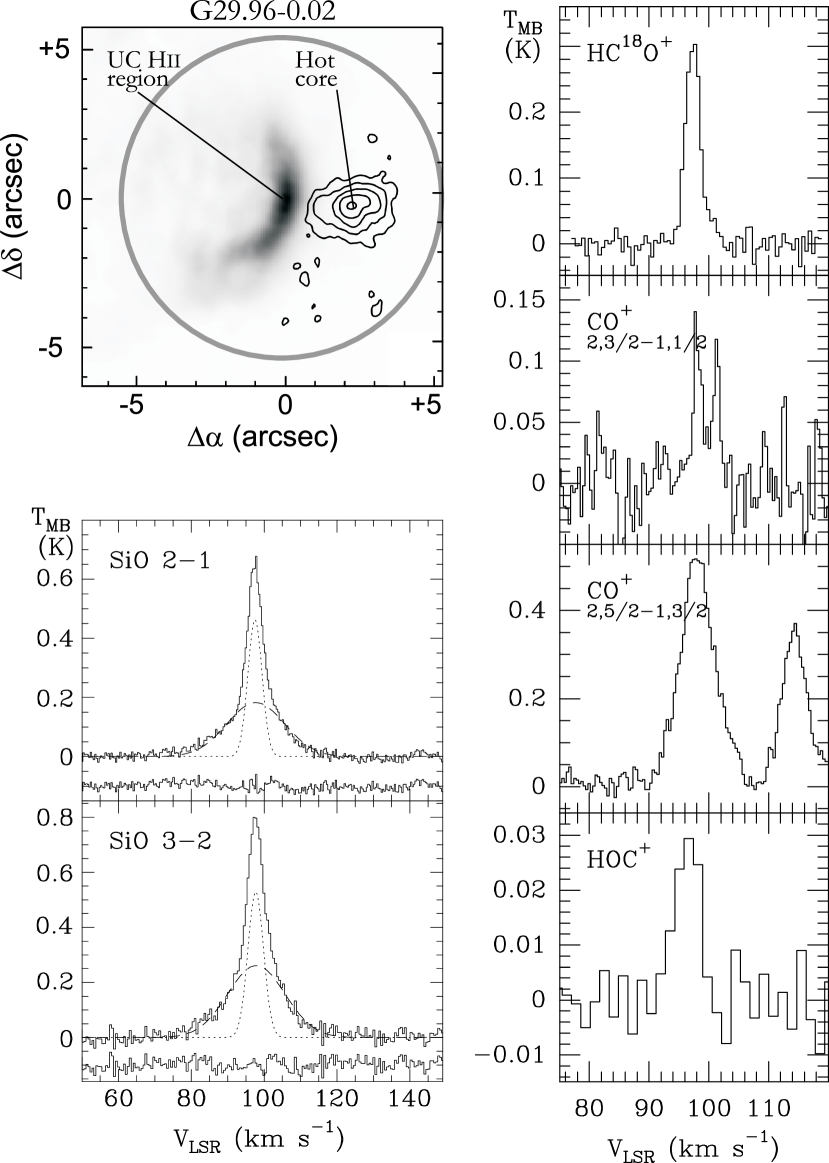
The situation in G29.96-0.02 is more complex than in Mon R2. Besides a surrounding massive molecular envelope, there is also a hot core at 2″ from the center of the UC Hii region. So far, our single-dish observations were done toward a single position which includes, even at 1mm, contributions from the UC Hii region, the molecular envelope and the hot core. The positions of G29.96-0.02 and its neighbour hot core, as well as the relevant spectra observed in this paper, are shown in Fig. 2.
Both the hot core and the dense envelope associated with this source have been extensively observed in molecular lines (see e.g. Cesaroni et al. 1998; Maxia et al. 2001). Fortunately, we can identify and separate the emission of the hot core by kinematics considerations. While the lines arising in the hot core should have linewidths 15–20 km s-1, the lines arising in the molecular cloud and/or PDR should have linewidhts 3–5 km s-1. In Fig. 2 (lower left panel), the SiO 32 and SiO 21 spectra are shown. We see that these spectra have a narrow and a wide components. While the narrow component arises from the UC Hii region and the molecular environment, the wide component arises from the hot core.
Figure 2 (right panel) shows the HC18O+, CO+ and HOC+ spectra observed in G29.96-0.02. The CO+ lines does not fulfill the standard ratio of 0.55, because of the blending of the 2,5/21,3/2 line by two hyperfine components of 13CH3OH, which is expected to be abundant in the hot core and the molecular cloud. The contamination was confirmed by the broad bandwidth (256 1 MHz-filterbank) spectrum, which shows the “forest” of 13CH3OH, CH3CHO and HCO2CH3 lines (Blake et al. 1984). In order to avoid contamination with the 13CH3OH lines, we have used the CO+ 2,3/2 1,1/2 line for our column density estimates.
Both the CO+ line and the HOC+ line are narrow (up to a few km s-1) and hence they are not originated in the hot core. Specially striking is the double-peaked structure of the 2,3/21,1/2 line. The main peak, at 98.0 km s-1, has the velocity of the UC Hii region, while the secondary peak, at 101.3 km s-1, is clearly redshifted. It is worth noting that there is HCO+ emission also at this redshifted velocity (Maxia et al. 2001), as well as a weak emission in our HC18O+ spectra. As discussed by Maxia et al. (2001), the HCO+ emission is associated to the UC Hii region. The simplest explanation for the redshifted component is that we are seeing a thin layer of dense gas in the receding face of the UC Hii region. The fact that both CO+ peaks are similar in intensity, while the main part of the HC18O+ spectrum is 10 times larger than the redshifted part, implies that the CO+ abundance would be 10 times larger in the receding layer with respect to the 98 km s-1 gas. This shows that the chemistry of this receding layer is being dominated by UV radiation from the UC Hii region. We are very likely seeing the innermost layer of molecular gas which is being accelerated by the ionized gas.
5 CO+ and HOC+ as tracers of dense PDRs
We have used the SiO J = and lines to estimate the hydrogen densities in these regions. Using a LVG code and assuming for both sources the kinetic temperature (Tk) of Mon R2 (50 K, Giannakopoulou et al. 1997), we have derived hydrogen densities, , of 1.5 106 cm-3 for the (0″,0″) position of Mon R2, and 1.0 106 cm-3 and 7.0 105 cm-3 for the wide and narrow component of the emission towards G29.96-0.02. These estimates are in reasonable agreement with other species already observed, as referred above. The H13CO+ column density has been determined using the LVG code and Tk = 50 K and = 106 cm-3. With these assumptions, the H13CO+ rotation temperature is 20 K. Since the dipole moments of the observed reactive ions are similar to that of H13CO+ we have derived the CO+, HOC+ and HC18O+ column densities assuming optically thin emission and using the LTE approximation with a rotation temperature of 20 K. In Table 3, we show the column densities derived in this way for the two positions observed in Mon R2 and for the narrow and wide component in G29.96-0.02.
Several arguments support the reactive ions CO+ and HOC+ arising in the PDRs linked to these UC Hii regions. To start with, a significant variation in the CO+ abundance can be found between the molecular peak and the UC Hii region in Mon R2 (see Table 3). The [CO+]/[HC18O+] ratio is at least a factor of 6 larger towards the UC Hii region than towards the molecular cloud. Assuming a uniform HC18O+ abundance, this means that the CO+ abundance is at least a factor of 6 larger in the UC Hii region than in the surrounding molecular cloud. Like CO+, the reactive ion HOC+ has only been detected towards the UC Hii region in Mon R2. Assuming 16O/18O 650, we have measured [HCO+]/[HOC+] 460 in Mon R2. This value is similar to that found in the Orion Bar but significantly lower than the values found by Apponi & Ziurys (1997) in a sample of star forming regions.
The CO+ and HOC+ column densities are similar in both objects. This is quite surprising taking into account that the column densities of the other molecules (H13CO+, HC18O+ and SiO) are at least one order of magnitude larger in G29.96-0.02 than in Mon R2. It may be explained if CO+ and HOC+ arise in the PDR while the other species are well spread in the whole molecular cloud. Actually, this is an indirect prove of the link of the reactive ions CO+ and HOC+ with the UC Hii region.
6 Discussion: CO+ and HOC+ chemistry
The observation of reactive ions in regions with a wide range of physical conditions is necessary to disclose between the different chemical processes involved in the chemistry of reactive ions. Thus far, most of the studied PDRs have low densities, 105 cm-3, and incident UV fields, G0 105. There is a lack of data on regions of high densities and ionizing radiation. Mon R2 and G29.96-0.02 are the first targets where the reactive ions CO+ and HOC+ can be studied in such conditions.
We have estimated the incident UV field by assuming that the observed FIR emission (LFIR) represents all the stellar flux. Then a black body radiation law at the exciting star’s effective temperature (Teff) is assumed to estimate the fraction of the luminosity radiated in the UV range. Adopting values for Teff, LFIR and distance to the star of 24000 K, 3000 L⊙ and 0.03 pc for Mon R2 (Henning et al. 1992), and 35000 K, 45000 L⊙ and 0.2 pc for G29.96-0.02 (Morisset et al. 2002; Martín-Hernández et al. 2003), we have obtained G for Mon R2 and G for G29.96-0.02. These values comparable to that of the star-forming region W49N (Vastel et al. 2001) and are significantly larger than the values of G0 in the prototypical and best studied PDRs.
In Fig. 3 we show the CO+ and HOC+ column densities derived in this paper and in Fuente et al. (2003), as a function of the incident UV field. Error bars represent the source-averaged and beam-averaged limits, and hence do not take into account other sources of uncertainty. The beam filling factor was computed by taking into account the angular extension of each PDR. The assumed sizes are: a filament of 6′′ of thickness in NGC 7023 (Fuente et al. 1996); half of the beam in the case of the Orion Bar since the (0′′, 0′′) position is at the edge of the molecular bar (Fuente et al. 2003); 13′′ in NGC 7027 (Cox et al. 1997); and the sizes of the radio continuum emission at 6cm, 10′′ and 8′′ in Mon R2 and G29.96-0.02 respectively. Mon R2 and G29.96-0.02 are at the upper end of the range of UV fields studied so far. A selection effect may be present in Fig. 3 because the detection are only possible above a certain column density (approximately the upper limit of HOC+ in NGC 7027). Even so, when detected, the column densities remain of the same order in a variety of objects, which is graphically shown in the large range of G0 in Fig. 3. Although the UV fields are spread over two orders of magnitude, the CO+ column densities measured towards Mon R2 and G29.96-0.02 are closely similar, within a factor of 2, to those observed in the Orion Bar and NGC 7023. This would imply that the total CO+ column density in a PDR remain roughly constant for a wide range of global physical conditions ( from 105 cm-3 to 106 cm-3) and UV radiation fields (G0 from 103 to ). Only the C-rich planetary nebula NGC 7027 seems rather different from the rest of sources. A similar behavior is found for HOC+.
The chemistry of CO+ is still poorly known. Several CO+ formation mechanisms, including C+ + OH CO+ + H, the charge transfer reaction between CO and CH+, and the direct ionization of CO, have been proposed to explain the large CO+ abundances observed. The almost constant CO+ abundance argues in favour of the direct photoionization of CO is not a significant formation mechanism for CO+ (Fuente & Martín-Pintado 1997). Models in which only the C+ + OH and CH+ + CO reactions are included (Sternberg & Dalgarno 1995; Hasegawa et al. 2000) accounts reasonably well for the CO+ column densities plotted in Fig. 3.
On the other hand, HOC+ is efficiently formed in a PDR via the reaction C+ + H2O HOC+/HCO+ + H, and CO+ + H2 HOC+/HCO+ + H, but it is rapidly destroyed by the isomerization reaction with H2 (Smith et al. 2002). The low values of [HCO+]/[HOC+] observed in PDRs can only be explained by a very rapid loss of the isomer HCO+ by electronic recombination in regions with high electron density. There is no detection of HOC+ in NGC 7027, which is quite surprising regarding the large CO+ column density measured in this source. One possible explanation is that the bulk of the HOC+ and HCO+ in PDRs are formed by the reaction C+ + H2O in a region where the CO+ is not abundant. This path is reinforced by the low abundance of water in NGC 7027 (Liu et al. 1996). In order to disentangle among the different processes, detailed chemical models and interferometric observations –which will trace the relative positions of the CO+ and HOC+ layers– are required.
| Line | Freq (GHz) | beam (′′) | |
|---|---|---|---|
| HOC+ 1 0 | 89.4874 | 27.5 | 0.77 |
| H13CO+ 1 0 | 86.7543 | 28 | 0.78 |
| HC18O+ 1 0 | 85.1622 | 29 | 0.78 |
| CO+ 2,5/2 1,3/2 | 236.0625 | 10.5 | 0.51 |
| CO+ 2,3/2 1,1/2 | 235.7896 | 10.5 | 0.51 |
| SiO 2 1 | 86.8468910 | 28 | 0.78 |
| SiO 3 2 | 130.268702 | 19 | 0.72 |
| Position | Line | VLSR | V | Area |
|---|---|---|---|---|
| (′′,′′) | (km s-1) | (K km s-1) | ||
| Mon R2 | ||||
| (0,0) | HC18O+ 10 | 9.6 (4) | 1.3 (8) | 0.07 (4) |
| H13CO+ 10 | 10.5 (5) | 5.4 (8) | 0.57 (9) | |
| HOC+ 10 | 9.9 (8) | 2.2 (9) | 0.06 (4) | |
| CO+ 2,5/21,3/2 | 9.7 (7) | 4.3 (9) | 0.46 (9) | |
| CO+ 2,3/21,1/2 | 10.4 (5) | 2.8 (9) | 0.27 (9) | |
| SiO 21 | 9.6 (3) | 1.1 (9) | 0.05 (2) | |
| SiO 32 | 9.7 (7) | 3.0 (9) | 0.26 (9) | |
| (+10,-10) | HC18O+ 10 | 10.7 (5) | 1.7 (9) | 0.11 (6) |
| H13CO+ 10 | 11.2 (9) | 3.5 (9) | 1.4 (4) | |
| HOC+ 10 | — | — | ||
| CO+ 2,5/21,3/2 | — | — | ||
| CO+ 2,3/21,1/2 | — | — | ||
| G29.96-0.02 | ||||
| (0,0) | HC18O+ 10 | 97.3 (1) | 2.9 (3) | 0.95 (6) |
| H13CO+ 10(W)(W)footnotemark: | 96.2 (9) | 16.1 (9) | 1.0 (4) | |
| H13CO+ 10(N)(N)footnotemark: | 97.7 (1) | 4.4 (2) | 6.7 (3) | |
| HOC+ 10 | 96.1 (9) | 3.0 (9) | 0.08 (5) | |
| CO+ 2,5/21,3/2(B)(B)footnotemark: | 98.1 (9) | 7.1 (9) | 3.79 (9) | |
| CO+ 2,3/21,1/2(M)(M)footnotemark: | 98.0 (4) | 1.3 (9) | 0.14 (8) | |
| CO+ 2,3/21,1/2(R)(R)footnotemark: | 101.3 (3) | 1.0 (8) | 0.10 (7) | |
| SiO 21(W)(W)footnotemark: | 97.3 (1) | 18.9 (9) | 3.6 (1) | |
| SiO 21(N)(N)footnotemark: | 97.5 (1) | 4.6 (2) | 2.3 (1) | |
| SiO 32(W)(W)footnotemark: | 97.7 (1) | 5.0 (3) | 2.8 (3) | |
| SiO 32(N)(N)footnotemark: | 97.9 (3) | 18.6 (9) | 5.2 (3) | |
| Position | SiO | HC18O+ | H13CO+ | HOC+ | CO+ |
|---|---|---|---|---|---|
| Mon R2 | |||||
| (0,0) | 1.0 1011 | 1.2 1011 | 1.1 1012 | 1.7 1011 | 5.3 1011 |
| (+10,-10) | — | 1.8 1011 | 2.6 1012 | 0.8 1011 | 1.6 1011 |
| G29.96-0.02 | |||||
| (0,0)wide | 1.1 1013 | — | 1.5 1012 | — | — |
| (0,0)narr. | 6.9 1012 | 1.5 1012 | 9.0 1012 | 2.3 1011 | 4.7 1011 |
References
- Apponi & Ziurys (1997) Apponi, A. J. & Ziurys, L. M. 1997, ApJ, 481, 800
- Blake et al. (1984) Blake, G. A., Sutton, E. C., Masson, C. R., Phillips, T. G., Herbst, E., Plummer, G. M., & de Lucia, F. C. 1984, ApJ, 286, 586
- Cesaroni, Hofner, Walmsley, & Churchwell (1998) Cesaroni, R., Hofner, P., Walmsley, C. M., & Churchwell, E. 1998, A&A, 331, 709
- Cox et al. (1997) Cox, P., Maillard, J.-P., Huggins, P. J., et al. 1997, A&A, 321, 907
- Choi, Evans, Tafalla, & Bachiller (2000) Choi, M., Evans, N. J., Tafalla, M., & Bachiller, R. 2000, ApJ, 538, 738
- Fuente et al. (2003) Fuente, A., Rodríguez-Franco, A., García-Burillo, S., Martín-Pintado, J., & Black, J. H. 2003, A&A, 406, 899
- Fuente & Martin-Pintado (1997) Fuente, A. & Martín-Pintado, J. 1997, ApJ Let, 477, L107
- Fuente et al. (1996) Fuente, A., Martín-Pintado, J., Neri, R., Rogers, C., & Moriarty-Schieven, G. 1996, A&A, 310, 286
- Giannakopoulou et al. (1997) Giannakopoulou, J., Mitchell, G. F., Hasegawa, T. I., Matthews, H. E., & Maillard, J. 1997, ApJ, 487, 346
- Hasegawa et al. (2000) Hasegawa, T., Volk, K., & Kwok, S. 2000, ApJ, 532, 994.
- Henning, Chini, & Pfau (1992) Henning, T., Chini, R., & Pfau, W. 1992, A&A, 263, 285
- Liu et al. (1996) Liu, X.-W., et al. 1996, A&A, 315, L257
- Martí́n-Hernández et al. (2003) Martín-Hernández, N. L., Bik, A., Kaper, L., Tielens, A. G. G. M., & Hanson, M. M. 2003, A&A, 405, 175
- Maxia, Testi, Cesaroni, & Walmsley (2001) Maxia, C., Testi, L., Cesaroni, R., & Walmsley, C. M. 2001, A&A, 371, 287
- Morisset et al. (2002) Morisset, C., Schaerer, D., Martín-Hernández, N. L., Peeters, E., Damour, F., Baluteau, J.-P., Cox, P., & Roelfsema, P. 2002, A&A, 386, 558
- Pratap, Megeath, & Bergin (1999) Pratap, P., Megeath, S. T., & Bergin, E. A. 1999, ApJ, 517, 799
- Smith, Schlemmer, von Richthofen, & Gerlich (2002) Smith, M. A., Schlemmer, S., von Richthofen, J., & Gerlich, D. 2002, ApJ Let, 578, L87
- Sternberg & Dalgarno (1995) Sternberg, A. & Dalgarno, A. 1995, ApJS, 99, 565
- Vastel et al. (2001) Vastel, C., Spaans, M., Ceccarelli, C., Tielens, A. G. G. M., & Caux, E. 2001, A&A, 376, 1064
- Wood & Churchwell (1989) Wood, D. O. S. & Churchwell, E. 1989, ApJS, 69, 831