The Earliest Optical Observations of GRB 030329
Abstract
We present the earliest optical imaging observations of GRB 030329 related to SN 2003dh. The burst was detected by the HETE-2 satellite at 2003 March 29, 11:37:14.67 UT. Our wide-field monitoring started 97 minutes before the trigger and the burst position was continuously observed. We found no precursor or contemporaneous flare brighter than () in 32 s (64 s) timescale between 10:00 and 13:00 UT. Follow-up time series photometries started at 12:51:39 UT (75 s after position notice through the GCN) and continued for more than 5 hours. The afterglow was at min after burst. Its fading between 1.2 and 6.3 hours is well characterized by a single power-law of the form in -band. No significant flux variation was detected and upper limits are derived as % in minutes to hours timescales and % in seconds to minutes timescales. Such a featureless lightcurve is explained by the smooth distribution of circumburst medium. Another explanation is that the optical band was above the synchrotron cooling frequency where emergent flux is insensitive to the ambient density contrasts. Extrapolation of the afterglow lightcurve to the burst epoch excludes the presence of an additional flare component at minutes as seen in GRB 990123 and GRB 021211.
1 Introduction
A long (50 s) duration gamma-ray burst of extreme brightness, GRB 030329 (Vanderspek, et al. 2003), was detected by the three instruments, FREGATE (Atteia, et al. 2002), WXM (Shirasaki, et al. 2003), and SXC (Monnelly, et al. 2002) on the HETE-2 satellite (Ricker, et al. 2002) at 2003 March 29 11:37:14.67 UT. The fluence in 3–400 keV range was (Ricker, 2003). The burst direction was determined by ground analysis and distributed through GCN (Barthelmy, et al. 1995) at 12:50:24 UT (73 minutes after trigger).
Identification of an optical afterglow was reported by Peterson & Price (2003), followed by Torii (2003) and Uemura (2003). The redshift of the afterglow was measured as from high resolution spectroscopy with the VLT (Greiner, et al. 2003). As the afterglow faded, a supernova component (SN 2003dh) emerged which was clearly observed both photometrically and spectroscopically (Stanek, et al. 2003; Kawabata, et al. 2003; Hjorth, et al. 2003). A dwarf host galaxy with an absolute magnitude similar to the Small Magellanic Cloud was found with the HST observations (Fruchter, et al. 2003).
In this Letter, we report the earliest phase behavior of the optical afterglow of GRB 030329. We use a luminosity distance of 800 Mpc and the prompt gamma-ray energy output, , where and are correction factors for the observed energy range and beaming (Bloom, et al. 2003).
2 Observations
Our observation log is summarized in table 1. The sky region of GRB 030329 was continuously imaged by the Yatsugatake Camera. The system consists of two (North and South) unguided (fixed) ultra wide field video cameras placed at an altitude of 1000 m in Yatsugatake, Japan. The sky position of the GRB was always out of the field of view of the northern camera. The southern camera (hereafter YC-S) utilized SONY XC-75 and a wide angle lens of focal length 3.5mm (f/1.4). The field of view was . Images were continuously output in NTSC format after 8 s integrations, stored to frame memory (MSJ SS-10), and written to timelapse video tape. Approximate read-out time of each frame was superimposed in the data. We further calibrated the read-out time of YC-N to within s by using a bright meteor.
Follow-up observations of the burst position were made with the Automated Response Telescope (ART) at RIKEN. The two computer controlled equatorial mounts were used for the observation. These mounts carry a 0.20-m f/4.0 reflector (hereafter T1) and a 0.25-m f/6.8 reflector (T2), respectively. T1 was equipped with Apogee AP7p camera which gave 5353 arcmin field of view. T2 was equipped with Apogee AP6E camera with 5050 arcmin field of view. The CCDs were continuously read out with a constant integration times of 30-s and 60-s for T1 and T2, respectively. The burst position was received through the GCN (GRB Coordinates Network) (Barthelmy, et al. 1995) and the two telescopes automatically slewed to the notified position under fine meteorological condition. The first useful frames were acquired starting at 12:51:39 (75 s after notification) with T1 and 12:52:09 with T2. On Mar. 29, the first images obtained with T2 were matched to USNO-A2.0 catalog (Monet, et al. 1998) by using PIXY111http://www.aerith.net/misao/pixy1/index.html. The optical afterglow candidate was identified as an only one uncataloged object in the field of view. This object was not present in a DSS (POSS E) frame and no corresponding minor planet222http://scully.harvard.edu/∼cgi/CheckMP was cataloged. The information of this new transient was reported in a GCN circular (Torii, 2003). An earlier identification of the afterglow at the Siding Spring Observatory was reported by Peterson & Price (2003). Between 13:41 UT and 13:43 UT, three 30-s exposures were obtained with ART T1 by stopping the sidereal tracking. The afterglow was detected as linear trails in these frames and used to study short time variability with 0.44 s(/pixel) resolution.
In the city of Ageo, K. Kadota received an e-mail alert message and observed the afterglow. The instrument was 0.25 m Newtonian reflector equipped with unfiltered SBIG ST-9E CCD camera. The robotic GETS 0.25 m telescope at the Gunma Astronomical Observatory was also used to observe the afterglow. A part of the GETS data suffered from passages of clouds. At the Saji Observatory, K. Oribe acquired two and two frames with the 1.03-m reflector.
3 Analyses and Results
Analog data of the Yatsugatake Camera were analyzed after digitization as described below. A single frame of 8-s integration is stored as a single frame of NTSC format (1/30 s) in a VHS video tape. This means that nominal playback of the tape shows a movie of one minute which corresponds to 4 hours in original time. The tape was played back and read to a personal computer by using a capture card (Canopus, Power Capture Pro). The data were stored as uncompressed AVI format movies of 640480 resolution. From these movie files, each frame of 8 s integration was extracted as an 8-bit FITS file. We created background frames as an average of many adjacent-time frames and subtracted the background from the raw frames. This procedure largely reduced the effect of noisy hot pixels. We found that relatively faint ( mag) stars were not steadily apparent in a single s integration frame. However, these stars could be steadily seen if we combine four consecutive frames. This is probably explained by the fact that the CCD chip of YC-S is interline type and that it takes 32 s for a stellar image to pass a pixel structure by sidereal motion. We thus created stacked running mean of four frames, corresponding to 32 s integration. We also created stacked frames of s integration to see fainter objects.
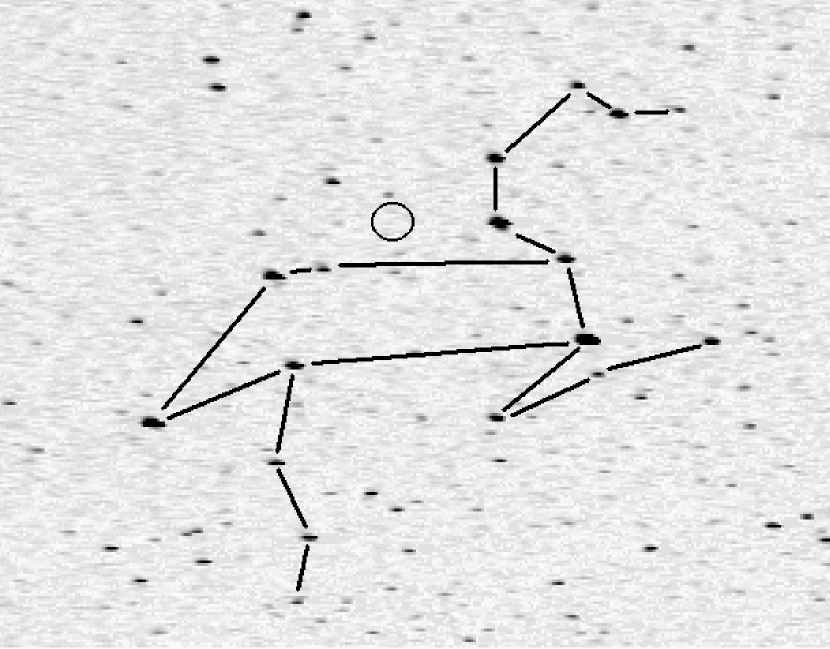
Figure 1 shows a stacked s frame at the burst trigger time. At the position of the afterglow, no significant object was found. In all the frames with 32 s (64 s) integration, a nearby mag ( mag) star is clearly seen while fainter stars are not always detected. We therefore derive an upper limit of () for 32 s (64 s) timescales between 10:00 and 13:00 UT for any optical emission associated with the GRB. These results expand our previous report based on the same data set (Okamoto, Ohnishi, & Torii 2003).
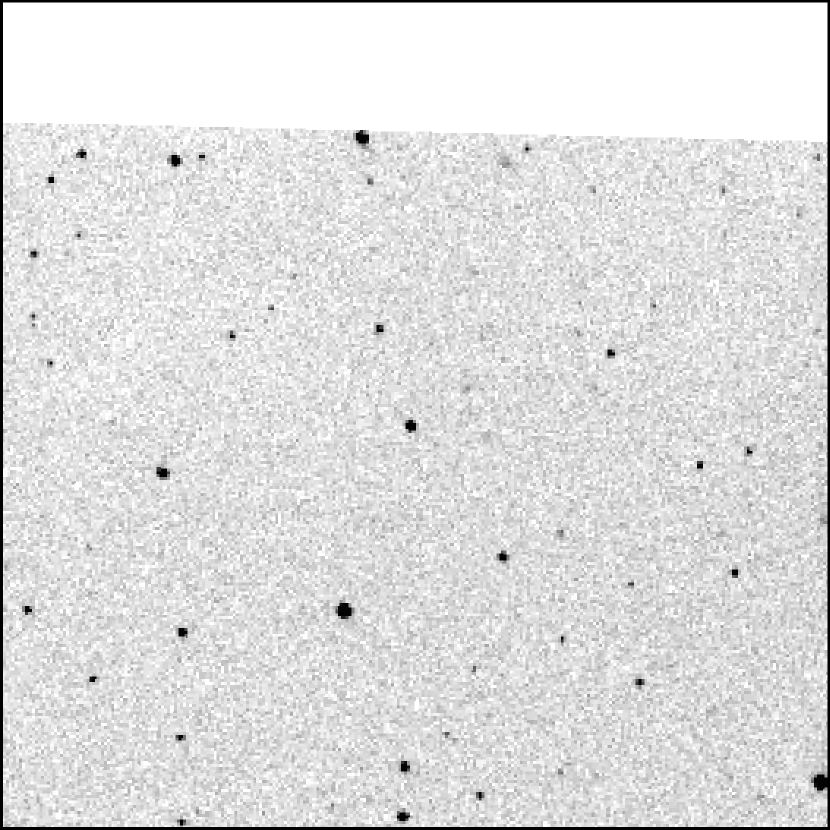
The other data, obtained with cooled CCD cameras, were reduced in standard ways. Figure 2 shows the first image obtained with the ART T1. After dark subtraction and flat fielding, aperture photometry was performed by a java-based software developed by T. Kato (ART and GETS data), PIXY-2333http://www.aerith.net/misao/pixy/index.html (Ageo data), and Astroart (Saji data). Photometric analysis for the Ageo data was performed by S. Yoshida. The Saji data were calibrated by using the standard stars of Landolt (1992), and the two frames in each of and were combined to yield the following measurements: at 16:58:00 UT and at 17:02:45 UT. For the ART, GETS, and Ageo data, we used a comparison star at (RA, Dec)=(10 44 54.485, +21 34 29.80) (J2000; USNO-A2.0 1050.06351075) as measured by Henden (2003), which has a similar color () to the afterglow.
For unfiltered observations, instrumental magnitudes were converted to by using color terms for corresponding CCDs (Henden 2000). We assumed that the afterglow had a constant color, , throughout the observations (Kinugasa, et al. 2003). This value is close to a near simultaneous independent measurement ( at Mar 29.744 UT; Burenin, et al. 2003a). We find that our corrected magnitudes obtained from different unfiltered instruments (ART, GETS, Ageo) agree within mag. These measurements agree within mag to the -filtered Saji data and we estimate that our absolute flux calibration is accurate at % level. Our best-fit power-law function as described below predicts mag brighter values compared to the simultaneous data obtained at the Siding Spring Observatory (Price, et al. 2003). The function also predicts mag brighter values compared to the first part of lightcurve obtained with RTT150 (Burenin, et al. 2003b).
Figure 3 shows the afterglow lightcurves. Among these, the data from ART T2 have the longest time coverage with highest signal-to-noise ratio; we discuss here on this data set. We estimated a total error of each measurement by RMS variations of comparison stars in 11–14 mag range. Total errors (combination of statistical and other errors except for a uniform shift of zero point) for T2 were estimated as mag at early part (when the afterglow was ) and mag at the last part (when the afterglow was ) in RMS. Photometric data from ART T2 are summarized in Table 2. We fit the ART T2 lightcurve with a power-law function, . This function is statistically accepted with . The best-fit parameters are and . Flux density at band (658 nm) is then derived as . Statistic errors are 90% confidence values and the systematic error for the decay index was estimated as the difference to the best-fit value for the ART T1 lightcurve. We therefore conclude that deviation from a single power-law decay was small ( % at first part and % at last part) in minutes to hours time scales during the observation. Uemura, et al. (2003b) reported the presence of wavy structures in the early lightcurve. Since the reported amplitude seems mag in the time region of our observations, the presence of such structures does not seem to be highly inconsistent with the results presented herein.
The three frames of ART T1 without sidereal tracking were investigated by constructing afterglow lightcurves with 0.44, 0.88, 1.76, and 3.52 s time bins. Compared to a similar magnitude star, no significant short-term variation was found. The variation of these data (upper limit of the afterglow fluctuation) is derived as, . Combining the results from ART T2 lightcurve, this relation is valid between seconds to minutes time scales.
4 Discussion
Afterglow lightcurves of gamma-ray bursts are generally described within a framework of synchrotron radiation from external forward shock (e.g., Wijers, Rees, & Mészáros 1997) as applied for the first afterglow of GRB 970228 (van Paradijs, et al. 1997; Costa, et al. 1997). For an adiabatic evolution into uniform medium, the shock radius is calculated as (Sari, Piran, & Narayan 1998). For our lightcurve between 1.2 and 6.3 hours after burst, the radius corresponds to pc.
A single power-law decay in the optical data () and a similar behavior in X-rays (; Tiengo, et al. 2003) suggest that the optical and X-ray bands were in the same segment of the multi-wavelength spectrum divided by the typical synchrotron frequency, , and the synchrotron cooling frequency, (Sari, et al. 1998). Just after the end of our observations, the decay index suddenly steepened to (Lipunov, et al. 2003) or (Burenin, et al. 2003b). At days, the decay index further steepened to (Burenin, et al. 2003b; Garnavich, Stanek, & Berlind 2003).
The value of at hours is close to as expected from the passage of a cooling frequency through the observing band. In this case, the flux evolves from to (Sari, et al. 1998) and is derived for electron number distribution. This interpretation is interesting, since the index is close to the universal value, , expected from particle acceleration in ultrarelativistic shock (e.g., Abraham, et al. 2001). However, there is difficulty in explaining the latter larger break to which lasted over 1000 hours in X-rays (Tiengo, et al. 2003). The steepening to was achromatic (Burenin, et al. 2003b) and could probably be interpreted as jet break in constant density medium (e.g., Sari, Piran, & Halpern 1999; Kumar & Panaitescu 2000). For a jet break, the decay index evolves from to . While this interpretation suggests a flat particle distribution, (with high energy cut-off), the evolution of decay index is naturally reproduced.
Since this gamma-ray burst was related to the supernova (Stanek, et al. 2003; Kawabata, et al. 2003; Hjorth, et al. 2003), significant amount of circumstellar medium must have been present around the progenitor (e.g., Chevalier & Li 1999). Massive stars (such as a Wolf-Rayet star) blow blob-like winds and hydrodynamic instability is also expected (e.g., Garcia-Segura, Langer, & Mac Low 1996). The shock interactions in such media modify the lightcurve while the effect depends on the observed frequency range (e.g., Lazzati, et al. 2002; Nakar, Piran, & Granot 2003). At above the cooling frequency, , radiated flux is almost insensitive to the density fluctuation for . While the radiated flux sensitively traces the density variation between and . In several afterglows, bumpy structures (e.g., GRB 021004: Fox, et al. 2003) or irregular fluctuations (GRB 030418: Smith, Rykoff, & McKay 2003) were observed at early phase. These features may be attributed to density fluctuations in the circumburst medium and the cooling frequency above the optical band (Lazzati, et al. 2002).
In the early afterglow of GRB 030329, the absence of significant fluctuation may be attributed to the smooth ambient medium. For small density contrasts, the overall hydrodynamical structure is not modified and the radiated flux scales as (Lazzati, et al. 2002). From our measurements of %, upper limits for density contrasts are estimated as %. Another explanation is that a sign of inhomogeneities did not emerge in the lightcurve because the optical band was above during the observation. Burenin, et al. (2003b) observed the afterglow between 0.25 and 0.6 days and derived upper limits of 10–1% for flux fluctuation on 0.1–1000 s time scales. Therefore, the current discussions apply for a broader time range between 1.2 hours and 0.6 days after burst.
If we simply extrapolate the afterglow lightcurve toward the burst epoch, expected magnitudes are and at s and s after trigger, respectively. Our contemporaneous upper limits of , as well as similar limits from contemporaneous photography (Sasaki, et al. 2003), are above these estimates. In some gamma-ray bursts (GRB 990123: Akerlof, et al. 1999; GRB 021211: Wozniak, et al. 2002; Park, Williams, & Barthelmy 2002; Li, et al. 2003a), bright and rapidly fading () optical flare is detected. This component dominates the ordinary afterglow within 10 minutes after burst and considered to originate from reverse shock (e.g., Kobayashi 2000). Our contemporaneous upper limit excludes the presence of such a flare component, as well as bright precursor emission.
In summary, the early optical afterglow of GRB 030329 is well characterized by a single power-law decay with index . The absence of significant flux fluctuation in our lightcurve suggests that the circumburst medium was smoothly distributed or the optical band was above the synchrotron cooling frequency during the observation.
References
- Abraham, et al. (2001) Abraham, A., Gallant, Y. A., Kirk, J. G., & Guthmann, A. W. 2001, MNRAS, 328, 393
- Akerlof, et al. (1999) Akerlof, C., et al. 1999, Nature, 398, 400
- Atteia, et al. (2002) Atteia, J.-L., et al. 2002, in Gamma-Ray Burst and Afterglow Astronomy 2001: A Workshop Celebrating the First Year of the HETE Mission, ed. G. R. Ricker & R. K. Vanderspek (New York: AIP), p.17
- Barthelmy, et al. (1995) Barthelmy, S. D., et al. 1995, Ap&SS, 231, 235
- Bloom, et al. (2003) Bloom, J. S., et al. 2003, ApJ, in press (astro-ph/0302210)
- Burenin, et al. (2003) Burenin, R., et al. 2003a, GCN Circ. 2024
- Burenin, et al. (2003) Burenin, R., et al. 2003b, Astronomy Letters, 2003, 9, 1
- Chevalier & Li (1999) Chevalier, R. A. & Li, Z-Y. 1999, ApJ, 520, L29
- Costa, et al. (1997) Costa, E., et al. 1997, Nature, 387, 783
- Fox, et al. (2003) Fox, D. W., et al. 2003, Nature, 422, 284
- Fruchter, et al. (2003) Fruchter, A., et al. 2003, GCN Circ. 2243
- Garnavich, et al. (2003) Garnavich, P., Stanek, K. Z., &Berlind, P. 2003, GCN Circ. 2018
- Garcia-Segura, et al. (1996) García-Segura, G., Langer, N., & Mac Low, M-M. 1996, A&A, 316, 133
- Greiner, et al. (2003) Greiner, J., et al. 2003, GCN Circ. 2020
- Henden (2000) Henden, A. 2000, JAAVSO, 29, 35
- Henden (2003) Henden, A. 2003, GCN Circ. 2082
- Hjorth, et al. (2003) Hjorth, J., et al. 2003, Nature, 423, 847
- Kawabata, et al. (2003) Kawabata, K. S., et al. 2003, ApJ, 593, L19
- Kinugasa, et al. (2003) Kinugasa, K., et al. 2003, in preparation
- Kobayashi (2003) Kobayashi, S. 2000, ApJ, 545, 807
- Kumar & Panaitescu (2000) Kumar, P., & Panaitescu, A. 2000, ApJ, 541, L9
- Landolt (1992) Landolt, A. U. 1992, AJ, 104, 340
- Lazatti, et al. (2002) Lazzati, D., Rossi, E., Covino, S., Ghisellini, G., Malesani, D. 2002, A&A, 396, L5
- Li, et al. (2003) Li, W., Filippenko, A. V., Chornock, R., & Jha, S. 2003, ApJ, 586, L9
- Lipunov, et al. (2003) Lipnov, V., et al. 2003b, GCN Circ. 2091
- Monet et al. (1998) Monet, D., et al. 1998, USNO-A 2.0, A Catalog of Astrometric Standards (Flagstaff: U.S. Naval Observatory Flagstaff Station)
- Monnelly, et al. (2002) Monnelly, G., et al. 2002, in Gamma-Ray Burst and Afterglow Astronomy 2001: A Workshop Celebrating the First Year of the HETE Mission, ed. G. R. Ricker & R. K. Vanderspek (New York: AIP), p.25
- Nakar, Piran, & Granot (2003) Nakar, E., Piran, T., Granot, J. 2003, New Astronomy, 8, 495
- Okamoto, Ohnishi, & Torii (2003) Okamoto, Y., Ohnishi, K., & Torii, K. 2003, GCN Circ. 2225
- Park, et al. (2002) Park, H. S., Williams, G., & Barthelmy, S. 2002, GCN Circ. 1736
- Peterson & Price (2003) Peterson, B. A., & Price, P. A. 2003, GCN Circ. 1985
- Price, et al. (2003) Price, P. A., et al. 2003, Nature, 2003, 423, 844
- Ricker et al. (2002) Ricker, G. R., et al. 2002, in Gamma-Ray Burst and Afterglow Astronomy 2001: A Workshop Celebrating the First Year of the HETE Mission, ed. G. R. Ricker & R. K. Vanderspek (New York: AIP), p.3
- Ricker et al. (2003) Ricker, G. R. 2003, IAUC, 8101
- Sari, Piran, & Narayan (1998) Sari, R., Piran, T., & Narayan, R. 1998, ApJ, 497, L17
- Sari, Piran, & Halpern (1999) Sari, R., Piran, T., & Halpern, J. P. 1999, ApJ 519, L17
- Sasaki, et al. (2003) Sasaki, K., et al. 2003, GCN Circ. 2217
- Shirasaki et al. (2003) Shirasaki, Y., et al. 2003, PASJ, in press
- Smith, et al. (2003) Smith, D. A., Rykoff, E. S., & McKay, T. A. 2003, GCN Circ. 2153
- Stanek, et al. (2003) Stanek, K. Z., et al. 2003, ApJ, 591, L17
- Tiengo, A., et al. (2003) Tiengo, A., Mereghetti, S., Ghisellini, G., Rossi, E., Ghirlanda, G., & Schartel, N. 2003, A&A, in press (astro-ph/0305564)
- Torii (2003) Torii, K. 2003, GCN Circ. 1986
- Uemura et al. (2003) Uemura, M. 2003, GCN Circ. 1989
- Uemura et al. (2003) Uemura, M., et al. 2003, Nature, 423, 843
- Vanderspek, et al. (2003) Vanderspek, R., et al. 2003, GCN Circ. 1997
- van Paradijs, et al. (1997) van Paradijs, J., et al. 1997, Nature, 386, 686
- Wijers, Rees, & Mészáros (1997) Wijers, R. M. A. J., Rees, M. J., & Mészáros, P. 1997, MNRAS, 288, L51
- Wozniak, et al. (2002) Wozniak, P., et al. 2003, GCN Circ. 1757

| Site | Instruments | Filter | Start Time (UT) | End Time (UT) | Integration [s] | Number of frames | Observer / PI |
|---|---|---|---|---|---|---|---|
| Yatsugatake | YC-S | IR-cut | 10:00:00 | 13:00:00 | 8 | 1350 | Okamoto |
| Wako | ART 0.20 m + AP7p | No | 12:51:39 | 17:55:00 | 30 | 437 | Torii |
| Wako | ART 0.25 m + AP6E | No | 12:52:09 | 17:54:52 | 60 | 277 | Torii |
| Ageo | 0.25m + ST-9E | No | 13:38:12 | 16:03:50 | 4, 60 | 59 | Kadota |
| Gunma | GETS 0.25m + AP7p | No | 14:21:55 | 17:55:06 | 30 | 181 | Kinugasa |
| Saji | 1.03 m | , | 16:54:30 | 17:05:00 | 120 | 4 | Oribe |
| Mean Epoch a | mag | Mag error (1 ) |
|---|---|---|
| 0.052365 | 12.383 | 0.025 |
| 0.053106 | 12.419 | 0.026 |
| 0.053858 | 12.430 | 0.026 |
| 0.054610 | 12.441 | 0.026 |
| 0.055363 | 12.453 | 0.026 |
a days after burst trigger at 2003 March 29, 11:37:14.67 UT.
Only the first 5 rows are tabulated here. The other data are available in electric format (machine readable table).