The Type Ic Hypernova SN 2003dh/GRB 030329
Abstract
The spectra of SN 2003dh, identified in the afterglow of GRB030329, are modeled using radiation transport codes. It is shown that SN 2003dh had a high explosion kinetic energy ( erg in spherical symmetry), making it one of the most powerful hypernovae observed so far, and supporting the case for association between hypernovae and Gamma Ray Bursts. However, the light curve derived from fitting the spectra suggests that SN 2003dh was not as bright as SN 1998bw, ejecting only of 56Ni. The spectra of SN 2003dh resemble those of SN 1998bw around maximum, but later they look more like those of the less energetic hypernova SN 1997ef. The spectra and the inferred light curve can be modeled adopting a density distribution similar to that used for SN 1998bw at km s-1 but more like that of SN 1997ef at lower velocities. The mass of the ejecta is , somewhat less than in the other two hypernovae. The progenitor must have been a massive star (), as for other hypernovae. The need to combine different one-dimensional explosion models strongly indicates that SN 2003dh was an asymmetric explosion.
1 INTRODUCTION
Evidence that at least some Gamma Ray Bursts (GRB’s) are connected to Supernovae (SNe) is mounting. After the serendipitous discovery of SN 1998bw in coincidence with GRB980425 (Galama et al. 1998), several other cases of possible SNe in GRB’s have been reported (e.g., Bloom et al. 2002; Garnavich et al. 2003). All of these were however based only on the detection of ‘bumps’ in the GRB afterglows’ light curves, which could be decomposed to look like the light curve of SN 1998bw.
SN 1998bw was no ordinary SN. Its broad spectral features were explained as indicating a very energetic Type Ic SN (arising from the collapse of the bare CO core of a massive star). Because of its high explosion kinetic energy ( erg in spherical symmetry), and the consequently very broad spectral lines, SN 1998bw was called a ‘hypernova’ (Iwamoto et al. 1998). Other hypernovae have been discovered and analyzed (e.g. SNe 1997ef (Iwamoto et al. 2000; Mazzali, Iwamoto, & Nomoto 2000); SN 2002ap (Mazzali et al. 2002)), but none was associated with a GRB. This may be related to the fact that none of these SNe were either as bright or as powerful as SN 1998bw. So far, the only other positive detection of a SN spectrum in a GRB afterglow is the case of GRB021211/SN 2002lt (della Valle et al. 2003).
Given this intriguing but insufficient evidence, excitement mounted when a very nearby GRB was detected (GRB030329, z=0.1685; Greiner et al. 2003), as a possible SN may be relatively easily observable in the light of the afterglow (AG). Indeed, the detection of broad spectral features characteristic of a supernova was reported by Stanek et al. (2003) and later by Hjorth et al. (2003). The SN (SN 2003dh) appeared to be similar to SN 1998bw. However, spectra at month had changed somewhat, looking more like those of the less energetic hypernova SN 1997ef (Kawabata et al. 2003).
There are significant differences between the SN 2003dh light curves of Matheson et al. (2003) and Hjorth et al. (2003). These may be due to the different observational methods and to major difficulties with subtraction of a) the underlying AG spectrum, which can change with time in an unknown way, and b) the host galaxy background. In particular, the Hjorth et al. (2003) light curve rises much more rapidly, reaches a brighter peak, and then drops much faster. The Matheson et al. (2003) light curve, on the other hand, has a slower rise, and resembles that of SN 1998bw. Unfortunately, neither light curve covers the likely time of peak, – 15 days after the GRB, because this time coincided with full moon. The absolute rest-frame magnitude at peak may have been between and , depending on the dataset used and the estimated extinction. Bloom et al. (2003), however, find that SN 2003dh may have been as bright as at peak. They used an extinction toward SN 1998bw, explaining at least part of the discrepancy. Also, they did not use spectral information in decomposing the light curve.
2 Spectral Models
Light curve models alone cannot uniquely constrain the properties of a SN, as models yielding similar light curves may give rise to different synthetic spectra (e.g. Iwamoto et al. 1998). Fitting both light curves and spectra is a much more effective approach.
Unfortunately, in the case of SN 2003dh the exact shape of the light curve is not yet certain. Therefore, we derived fiducial SN spectra by rescaling the early power-law spectrum of the AG to the blue flux of the later spectra, where a SN signature was evident, and subtracting it off. Attributing the entire blue flux to the AG is justified by the fact that because of line-blanketing type Ib/c SNe, like SNe Ia, always show a flux deficiency to the blue of (e.g. Mazzali et al. 2000). At the third epoch the blue continuum indicative of the AG is very weak, and no subtraction was applied. We fitted three spectra of SN 2003dh using our Monte Carlo code (Mazzali & Lucy 1993; Lucy 1999; Mazzali 2000).
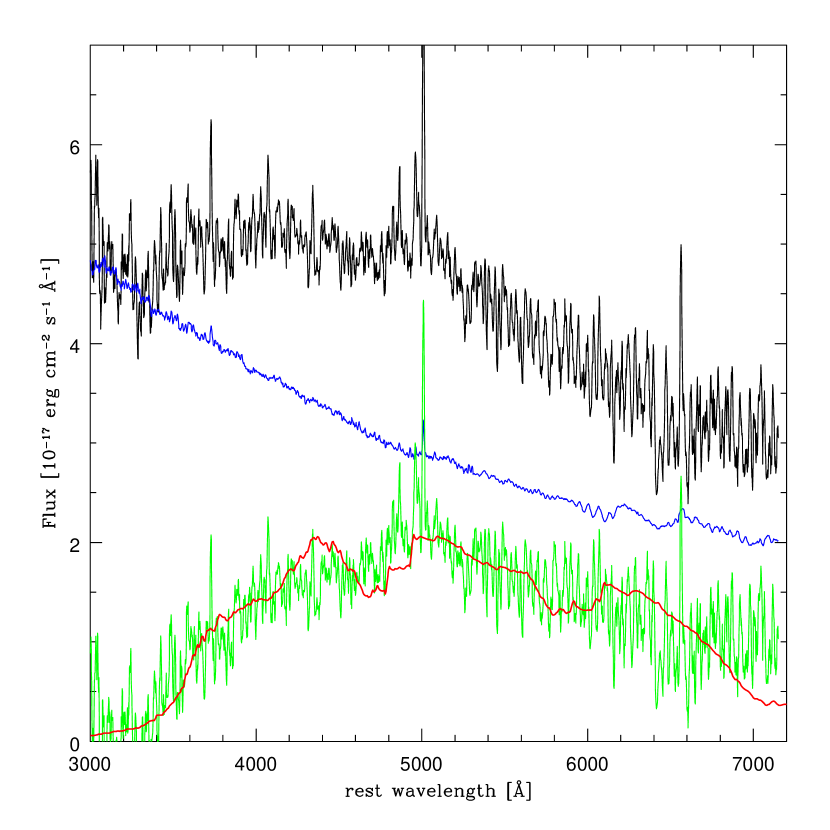
The first spectrum was obtained at the MMT on 2003 April 10 (Matheson et al. 2003). This is days after the GRB, i.e. rest-frame days into the life of the SN, assuming that the SN and the GRB coincided in time. The spectrum is characterized by very broad absorption lines, and it is similar to those of SN 1998bw at comparable epochs. Using the same explosion model as for SN 1998bw (model CO138E50; Table 1), a good match can be obtained for and km s-1 (Figure 1). The synthetic spectrum has , . While the luminosity is lower than in SN 1998bw, the photospheric velocity is comparable (for SN 1998bw we had km s-1on day 8 and 20700 on day 16). This suggests that SN 2003dh ejected a significant amount of high-velocity material in our direction, which is understandable since we observed the GRB. SN 1998bw may have been even more energetic, but is was probably viewed less on-axis since its associated GRB was much weaker than GRB030329. Note that we cannot confirm the claim that SN 2003dh has higher-velocity ejecta than SN 1998bw. The model used for SN 1997ef (model CO100E18), on the other hand, has much too little mass at high velocities, and it does not yield a broad-lined spectrum similar to the observed one.
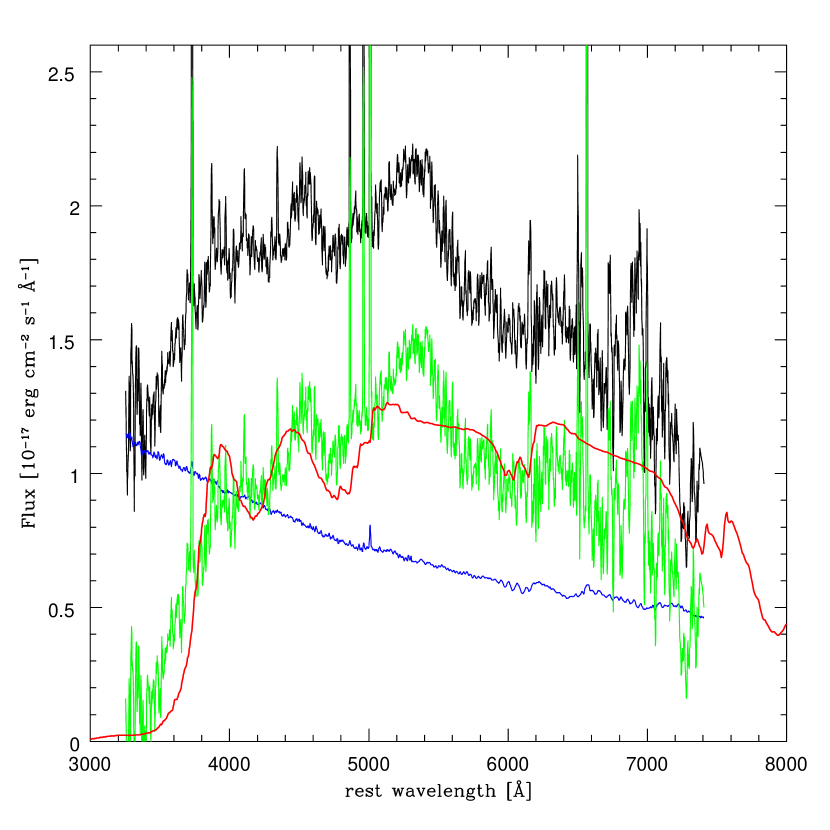
The next spectrum we attempted to fit is the MMT 2003 April 24 one (Matheson et al. 2003). The spectrum (rest-frame epoch days) still has broad lines, and it is almost as bright as the 10 April one, so that maximum probably occurred about half way between the two epochs. If model CO138E50 is used, the photosphere falls in the flat inner part of the density distribution (model CO138E50 ‘turns over’ at km s-1, which is above the position of the photosphere at this epoch). The rather flat density distribution just above the photosphere leads to very deep but narrow absorption lines, which are not like the observed spectrum. On the other hand, model CO100E18 still has too little mass at these velocities to give any significant spectral features for such large velocities at this relatively advanced epoch (at a similar epoch SN 1997ef had a low km s-1). The spectrum is therefore in the ‘transition’ phase between SN 1998bw-like and SN 1997ef-like. Clearly, some kind of new model is required. Since it is not clear how such a model should behave, we deal first with the next epoch, which can yield indications about the inner part of the ejecta, and then come back to the April 24 spectrum to verify the results.
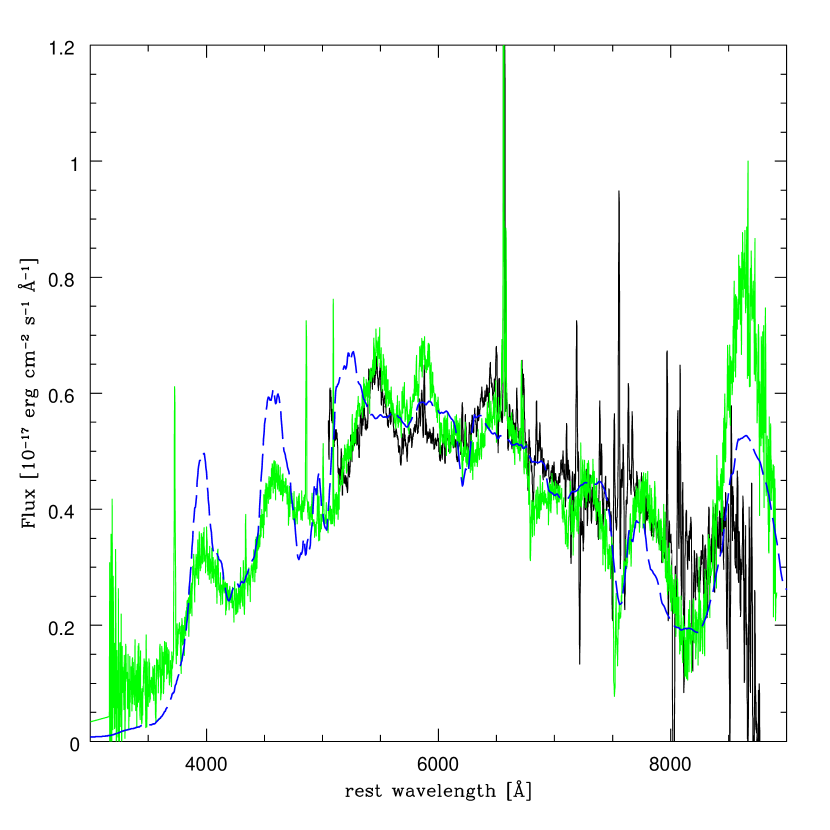
Our third spectrum was obtained with Subaru on 2003 May 10 (Kawabata et al. 2003), a rest-frame epoch days, and it resembles that of SN 1997ef at a comparable epoch. Indeed, model CO138E50 yields a narrow-lined spectrum, while a much better synthetic spectrum is obtained using model CO100E18. This model, in fact, turns over at km s-1, which is still below the photosphere at this epoch. However, model CO100E18 is too massive at the low velocities near the photosphere, resulting in strong backwarming and a high temperature. We tested different possibilities, and found that a model where the density of CO100E18 is divided by a factor of two throughout (CO100E18/2) gives a good fit using and km s-1 (Figure 2). The synthetic spectrum has , . At a comparable epoch the values for SN 1998bw were and km s-1, and those for SN 1997ef and km s-1. Therefore, it appears that while model CO138E50 is adequate for the high velocity part of the ejecta, a less energetic model such as CO100E18/2 is better suited for the low-velocity inner part. This might be expected given the shift in the properties of the spectrum.
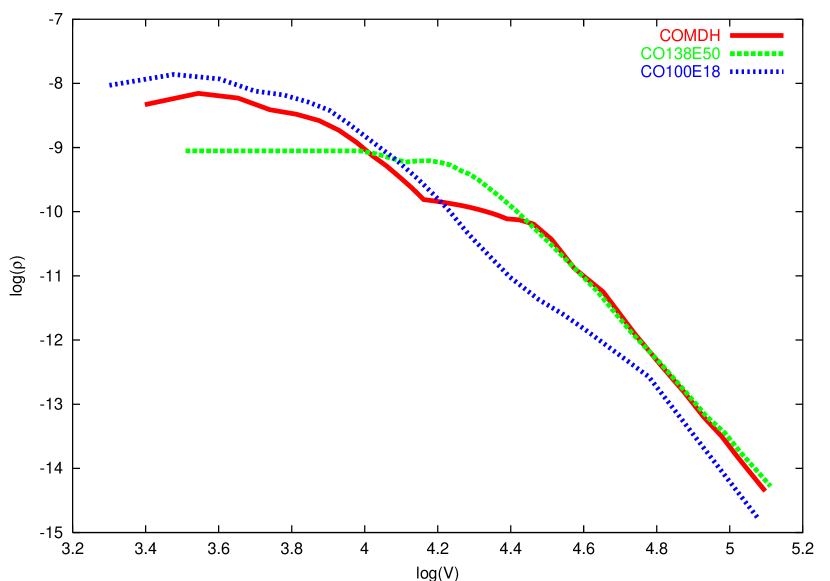
The question is how can those two models be merged into one. We have adopted here an empirical approach. Model CO138E50 can be modified below km s-1, since this is below the photosphere of the April 10 spectrum, while model CO100E18/2 can be modified at velocities high enough that the May 10 spectrum is not affected. We tried different boundaries for this, and finally chose km s-1. Therefore, we used model CO100E18/2 for km s-1, model CO138E50 for km s-1, and merged the two models linearly in between. The density structures of the various models are shown in Figure 4. With this new spherically symmetric ‘merged’ model (COMDH) the results for April 10 and May 10 are essentially unchanged. COMDH has a smaller ejected mass than both CO138E50 and CO100E18, , and erg, similar to CO138E50 as it is dominated by the high-velocity part. Since model COMDH is not computed from the hydrodynamics, but represents only a run of density vs. velocity, multi-dimensional calculations are necessary to see how well COMDH approximates a real multi-dimensional model.
The test for the merged model comes from fitting the April 24 spectrum, when the photosphere falls in the joining region. Using essentially the same parameters as discussed earlier ( and km s-1), we could obtain a reasonably good fit to the observed spectrum (Figure 3). The synthetic spectrum has , . Therefore, considering all uncertainties, our ‘merged’ model is probably a fair one-dimensional representation of the density structure of SN 2003dh.
3 A Two-Component Light Curve Model
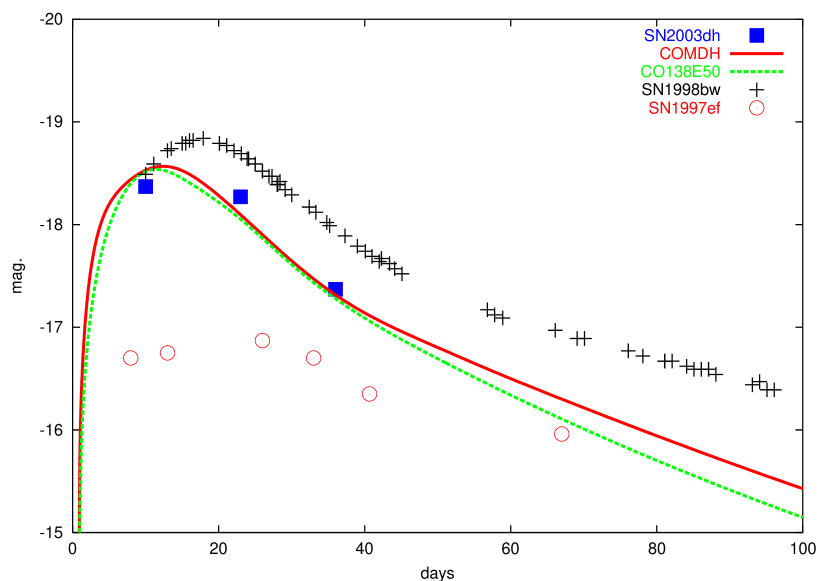
In order to verify that the model we have constructed to reproduce the spectra is indeed valid, it is necessary to compute a light curve with it. Here we can follow the same approach as in the two-component models of Maeda et al. (2003), as this is essentially the same problem. Since we do not know the exact light curve of SN 2003dh, we only tried to reproduce the three points derived from the spectral fitting. These suggest a more rapid rise, a dimmer peak and a faster decline than SN 1998bw, more similar to SN 2002ap.
We computed synthetic bolometric light curves for models CO138E50 and COMDH, using an LTE radiation transfer code and a gray -ray transfer code (Iwamoto et al. 2000). The optical opacity was found to be dominated by electron scattering.
The synthetic light curve of CO138E50 with homogeneous mixing of 56Ni out to 40,000 km s-1 is in reasonable agreement with the three points of SN 2003dh inferred from the spectra (Figure 5). The mass of 56Ni () is smaller than in the models for SN 1998bw (: Nakamura et al. 2001; Iwamoto et al. 1998) and the mixing more extensive. The model light curve of SN 2003dh rises faster and peaks earlier than SN 1998bw.
The synthetic light curve computed with the ‘merged’ model COMDH reproduces the three SN 2003dh points well for a 56Ni mass of 0.35. Homogeneous mixing of 56Ni out to 40,000 km s-1 was assumed, as for CO138E50. High velocity 56Ni is a feature that SN 2003dh shares with other hypernovae. It could be attributed to a jet-like asphericity in the explosion (Maeda et al. 2002; Maeda & Nomoto 2003; Woosley & Heger 2003).
The main feature of the ‘merged’ model COMDH is the presence of a high density region at low velocities, as derived from the spectral analysis. The effect of this region should be to slow down the decline of the late-time light curve. In SN 1998bw and other hypernovae this is indeed observed starting at days and becoming more prominent later (Sollerman et al. 2000; Nomoto et al. 2001; Nakamura et al. 2001; Maeda et al. 2003). Figure 5 confirms that the synthetic light curve of model COMDH becomes somewhat brighter than that of CO138E50 at advanced phases. Although the ‘merged’ model is favored because it gives reasonably good fits to both the light curve and the spectra, a definitive extraction of the light curve and further time coverage will be useful to distinguish between the models.
4 Discussion
We have shown through spectral models that SN 2003dh was a hypernova. The high ejecta velocities observed in the early spectra require for the outer layers an explosion model similar to that used for SN 1998bw. However, at lower velocities such a model becomes too flat, and it is necessary to replace it with a lower energy one such as CO100, which has a steeper at low velocities. From a spherically symmetric calculation, we obtain for SN 2003dh erg, , and (56Ni).
Woosley & Heger (2003) reached similar results. Their model parameters differ from ours somewhat, but they did not make detailed comparisons with observed data.
Our results suggest that SN 2003dh was intermediate between SNe 1997ef and 1998bw in release and 56Ni production, and that it ejected a comparable, possibly slightly smaller mass. Accounting for the compact remnant, the exploding star may have been a CO core of , which implies a main-sequence mass of . SN 2003dh seems to follow the relations between progenitor mass, (56Ni) and (Nomoto et al. 2003).
All spherically symmetric models (including CO100 and CO138) are very flat inside, and they all have an inner mass-cut defining a ‘hole’ in the density profile. Evidence for SNe 1997ef, 2002ap and now 2003dh is that such a flat density distribution does not lend itself to successful spectrum synthesis. Actually, synthetic spectra computed for SN 1998bw beyond the epochs published in Iwamoto et al. (1998) are also not perfect, so this may be a common feature. Evidence for a slow-moving, oxygen-dominated inner region in SN 2003dh, to be obtained from the nebular spectra would nicely confirm this picture.
The difficulties one-dimensional explosion models encounter in reproducing the time evolution of hypernovae are almost certainly due to the inadequacy of such models when applied to phenomena that are intrinsically aspherical. Approximate studies suggest that asymmetries in the explosions may affect the light curves (Höflich, Wheeler, & Wang 1999; Woosley & Heger 2003). Therefore, the estimate of the explosion parameters may be subject to errors. In particular, may be overestimated by factors of a few by neglecting the fact that the highest velocity material is only ejected in a narrow cone, as discussed by Maeda et al. (2003), and recently by Woosley & Heger (2003) starting from the collapsar model. Both papers point at a similar scenario. According to Woosley & Heger (2003), if the high velocity ejecta are contained in a cone with opening half-angle , is reduced by a factor , and M(56Ni) required to fit the peak luminosity is also reduced by a factor (in an extreme case). This is if is small. The value of (56Ni) can be derived from observations in the nebular phase, which is basically independent of geometry. At least for SN 1998bw, these confirmed that (56Ni) estimated in spherical symmetry was correct within a factor of 2 or less (Nakamura et al. 2001; Maeda et al. 2002). Early-time spectra are less likely to be affected than the light curve, especially in the case of SN 2003dh, where the high velocity material which dominates most spectral features is probably coming directly towards us. Nebular observations of SN 2003dh are urged.
References
- Bloom et al. (2002) Bloom, J. S., et al. 2002, ApJ, 572, L45
- Bloom et al. (2003) Bloom, J. S., et al. 2003, ApJ, in press (astro-ph/0308034)
- Della Valle et al. (2003) Della Valle, M., et al., 2003, A&A, 406, L33
- Garnavich et al. (2003) Garnavich, P.M., et al. 2003, ApJ, 582, 924
- Galama et al. (1998) Galama, T. J., et al. 1998, Nature, 395, 670
- Greiner et al. (2003) Greiner, J., et al. 2003, GCN Circ., 2020
- Hjorth et al. (2003) Hjorth, J., et al. 2003, Nature, 423, 847
- Höflich, Wheeler, & Wang (1999) Höflich, P., Wheeler, J. C. & Wang, L. 1999, ApJ, 521, 179
- Iwamoto et al. (1998) Iwamoto, K., et al. 1998, Nature, 395, 672
- Iwamoto et al. (2000) Iwamoto, K., et al. 2000, ApJ, 534, 660
- Kawabata et al. (2003) Kawabata, K.S., et al. 2003, ApJ, 593, L19
- Lucy (1999) Lucy, L.B., 1999, A&A, 345, 211
- Maeda et al. (2002) Maeda, K., Nakamura, T., Nomoto, K., Mazzali, P. A., Patat, F., & Hachisu, I. 2002, ApJ, 565, 405
- Maeda et al. (2003) Maeda, K., Mazzali, P.A., Deng, J., Nomoto, K., Yoshii, Y., Tomita, H., Kobayashi, Y. 2003, ApJ, 593, 931
- Maeda & Nomoto (2003) Maeda, K., & Nomoto, K. 2003, ApJ, 598, in press (astro-ph/0304172)
- Matheson et al. (2003) Matheson, T., et al., 2003, ApJ, in press (astro-ph/0307435)
- Mazzali & Lucy (1993) Mazzali, P.A., & Lucy, L.B. 1993, A&A, 279, 447
- Mazzali, Iwamoto, & Nomoto (2000) Mazzali, P.A., Iwamoto, K., & Nomoto, K. 2000, ApJ, 545, 407
- Mazzali (2000) Mazzali, P.A. 2000, A&A, 363, 705
- Mazzali et al. (2002) Mazzali, P.A., et al. 2002, ApJ, 572, L61
- Nakamura et al. (2001) Nakamura, T., Mazzali, P.A., Nomoto, K., Iwamoto, K. 2001, ApJ, 550, 991
- Nomoto et al. (2001) Nomoto, K., et al. 2001, in Supernovae and Gamma-Ray Bursts, eds. M. Livio, N. Panagia and K. Sahu (Cambridge: Cambridge Univ. Press), 144
- Nomoto et al. (2003) Nomoto, K., Maeda, K., Mazzali, P.A., Umeda, H., Deng, J., Iwamoto, K. 2003, in Stellar Collapse, ed. C.L. Fryer (Astrophysics and Space Science; Kluwer), in press (astro-ph/0308136)
- Patat et al. (2001) Patat, F., et al. 2001, ApJ, 555,900
- (25) Sollerman, J., Kozma, C., Fransson, C., Leibundgut, B., Lundqvist, P., Ryde, F., Woudt, P. 2000, ApJ, 537, L127
- Stanek et al. (2003) Stanek, K. Z., et al. 2003, ApJ, 591, L17
- Woosley & Heger (2003) Woosley, S.E., & Heger, A. 2003, ApJ, submitted (astro-ph/0309165)
| Model | / | (56Ni)aaValues required to reproduce the peak brightness of SN 2003dh. | |
|---|---|---|---|
| CO100E18bbMazzali et al. (2000). | 9.6 | 18 | 0.32 |
| CO138E50ccfootnotemark: | 10.4 | 50 | 0.32 |
| COMDH | 8.0 | 38 | 0.35 |