Chandra and XMM-Newton Observations of RDCS1252.9–2927,
A Massive Cluster at 11affiliation: Based in part on observations
obtained at the European Southern Observatory using the ESO Very
Large Telescope on Cerro Paranal (ESO program 166.A-0701).
Abstract
We present deep Chandra and XMM-Newton obervations of the galaxy cluster RDCS1252.9–2927, which was selected from the ROSAT Deep Cluster Survey (RDCS) and confirmed by extensive spectroscopy with the VLT at redshift . With the Chandra data, the X-ray emission from the intra-cluster medium is well resolved and traced out to 500 kpc, thus allowing a measurement of the physical properties of the gas with unprecedented accuracy at this redshift. We detect a clear 6.7 keV Iron K line in the Chandra spectrum providing a redshift within 1% of the spectroscopic one. By augmenting our spectroscopic analysis with the XMM-Newton data (MOS detectors only), we significantly narrow down the error bar to 10% for the temperature and 30% for the metallicity, with best fit values keV, . In the likely hypothesis of hydrostatic equilibrium, we measure a total mass of within kpc. Overall, these observations imply that RDCS1252.9–2927 is the most X-ray luminous and likely the most massive bona-fide cluster discovered to date at . When combined with current samples of distant clusters, these data lend further support to a mild evolution of the cluster scaling relations, as well the metallicity of the intra-cluster gas. Inspection of the cluster mass function in the current cosmological concordance model and shows that RDCS1252.9–2927 is an cluster at , in keeping with number density expectations in the RDCS survey volume.
To appear on the Astronomical Journal (Jan 2004)
1 INTRODUCTION
X-ray studies of galaxy clusters over the last decade have driven considerable observational progress in tracing the evolution of their global physical properties. Based on X-ray selected samples covering a wide redshift range, convincing evidence has emerged for modest evolution of both the space density of the bulk of X-ray clusters and their thermodynamical properties since (see Rosati et al. 2002 for a review). With the advent of Chandra and XMM-Newton , and their unprecedented sensitivity and angular resolution, these studies have been extended beyond redshift unity and, in low redshift clusters, have revealed the complexity of the thermodynamical structure of the Intra-Cluster Medium (ICM) (e.g. Fabian et al. 2003b). Specifically, deep Chandra observations of the handful of clusters known to date at (Stanford et al. 2001, 2002) have shown, for the first time at such large look-back times, the structure of the ICM at scales below 100 kpc and have allowed emission weighted temperatures to be measured. The new Chandra data have provided a crude determination of cluster scaling relations at large lookback times and a first study of their evolutionary trends (e.g. Holden et al. 2002, Vikhlinin et al. 2002, Ettori et al. 2003b). In more distant and complex systems, such as putative proto-clusters dominated by a powerful radio galaxy, Chandra deep pointings have only revealed non-thermal components in the diffuse plasma so far (Fabian et al. 2003a, Scharf et al. 2003). XMM-Newton observations of very distant clusters, although affected by source confusion in some circumstances, have the ability to collect a large number of photons, thus improving temperature determinations and allowing an estimate of the ICM metallicity (Hashimoto et al. 2002, Tozzi et al. 2003).
The discovery and the study of systems beyond redshift unity provides the strongest leverage for testing cluster formation scenarios. This, however, has been a challenging task with current X-ray searches due to the limited survey areas covered at faint fluxes. In this paper, we present Chandra and XMM-Newton observations of the fourth cluster at discovered in the ROSAT Deep Cluster Survey (RDCS, Rosati et al. 1998) at the very limit of the ROSAT sensitivity: RDCS1252.9–2927 which has been confirmed at with an extensive spectroscopic campaign carried out with the VLT. Chandra observations of the other three distant RDCS clusters, RDCS0910+5422 (), RDCS0848.9+4452 (), RDCS0848.6+4453 () were presented in Stanford et al. 2002, 2001. We describe the optical and near-infrared data for RDCS1252 elsewhere (Rosati et al. in preparation, Lidman et al. 2003), while we focus here on the X-ray observations carried out with Chandra , augmented with a partial XMM-Newton data set. We derive physical parameters of the ICM and measure gas metallicity from the clear presence of the iron K line in the X-ray spectrum. We also derive the total mass of the cluster with a 16% accuracy by resolving the gas profile with the Chandra data and by combining Chandra and XMM-Newton spectra to improve the temperature determination. Our analysis takes advantage of the complementarity between the XMM and Chandra data sets: the superb angular resolution of Chandra is used to study morphological features of the ICM and to flag point sources contaminating the cluster emission, while the XMM data are used to boost the signal-to-noise of the diffuse component thus improving its spectral analysis. Overall, these data imply that RDCS1252.9–2927 is the most X-ray luminous and likely the most massive bona-fide cluster discovered to date at .
are adopted throughout this paper.
2 OBSERVATIONS AND X-RAY DATA REDUCTION
2.1 Discovery of RDCS1252.9–2927
RDCS1252.9–2927 (hereafter RDCS1252 for brevity) was selected as an extended X-ray source (with a significance of ) in the RDCS, which used a wavelet-based algorithm to detect and characterize X-ray sources in 180 ROSAT/PSPC archival fields down to (0.5-2 keV) (Rosati et al. 1998). The source was found in the field with ROSAT ID WP300093 (exposure time ksec) at an off-axis angle of 13.9′ with 31 net counts, corresponding to a flux of in the 0.5-2 keV band. At fluxes , the RDCS covers an effective area of 5 deg2 and has maximum sensitivity for clusters at 111 We note that observations suggest , in the 0.5-2 keV band (Rosati et al. 2002).. As a result, the four RDCS clusters at , with , were found in the faintest flux bin (Rosati et al. 1999, Stanford et al. 02). A 30 minute -band image obtained at the CTIO 4-m telescope with the Prime Focus camera in February 1997, revealed only a faint () galaxy pair very close to the X-ray centroid position. As part of a program to follow-up faint RDCS cluster candidates in the near-IR, and band imaging was obtained with the SOFI camera at the NTT in November 1998, which showed a clear overdensity of red galaxies with , typical of early type galaxies at (see Lidman et al. 2003). RDCS1252 has more recently been the core of a VLT Large Programme which included optical imaging with FORS2, deep near IR imaging with ISAAC (Lidman et al. 2003) and extensive spectroscopy with FORS2. Results from this program are described elsewhere; to date 36 cluster members have been confirmed with a median redshift of and a velocity dispersion km/s.
2.2 Chandra data
RDCS1252 was observed with the Chandra ACIS–I detector in VFAINT mode in two exposures of 26 ks (Obs ID 4403) and 163 ks (Obs ID 4198). The data were reduced using the the CIAO software V2.3 (see http://cxc.harvard.edu/ciao/) starting from the level 1 event file. We used the tool acis_process_events with the vfaint=yes option to flag and remove bad X-ray events which are mostly due to cosmic rays. Such a procedure reduces the ACIS particle background significantly compared to the standard grade selection222see http://asc.harvard.edu/cal/Links/Acis/acis/Cal_prods/vfbkgrnd/, whereas source X-ray photons are practically unaffected (only of them are rejected, independently of the energy band, provided there is no pileup). We also applied the correction to the charge transfer inefficiency to partially recover the original spectral resolution of ACIS–I. The data were filtered to include only the standard event grades 0, 2, 3, 4 and 6. We removed hot columns via visual inspection. We searched for flickering pixels (defined as those with more than two events contiguous in time, where a single time interval was set to 3.3 s), however most of them are already removed by the filtering of bad events for exposures taken in VFAINT mode. We then applied a 3– clipping filtering of time intervals with high background levels using the script analyze_ltcrv, part of the CIAO distribution. The total effective exposure time is 188 ks after the application of this reduction procedure.
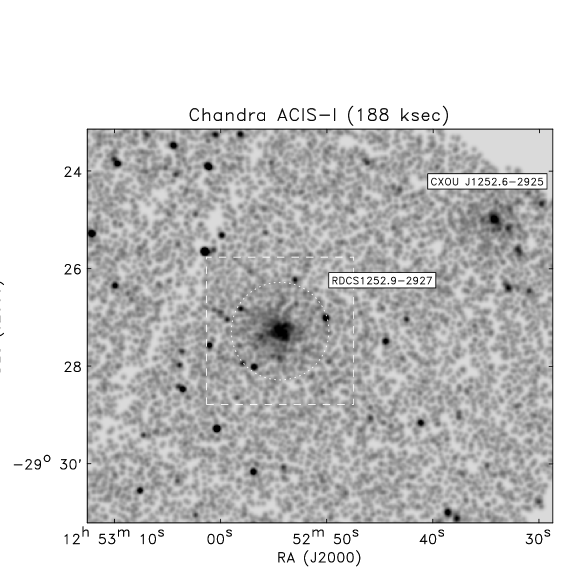
In Fig. 1, we show part of the ACIS-I field. The diffuse X-ray emission from the cluster is detected with a high signal-to-noise (S/N peaks to within a radius of 35″), and can be traced out to ( above the background). The Chandra image (see bottom left of Fig. 1) immediately shows that point sources do not significantly contaminate the cluster emission, as it is sometimes the case (e.g. Stanford et al. 01). In most cases, sources close to the cluster core in projected distance have been found to be foreground or background AGN. In the RDCS1252 field we have only a few identifications of point sources to date (8 within a area), of which only one is at the cluster redshift (Fig. 1).
We performed the spectral analysis in two circular regions (35″ and 59″ radii) around the centroid of the photon distribution after masking out point sources. In these apertures we detected approximately 850 and 1220 net counts in the 0.3–10 keV band. The background is obtained from a large annulus around the cluster position, after subtraction of point sources. The background photon file is scaled to the source file by the ratio of the geometrical area. We checked that variations of the background intensity across the chip do not affect the background subtraction, by comparing the count rate in the source and in the background at energies larger than 8 keV, where the signal from the source is null. The response matrices and the ancillary response matrices were computed for each exposure with the tool acisspec applied to the extraction regions. We applied the script apply_acisabs by Chartas and Getman to take into account the degradation in the ACIS QE due to material accumulated on the ACIS optical blocking filter since launch333See http://cxc.harvard.edu/ciao/threads/apply_acisabs/. We manually decreased the effective area below 1.8 keV by 7% to homogenize the low–energy calibrations of ACIS–S3 and ACIS–I (see Markevitch & Vikhlinin 2001).
2.3 XMM-Newton data
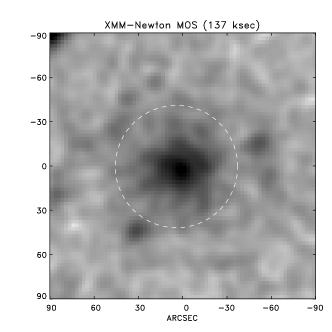
The XMM–Newton observations were carried out in two epochs, on January 1 and 11 2003, for a total of ksec, using the European Photon Imaging Camera (EPIC) PN and MOS detectors (observation Id 0057740301/401). The PN data were negatively affected by one of the CCD gaps which fell on the outskirt of RDCS1252, making it difficult to extract regions for a merged MOS+PN spectroscopic analysis. After experimenting with different apertures, masking and background subtraction techniques, we decided to use the MOS1MOS2 only for this analysis to avoid systematics which are at present not fully understood. Nonetheless, as shown below, data from the two MOS detectors significantly improved the signal-to-noise of the extracted spectra when combined with the Chandra data. We used the XMM Standard Analysis System (SAS) routines (SASv5.4.1) to obtain calibrated event files for the MOS1, MOS2 cameras. Time intervals in which the background was increased by soft proton flares were excluded by rejecting all events whenever the count rate exceeded 20 cts/100s in the 10–12 keV band for each of the two MOS cameras. The final effective exposure time amounts to 137 ks for the two MOS detectors. The spectrum was extracted from an aperture of 42″ radius (see Fig. 1), which avoids all point sources clearly visible in the Chandra image. In this aperture, we measured 2110 MOS1MOS2 net counts in the 0.5-8 keV band used for spectral fitting (1410 net counts in 0.5-2 keV band). Comparison of the Chandra and XMM-Newton images shows the well known complementarity of the two observatories: XMM-Newton has lower sensitivity to point sources and is prone to confusion, however its large collecting area yields high count rates on extended sources, much needed for spectroscopic analysis. Chandra allows ICM morphology and profiles to be studied even at these large redshifts, by separating the diffuse component from faint field sources.
3 RESULTS
3.1 Spectral analysis
The spectra are analyzed with XSPEC v11.2.0 (Arnaud 1996) and fitted with a single temperature MEKAL model (Kaastra 1992; Liedahl et al. 1995), where the ratio between the elements are fixed to the solar value as in Anders & Grevesse (1989). These values for the solar metallicity have recently been superseded by the new values of Grevesse & Sauval (1998), who used a 0.676 times lower Fe solar abundance. However, we prefer to report metallicities in units of the Anders & Grevesse abundances since most of the literature still refers to these old values. Since our metallicity depends only on the Fe abundance, updated metallicities can be obtained simply by rescaling by 1/0.676 the values reported in Table 1. We model the Galactic absorption with the tool tbabs (see Wilms, Allen & McCray 2000).
The fits are performed over the energy range 0.6–8 keV. We exclude photons with energy below 0.6 keV in order to avoid systematic biases in the temperature determination due to uncertainties in the ACIS calibration at low energies. We used three free parameters in our spectral fits: temperature, metallicity and normalization. We freeze the local absorption to the Galactic neutral hydrogen column density cm-2, as obtained from radio data (Dickey & Lockman 1990), and the redshift to , as measured from the optical spectroscopy. Spectral fits are performed using the Cash statistics (as implemented in XSPEC) of source plus background photons, which is preferable for low signal–to–noise spectra. We also performed the same fits with the statistics (with a standard binning with a minimum of 20 photons per energy channel in the source plus background spectrum) and verified that our best–fit model always gives a reduced . All quoted errors below correspond to , or 68% confidence level for one interesting parameter.
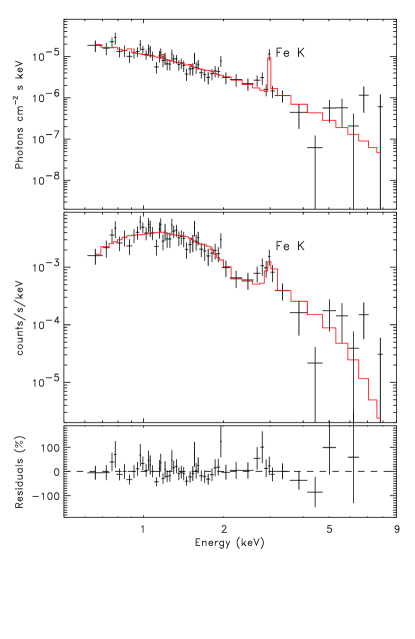
The Chandra folded and unfolded spectra of RDCS1252 are shown in Fig. 2 for the larger aperture. A prominent Fe K is visible at keV, which represents the first clear detection of an iron line from an ICM at . Using only Chandra data, the fit to the spectrum in the inner 35″ radius gives a best fit temperature of keV, and a best fit metallicity of . Our Fe K-line diagnostic is simpler and more robust than that based on the line–rich region around 1 keV, where the line emission is dominated by the L–shell transition of Fe, and the K–shell transitions of O, Mg, and Si. As a consistency check, if we leave free the Galactic absorption, we obtain a best fit value of cm-2, with an upper limit of cm-2 at , thus consistent with the Galactic value of cm-2. In this case, the best fit temperature is consistent (within ) with the aforementioned best fit value. Interestingly, leaving the redshift free, a four parameter fit yields , which shows how accurately the redshift can be determined from the X-ray data alone due to the high signal-to-noise detection of the Fe line.
It is useful to repeat the analysis using the larger aperture to test systematic effects in the background subtraction. The fit to the spectrum extracted from the 59″ aperture gives a temperature somewhat lower, keV, and a metallicity of . The difference between the temperature measurement in the two apertures is not significant enough to be attributed to a temperature gradient. We also measured temperatures in two independent radial bins () and could find only weak evidence () of a temperature drop outward. The best fit redshift in this case is still consistent within with the spectroscopic redshift: . The spectral analysis of the Chandra data also yields a flux within the 59″ aperture of in the 0.5-2 keV band, in good agreement with the ROSAT value. This corresponds to a luminosity of in the rest frame 0.5-2 keV band, and a bolometric luminosity of . One can use the best fit -model of the surface brightness profile described below to extrapolate these luminosities at larger radii. For example, values need to be multiplied by a factor 1.3 to encircle the flux within Mpc (or 2′).
Using the XMM-Newton data from the MOS detectors only, we extracted a spectrum in the energy range 0.5-8 keV (containing 2110 counts as opposed to 800 in the Chandra spectrum) and verified that the best fit temperature and metallicity are consistent, within , with the Chandra mesurements above. The XMM/MOS spectrum is shown in Fig. 3. To enhance the photon statistics, we performed a combined fit of the Chandra spectrum extracted from the 59″ region, and the two MOS spectra from the 137 ksec XMM-Newton observations. Thus, we obtain a best fit temperature keV, and a best fit metallicity . If we leave the redshift free, we obtain a best fit value of , i.e. within 1% of the spectroscopic redshift.
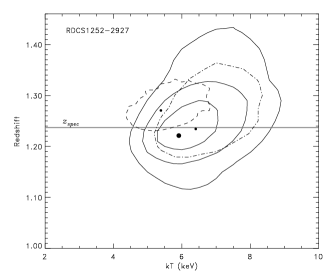
In Fig. 4, we show confidence contours in the , planes relative to the spectral fits discussed above. The combined Chandra and XMM-Newton analysis yields a temperature accuracy of 10%, which is unprecedented at these redshifts. We defer the analysis of extended and point sources from the full XMM-Newton data set, combined with Chandra and HST-ACS observations of the field (Blakeslee et al. 2003), to another paper (Mainieri et al. in preparation).
For completeness, we briefly report on the serendipitous group CXJ1252.6–2924 located at (J2000), 2.5′ NW of RDCS1252 (see Fig. 1). Extracting a spectrum from the Chandra data with an aperture of 30″ radius, we detect several low ionization metal lines. The best fit MEKAL model yields: keV, , and a redshift . In this aperture, we measure 320 net counts, a flux of in the 0.5-2 keV band, corresponding to , and . Inspection of our CTIO I band image shows a galaxy group dominated by a luminous elliptical galaxy at the X-ray centroid.
3.2 Mass determination
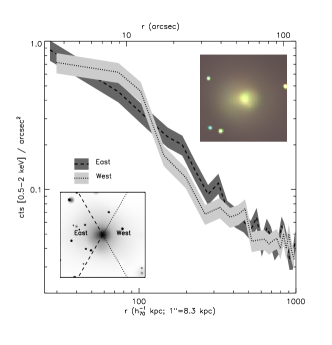
The angular resolution provided by Chandra and the detection of the X-ray emission out to 1′ (i.e. 0.5 Mpc) radius allows an accurate modeling of the gas profile of RDCS1252. This information, assuming hydrostatic equilibrium and isothermality of the gas, leads to a robust estimate of the total mass. The surface brightness profile is obtained from the exposure-corrected image by fixing the number counts per bin to 50 and is fitted with an isothermal model (Cavaliere & Fusco-Femiano 1976) providing a core radius of kpc (or 9.5″ ) and (see Fig. 5 and Ettori et al. 2003b for details). The model provides a reasonably good fit to the profile (, with 156 degree of freedom), which does not require any further component (e.g. a double model) from a statistical point of view. We recover the gas density and total gravitating mass profile using analytic formula associated with the model: and , where , is the mean molecular weight in atomic mass unit (), is the gravitational constant, is the proton mass; the central density, , is obtained from the combination of the best-fit results from the spectral and imaging analyses as described in Ettori, Tozzi & Rosati (2003a). The errors are obtained from the distribution of the values after 1 000 Monte-Carlo simulations. We measure masses within the radius encompassing a fixed density contrast, in an Einstein-de Sitter universe, with respect to the critical density, , i.e. . At kpc, corresponding to an overdensity of 457 at the cluster redshift (or in an Einstein-de Sitter universe), we measure and . These values are associated with the Chandra temperature measurement, keV. If we take the best fit temperature of 6.0 keV from the combined Chandra and XMM-Newton analysis, the total mass scales up accordingly and the error bar decreases: . In order to estimate the cluster virial mass, we can extrapolate our mass measurement to larger radii using a typical Navarro, Frenk & White profile with concentration . This yields . We also find a gas mass fraction , consistent with other measurements in distant clusters (e.g. Ettori et al. 2003a).
4 DISCUSSION AND CONCLUSIONS
Taking advantage of the complementarity between Chandra and XMM-Newton observations, we have measured physical properties of RDCS1252 at with unprecedented accuracy at these redshifts. The Chandra data allow the gas profile to be traced and modeled out to kpc, free of confusion from field sources, and therefore enables the mass to be accurately derived. By augmenting our spectroscopic analysis with the XMM-Newton data (MOS detectors only), we narrowed down the error bar to 10% for the temperature and 30% for the metallicity. In Table 1, we report a summary of the main physical properties of RDCS1252 measured from the X-ray data.
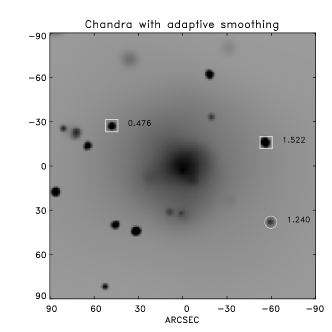
In Fig. 6, we show a color composite image of the field with overlaid Chandra contours. The color image combines deep near-infrared imaging with ISAAC and optical imaging with FORS at the VLT, with limiting AB magnitude of (Lidman et al. 2003, Rosati et al. in preparation). Cluster early type galaxies stand out as red objects which cluster strongly toward the centroid of the X-ray emission. The two central galaxies, which are 2″ apart with Vega magnitudes , lie near the peak of the X-ray emission. The overall distribution of cluster galaxies, well mapped by our spectroscopic and photometric redshifts, appear flattened along the E-W direction (Toft et al. in prep.). A close inspection of the Chandra data reveals an interesting feature in the X-ray surface brightness distribution of RDCS1252. In Fig. 5, the surface brightness profile azimuthally averaged in two separate sectors shows a discontinuity on the west side, at (or 125 kpc). This could be the origin of the relatively low value (0.53) obtained by the King profile fit. A relatively sharp edge on the west side is visible in the raw Chandra image (Fig. 1), and is apparent in the adaptively smoothed X-ray color image (see upper right inset of Fig. 5), which is the composite of the three energy bands [0.5-1], [1-2], [2-7] keV. A close inspection of this image reveals a comet-like shape of the X-ray emission in the cluster core, a feature resembling the remarkable shock front discovered in the cluster 1E0657–56 at (Markevitch et al. 2002), which is the result of a merging process of a cluster subclump. However, the relatively low photon statistics of the Chandra data prevent us from further speculating on the physical nature of this feature in RDCS1252. No major subclumps are visible in the distribution of the cluster galaxies, however we note the coincidence between the mild E-W asymetry of the gas and the E-W elongation of the cluster members. This could be the result of the infall of cluster galaxies along a major filament associated with a cold-front morphology of the gas due to the merger of a sub-clump just exiting the cluster core along the E-W direction.
The physical properties of RDCS1252, as derived from the Chandra data, help to constrain the high redshift end of cluster scaling relations and study their evolution. For example the , relations, the entropy and metallicity of the ICM as function of redshift. We refer to the analysis of Ettori et al. (2003b), which used a sample of 26 clusters at , also including RDCS1252. We note here that the values of and of RDCS1252 are consistent with the local relation measured by Markevitch (1998), and when combined with all the other data available on distant clusters in the Chandra archive, suggest only a mild positive evolution of the relation (see discussion in Ettori et al. 2003b and references therein). Our best fit value of the metallicity, , lends further support to a lack of evolution of the ICM mean metallicity measured out to (see analysis by Tozzi et al. (2003), which did not include RDCS1252).
Overall, our analysis implies that RDCS1252 is the most X-ray luminous and likely the most massive bona-fide cluster discovered to date at . Despite the large look-back times probed by these observations, RDCS1252 appears already well thermalized, with thermodynamical properties, as well as metallicity, very similar to those of clusters of the same mass at low redshift. This is consistent with a scenario in which the major episode of metal enrichment and gas preheating by supernova explosions occurred at .
X-ray selected cluster surveys in the ROSAT era have led to routine identification of clusters out to , with only a few examples at higher redshifts (Rosati et al. 1999, Ebeling et al. 2001, Stanford et al. 2002, Rosati et al. 2002). Although the redshift boundary for X-ray clusters has receded to recently, a census of clusters at has just begun and the search for clusters at remains a serious observational challenge. Extrapolating the RDCS yield to XMM-Newton or Chandra based serendipitous surveys now underway (e.g. Romer et al. 2001, Boschin 2002), one expects clusters as luminous as RDCS1252 in a 50 deg2 area. An inspection of the underlying cluster mass function at (e.g. Borgani et al. 2001), for our adopted cosmology and , shows that RDCS1252, with , could well represent a typical cluster at these redshifts. Moreover, we note that the presence of such a cluster in the RDCS survey volume (see Fig.5 in Rosati et al. 2002) is in agreement with predictions based on the current cosmological concordance model (e.g. Bennett et al. 2003). Specifically, for the assumed cosmology and , we expect to find one cluster as massive as RDCS1252 or more in at .
Using high- radio galaxies as signposts for proto-clusters has been the only viable method so far to break this redshift barrier and push it out to (e.g., Venemans et al. 2002, Kurk et al. 2003). If there is an evolutionary link between these strong galaxy overdensities around distant radio galaxies and the X-ray clusters at , viable evolutionary tracks should be found linking the galaxy populations in these systems, using their spectrophotometric and morphological properties. Recent follow-up Chandra observations of high redshift radio galaxies have revealed the presence of diffuse X-ray emission, in addition to a central point source (3C294 at : Fabian et al. 2003a; 4C41.17 at : Scharf et al. 2003). However, their spectral energy distribution and other energetic arguments indicate that the extended emission is likely non-thermal, and due instead to inverse Compton scattering of the CMB photons by a population of relativistic electrons associated with the radio source activity. The serendipitous detection of thermal ICM at associated with clusters remains extremely difficult, not only for the lack of volume in current X-ray surveys, but also for the severe surface brightness dimming which affects X-ray observations. These limitations will eventually be overcome by surveys exploiting the Sunyaev–Zeldovich (SZ) effect (e.g. Carlstrom et al. 2002), which will explore large volumes at . It is worth noting, however, that the current sensitivity of SZ observations is still not sufficient to detect any of the known X-ray clusters at , all having , such as RDCS1252. The current generation of large area optical surveys (e.g. using the -band; Gladders & Yee 2000) remain a valid alternative to unveil a sizeble number of clusters at , while the next generation of large area surveys in the near-IR (e.g. Warren 2002) will push this boundary even further. Without a correspondingly large area X-ray survey, however, our ability to glean physical properties necessary to test structure formation scenarious, as well deriving cosmological parameters, will be rather limited.
References
- (1) Anders, E., Grevesse, N. 1989, Geochimica et Cosmochimica Acta, 53, 197
- (2) Arnaud, K.A. 1996, “Astronomical Data Analysis Software and Systems V”, eds. Jacoby G. and Barnes J., ASP Conf. Series vol. 101, 17
- (3) Bennet, C.L. et al. 2003, ApJ, in press
- (4) Blakeslee, J.P., et al. 2003, ApJ, in press
- (5) Borgani, S., Rosati, P. Tozzi, P., Stanford, S.A., Eisenhardt, P.E., Lidman, C., Holden, B., Della Ceca, R., Norman, C., Squires G. 2001, ApJ, 561, 13
- (6) Boschin, W. 2002, A&A, 396, 397
- (7) Carlstrom, J.E. 2002, ARA&A, 40,
- (8) Cavaliere, A., & Fusco Femiano, R. 1976. A&A, 49, 137
- (9) Dickey & Lockman, 1990, ARA&A, 28, 215.
- (10) Ebeling, H., Jones, L.R., Fairley, B.W., Perlman, E., Scharf, C., Horner, D. 2001, ApJ, 548, L23
- (11) Ettori, S., Tozzi, P., & Rosati, P. 2003a, A&A, 398, 879
- (12) Ettori, S., Tozzi, P., Borgani, S., & Rosati, P. 2003b, A&A, submitted
- (13) Fabian, A.C., Sanders, J.S., Crawford, C.S., Ettori, S. 2003a, MNRAS,341, 729
- (14) Fabian, A.C., Sanders, J.S., Allen, S.W., Crawford, C.S., Iwasawa, K., Johnstone, R.M., Schmidt, R.W., Taylor, G.B. 2003b, MNRAS, in press
- (15) Gladders, M.D., & Yee, H.K.C. 2000, AJ, 120, 2148
- (16) Grevesse, N., & Sauval, A.J. 1998, Space Science Reviews, 85, 161
- (17) Hashimoto, Y., Hasinger, G., Arnaud, M., Rosati, P., Miyaji, T. 2002, A&A, 381, 841
- (18) Holden, B.P., Stanford, S.A., Squires, G.K., Rosati, P., Tozzi, P., Eisenhardt, P., & Spinrad, H. 2002, AJ, 124, 33
- (19) Huo, Z., Xue, S., Xu, H., Squires, G., & Rosati, P. 2003, submitted
- (20) Kaastra, J.S. 1992, “An X–ray Spectral Code for Optically Thin Plasmas” (Internal SRON–Leiden Report, updated v2.0)
- (21) Lidman, C., Rosati, P., Demarco, R., Nonino, M., Mainieri, V. Stanford, S.A., & Toft, S. 2003, A&A, in press
- (22) Kurk, J.D., Pentericci, L., Röttgering, H.J.A., Miley, G.K. 2003, MNRAS, in press
- (23) Liedhal, D.A., Osterheld, A.L., Goldstein, W.H. 1995, ApJ, 438, L115
- (24) Markevitch, M. 1998, ApJ, 504, 27
- (25) Markevitch, M., & Vikhlinin, A. 2001, ApJ, 563, 95
- (26) Markevitch, M., Gonzales, A.H., David, L., Vikhlinin, A., Murray, S., Forman, W., Jones, C.,& Tucker, W. 2002, ApJ, 567, L27
- (27) Romer, K., Viana, P., Liddle, A.R., Mann, R.G. 2001, ApJ, 547, 594
- (28) Rosati, P., Della Ceca, R., Burg, R., Norman, C., Giacconi, R. 1998, ApJ, 492, L21
- (29) Rosati, P, Stanford, S.A., Eisenhardt, P.R., Elston, R., Spinrad, H., et al. 1999. AJ, 118
- (30) Rosati, P., Borgani, S., & Norman, C. 2002, ARA&A, 40, 539
- (31) Stanford, S.A., Holden, B.P., Rosati, P., Tozzi, P., Borgani, S., Eisenhardt, P.R., & Spinrad, H. 2001, ApJ, 552, 504
- (32) Stanford, S.A., Holden, B.P., Rosati, P., Eisenhardt, P.R., Stern, D., Squires, G., & Spinrad, H. 2002, AJ, 123, 619
- (33) Tozzi P., Rosati, P., Ettori S., Borgani, S., Mainieri V., & Norman, C. 2003, ApJ, in press
- (34) Scharf, C.A., Smail, I., Ivison, R., Bower, R.G., van Breugel, W., Reuland, M. 2003, ApJ, in press
- (35) Venemans, B.P., Kurk, J.D., Miley, G.K., Röttgering, H.J.A., van Breugel, W. et al. 2002, ApJ, 569, L11
- (36) Vikhlinin, A., VanSpeybroek, L., Markevitch, M., Forman, W.R., & Grego, L. 2002, ApJL, 578, 107
- (37) Warren, S.J. 2002, “Survey and Other Telescope Technologies and Discoveries”, SPIE Conference series (astro-ph/0210231)
- (38) Wilms, J., Allen, A., & McCray, R. 2000, ApJ, 542, 914
| RA Dec | aaLuminosity within an aperture of 60″ (or 500 kpc) | aaLuminosity within an aperture of 60″ (or 500 kpc) | bbFrom combined Chandra and XMM-Newton spectral analysis | bbFrom combined Chandra and XMM-Newton spectral analysis | ||
|---|---|---|---|---|---|---|
| J2000 | keV | |||||


See attached jpeg figure