A Model For the Formation of High Density Clumps in Proto-Planetary Nebulae
Abstract
The detection of NaCl at large radii in the Egg Nebula, CRL 2688, requires densities of – in a thick shell of . To explain these results, a mechanism is needed for producing high densities at a considerable distance from the central star. In two dimensional simulations of the interaction of the fast wind with an ambient medium, the material becomes thermally unstable. The resulting clumps can achieve the requisite conditions for NaCl excitation. We present 2D models with simple physics as proof-of-principle calculations to show that the clumping behavior is robust. Clumping is a natural outcome of cooling in the colliding wind model and comparable to that inferred from observations.
1 OBSERVATIONAL MOTIVATION
Mass loss from Asymptotic Giant Branch (AGB) stars is a major avenue by which heavy elements enter the interstellar medium (Kwok, 2000). In addition to the initial phase of mass loss on the AGB, a second episode is thought to occur in the post-AGB stage which is characterized by high velocity winds that collide with the remnant envelope. This wind-wind interaction is thought to generate drastic departures from spherical symmetry in the remnant shell (i.e. bi-polar), as well as very hot gas, as traced by vibrationally-excited lines of (Sahai et al., 1998a; Cox et al., 2000; Herpin et al., 2002).
Recently, Highberger et al. (2003) detected NaCl and NaCN in the post-AGB star CRL 2688 in an optically thin extended shell of radius – (a few at kpc). This result is surprising, as it corresponds to a much larger physical radius than is observed in the AGB star IRC+10216 (Guélin, Lucas, & Neri, 1997). The NaCl lines in CRL 2688 do not show the high-velocity tails characteristic of post-AGB mass ejection. Instead, the cusp-shaped line profiles of NaCl, observed with the IRAM 30m telescope, indicate an extended, shell-like distribution for NaCl coincident with the low velocity AGB remnant wind. A similar interpretation holds for NaCN. The observed transitions of NaCl and NaCN in CRL 2688 require densities of to for to be excited. These values are inconsistent with an undisturbed AGB remnant wind (Highberger et al., 2003).
We propose that clumping of material near the interface between the slow AGB wind and the fast post-AGB wind can reach the requisite densities for excitation of the observed transitions of NaCl and NaCN. This clumping is driven by a thermal instability arising in a hydrodynamic shock. In this letter we present two dimensional proof-of-principle calculations which show that the clumping process occurs and is robust for conservative estimates of proto-planetary nebula (PPN) conditions, and that the clumping can produce the requisite densities.
2 THEORY OF CLUMPING
Modeling of the interaction of winds in post-AGB stars and PPN by using one-dimensional spherically symmetric shocks precludes inclusion of physics relevant to the morphology and conditions in the interaction region. In particular, the assumption of spherical symmetry prevents material from fragmenting into small clumps which can have significantly enhanced density and a more radially extended distribution than a simple shock.
The inclusion of radiative cooling in the gas physics gives the possibility of a thermal instability. In this scenario, the clumps are pressure-confined. Cooling is usually non-linear with density (i.e., following Osterbrock (1989), for free-free emission or collisionally excited line radiation). Small density anisotropies amplified by a shock or shock precursor cool much more efficiently than the surrounding medium and are no longer in pressure equilibrium.
The size of the clumps is set approximately where the sound travel timescale is commensurate with the cooling timescale. Density variations across larger scales will not have time to be smoothed out before the cooling-driven instability sets in.
3 MODELS OF CLUMPING
3.1 Physical Assumptions
The simulations were produced with a version of the PROMETHEUS PPM hydrodynamics code optimized for stellar wind/CSM interactions (Mueller, Fryxell, & Arnett, 1991; Martin & Arnett, 1995). All calculations were performed in two dimensions on a spherical grid. A grid was used for testing different cooling curves and CSM and wind conditions. The calculations for the most reasonable combination of parameters were repeated with and grids.
The equation of state is the ideal gas law with ionization from electron collisions and the ambient radiation field and with recombination. Two sets of cooling curves were used. Both sets include free-free emission from Osterbrock (1989) and high temperature cooling from Kafatos (1973). The second set of curves has additional cooling for collisionally excited line radiation and fine structure recombination lines (Osterbrock, 1989) and rotational transitions of CO (Hollenbach & McKee, 1979). The collisionally excited line radiation and fine structure line curves are simple analytic functions which were designed to have the qualitatively correct functional form, and are normalized to the peak values of the curves in Osterbrock (1989). No attempt was made to reproduce the detailed physics of the cooling, merely to reproduce the correct order of magnitude values. The results are largely insensitive to the form of the cooling curve, so long as cooling is present, so we did not attempt to improve our curves. In some circumstances there is a numerical instability in PPM codes related to cooling (Sutherland et al., 2003), however examination of our resolved simulations indicates we are not in this regime.
Since these simulations were motivated by the detection of NaCl in CRL 2688, we will briefly review the physical conditions in this object. Conditions in the circumstellar envelope have been determined from rotational line studies of CO. The inner “superwind” corresponds to a mass loss rate of (Young et al., 1992) and a velocity of (Herpin et al., 2002). The surrounding circumstellar material (CSM), produced by AGB mass loss, has , , and (Herpin et al., 2002). Shock zones form in the region where the fast wind interacts with the surrounding material. Emission from CO and has been seen in this shocked region, located – from the central star and distributed in a clover-leaf shaped distribution (Sahai et al., 1998a; Cox et al., 1997, 2000). In the optical and IR CRL 2688 shows a distinct bipolar morphology like many other PPN and PN (e.g. Sahai et al., 1998a).
We chose to use a somewhat more conservative (with regard to the clumping instability) set of conditions for the CSM and fast wind. For the CSM we used and . The CSM was given an enhanced equatorial density that increases with polar angle as and a maximum enhancement in the density of 50% (Martin & Arnett, 1995; Press et al., 1995). (This geometry was chosen since a large fraction of PN and CRL 2688 in particular are bipolar in shape, but the results turn out to be relatively insensitive to asymmetries at this level .) For the inner fast wind we used a mass loss history produced by the stellar evolution code TYCHO (Young et al., 2001, 2003). The median values produced by this mass loss history were and a differential velocity between the components of . Because of the short timescales in question, these values were approximately constant over the duration of the simulation. Higher densities (or mass loss rates) in either component tend to promote clumping. The degree of clumping was relatively insensitive to the difference in velocity of the components up to , though the radius of onset of clumping was larger since the expansion timescale was reduced relative to the cooling timescale. Above the temperatures in the shock exceeded K, which is higher than the observed vibrational temperature of the shocked gas in CRL 2688. (From their measurements of , Cox et al. (1997) find .) The inner boundary of the simulation was set at .
A few further caveats must be kept in mind. First, the simulations are two dimensional. This means that collapse into clumps is constrained to two dimensions; in the third the material forms annuli around the axis of symmetry. In a real system the material can collapse in three dimensions, resulting in larger density enhancements, more efficient fingering (since material is being displaced along a small-cross section plume rather than an entire annulus), and a more complex morphology. (Fingering here refers to the common behavior of finger-like protrusions developing at an unstable interface.) Secondly, the wind and CSM are plasmas, so they can and probably do support magnetic fields, the effects of which are considerably more difficult to predict a priori. Third, the morphology of a real proto-planetary nebula is considerably more complex than the smoothly varying distribution examined here. The presence of molecular outflows, jets, multiple AGB wind components and large scale density perturbations will change the distribution and morphology of clumps. In fact, multiple molecular outflows have been observed in CRL 2688 (Cox et al., 2000).
3.2 Results
We find that for the conditions described in section 3.1, the highest density in the simulation increases at the beginning of the simulation as the shock establishes itself, then decreases for a time before reaching a minimum as cooling takes over from spherical divergence as the primary process controlling the density evolution. The density thereafter increases in the clumps until the shock front moves off the grid.
The maximum densities and the radii at which they are achieved emphasize the importance of grid resolution to this simulation. As discussed in §2, the physical size of the clumps should be quite small. The size of the clumps, and correspondingly their maximum density, is limited by the grid in the low and medium resolution simulations. The ratio of maximum densities achieved in two underresolved simulations scale as the square of the increase in radial resolution between the simulations. The onset of clumping occurs much earlier for higher resolution, as well. This scaling no longer holds between the medium and high resolution simulations. The maximum densities and radius of onset of clumping do not differ by more than 10% at any point, indicating that the medium resolution simulation is slightly under-resolved or barely resolved and the high resolution over-resolved.
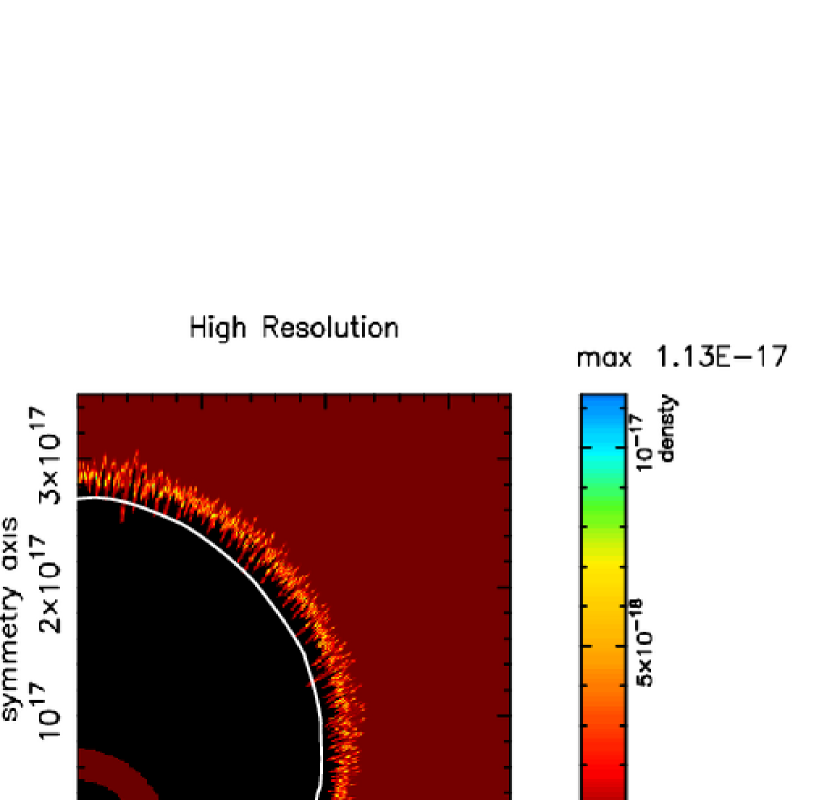
In the medium resolution simulations, a maximum density of occurs at , and clumping is already developing. The density drops to at and returns to near its peak value by at the end of the simulation. In the high resolution simulation, a local maximum density of is reached at . The following minimum of occurs at and density rises to by the end of the simulation, at which point it is still increasing.
In both cases the timescale for the full development of clumping is a few hundred years, which is approximately the timescale for the interaction of the fast wind with the CSM in CRL 2688 according to observations (Sahai et al., 1998a). If we define clumps as a plateau of locally maximum density in the simulation, the physical sizes at range around , with masses of approximately . (The resolution of the grid at this radius is .) The density falls off to near the ambient over a similar distance. The clumps also have long “tails” at lower density due to the fingering of the instability. Figure 1 shows the fully developed clumping in the high resolution simulation. The white line shows the position of the shock.
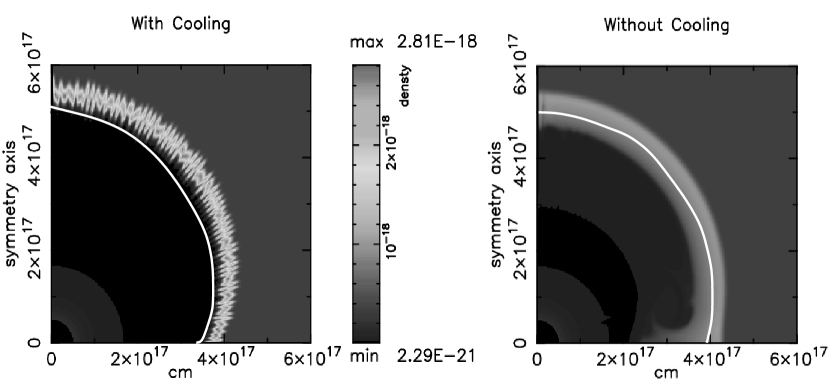
In order to ensure the size of the clumps is not a numerical artifact, we ran simulations with 1% random gaussian density fluctuations or a sinusoidal 10% density perturbation with an angular frequency of . These perturbations should overwhelm roundoff error at cell boundaries as seeds for the instability and start fingering on much larger scales if the natural physical scale of the clumps is larger than the grid size. No difference is seen in clump sizes with and without the perturbations. To confirm that the clumping is driven by a thermal instability, we performed a control simulation with no cooling. Figure 2 compares simulations with and without cooling. Without cooling no instability develops, even at large radii. (The vortex at the bottom of the no cooling case is a result of an interaction between the boundary conditions and the equatorial density enhancement and does not appear in spherically symmetric simulations.) Both panels are on the same density scale. The inner radius of the onset of clumping is a more difficult problem. It can potentially be varied widely simply by assuming different geometries for the circumstellar medium and conditions in the CSM and fast wind at the beginning of the PPN phase. The clumps themselves, once formed, have a lifetime long compared to the simulations, and may well move out to significantly larger distances. At larger radii, even if the clumps are present, their covering factor will be sufficiently small that beam dilution from a single dish will make them once again unobservable. We must be careful in interpreting the extent of the clumps from observations. Their true distribution may be larger. We have demonstrated that the clumping can happen, but other physics besides that of clump formation may determine the observed scale.
The densities reached in the high resolution simulations exceed the densities needed for excitation of the transition of NaCl ( at 50 K), but are a factor of several short of what is needed for higher transitions. This is not problematic, and perhaps even desirable, for two main reasons. First, the conditions in the CSM and fast wind are conservative. Higher mass loss rates translate to increased clumping. Second, the simulation is only in 2D, which only allows fragmentation and compression of the clumps along two axes. Were these annuli allowed to fragment in the third dimension the densities would be enhanced further.
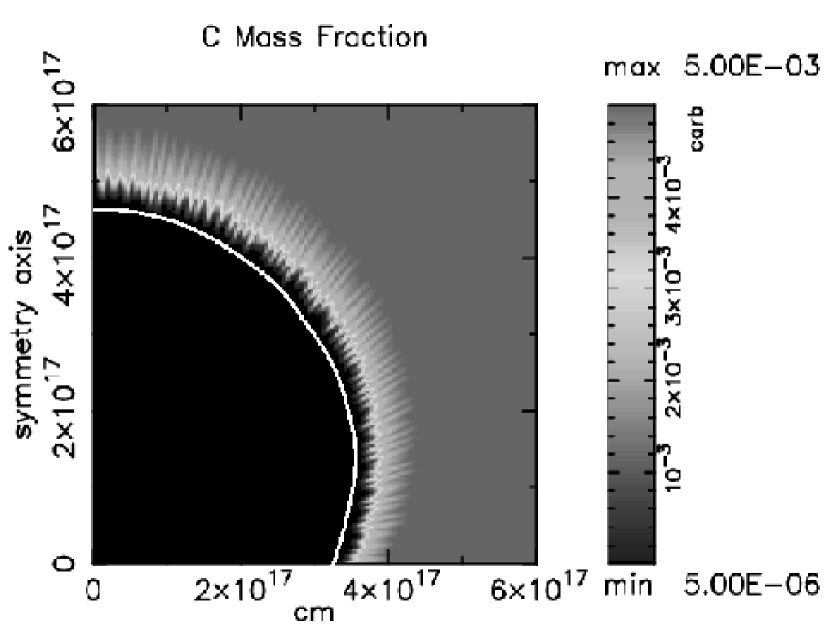
The structure of the shock is also worthy of note. The main shock (characterized by a change in the sign of from expansion to compression and a temperature of ) is interior to the clumping. The main shock is preceded by a hydrodynamic precursor. The C abundance of the fast wind was set to a factor of lower than that of the CSM to provide a tracer of the Lagrangian motion of the material. Figure 3 shows the C abundance for the low resolution simulation at the same timestep as the density plot. The C poor material has clearly moved ahead of the main shock and shows a fingering pattern identical to that seen in the density. Other mechanisms for the precursor are ruled out independently. The code does not contain the physics for a magnetic or cosmic ray precursor, and the temperatures in the shock are too low to produce a photoionization precursor. It is interesting to note that the measured radii of the NaCl and NaCN emission and the shock front as measured by are – and –, respectively (Highberger et al., 2003; Sahai et al., 1998a; Cox et al., 1997). This difference seems to indicate that the high densities occur outside the strong shock, as we see in these simulations.
4 DISCUSSION
New molecular observations of NaCl and NaCN in the proto-planetary nebula CRL 2688 imply extreme densities in a shell at large radii from the central star. We investigate the behavior of a thermally unstable shock produced by a fast superwind impacting CSM from previous stages of mass loss with a two dimensional hydrodynamics code. When even simple cooling is included, the hydrodynamics initiates a thermal instability in a shock precursor which leads to the formation of high density clumps. These clumps can achieve the requisite densities at large radii from the star. The clumping mechanism is robust, occurring even for conservative estimates of PPN conditions.
Observations in the optical/IR may offer insight into this model. The clump sizes we see in simulations are similar to those observed for cometary globules in the Helix Nebula (O’Dell & Handron, 1996). This does not necessarily imply that the clumps which we posit for PPN are the precursors of PN clumps. However, the composition and the cooling curves should be nearly the same for both cases. If the cometary globules are the product of a thermal/hydrodynamic instability, which is plausible but not certain (Huggins et al., 2002), then their characteristic size should be similar to what we predict for clumps in our simulations.
Ideally we would like to identify the structures in CRL 2688 associated with the molecular emission. The most likely scenario is that the sodium molecules are associated with material traced by vibrationally-excited , which exhibits a clumpy, clover-leaf-shaped distribution (Cox et al., 2000). The emission suggests that this is shocked gas from a wind-wind interaction. It is from this region that we take our initial conditions. The inferred shock temperatures are consistent with our model, and the geometries can be accommodated by assuming a more structured CSM and fast wind. Our models indicate that the clumping behavior is robust for the physical conditions associated with the shock. The simulations indicate that the Na molecule emission should be in a precursor to the shock. Just outside the is the most likely location for the NaCl and NaCN emission if the clumping mechanism is indeed responsible for creating the requisite conditions for excitation. This agrees very well with the observational evidence available for the location of the Na molecules. The measured radii of the NaCl and NaCN emission and the are – and –, respectively (Highberger et al., 2003; Sahai et al., 1998a; Cox et al., 1997)
References
- Cox et al. (1997) Cox, P., Maillard, J.-P., Huggins, P. J., Forveille, T., Simons, D., Guilloteau, S., Rigaut, F., Bachiller, R., & Omont, A. 1997, A&A, 321, 907
- Cox et al. (2000) Cox, P., Lucas, R., Huggins, P. J., Forveille, T., Bachiller, R., Guilloteau, S., Maillard, J.-P., & Omont, A. 2000, A&A, 353, L25
- Fong et al. (2003) Fong, D., Meixner, M., & Shah, R. Y. 2003, ApJ, 582, L39
- Guélin, Lucas, & Neri (1997) Guélin, M., Lucas, R., & Neri, R. 1997 in CO: Twenty-five Years of Millimeter Wave Spectroscopy eds. W. B. Latter et al. (Dordrecht: Kluwer), 359
- Herpin et al. (2002) Herpin, F., Goicoechea, J. R., Pardo, J. R., & Cernicharo, J. 2002, ApJ, 577, 961
- Highberger et al. (2003) Highberger, J. L., Thomson, K. J., Young, P. A., Arnett, D., & Ziurys, L. M. 2003, ApJ, 593, 393
- Hollenbach & McKee (1979) Hollenbach, D. & McKee, C. F. 1979, ApJS, 41, 555
- Huggins et al. (2002) Huggins, P. J., Forveille, T., Bachiller, R., Cox, P., Ageorges, N., & Walsh, J. R. 2002, ApJ, 573, L55
- Kafatos (1973) Kafatos, M. 1973, ApJ, 182, 433
- Kwok (2000) Kwok, S. 2000 in The Origin and Evolution of Planetary Nebulae (Cambridge: Cambridge University Press)
- Martin & Arnett (1995) Martin, C. L. & Arnett, D. 1995, ApJ, 447, 378
- Mueller, Fryxell, & Arnett (1991) Mueller, E., Fryxell, B., & Arnett, D. 1991, A&A, 251, 505
- Press et al. (1995) Press, W. H., Teukolsky, S. A., Vetterling, W. T., & Flannery, B. P. 1995 Numerical Recipes in C (New York: Cambridge University Press), 28ff.
- O’Dell & Handron (1996) O’Dell, C. R. & Handron, K. D. 1996, AJ, 111, 1630
- Osterbrock (1989) Osterbrock, D. E. 1989 Astrophysics of Gaseous Nebulae and Active Galactic Nuclei (Sausalito: University Science Books), 53ff.
- Sahai et al. (1998a) Sahai, R., Hines, D. C., Kastner, J. H., Weintraub, D. A., Trauger, J. T., Rieke, M. J., Thompson, R. I., & Schneider, G. 1998a, ApJ, 492, L163
- Sahai et al. (1998b) Sahai, R. et al. 1998b, ApJ, 493, 301
- Sutherland et al. (2003) Sutherland, R. S., Bisset, D. K., & Bicknell, G. V. 2003, ApJS, 147, 187
- Young et al. (2003) Young, P. A., Knierman, K. A., Rigby, J. R., & Arnett, D. 2003, ApJ, in press
- Young et al. (2001) Young, P. A., Mamajek, E. E., Arnett, D., & Liebert, J. 2001, ApJ, 556, 230
- Young et al. (1992) Young, K., Serabyn, G., Phillips, T. G., Knapp, G. R., Guesten, R., & Schulz, A. 1992, ApJ, 385, 265