11email: serote@oal.ul.pt, adarbon@oal.ul.pt 22institutetext: European Southern Observatory, Karl-Schwarzschild-Strasse 2, D-85748 Garching bei München, Germany
22email: adarbon@eso.org
The Nuclear Region of
Low Luminosity Flat Radio Spectrum Sources††thanks: Based on
observations collected at the Multiple Mirror Telescope
on Mt. Hopkins.
In this work we have examined the spectroscopic properties of a sample of 19 optically bright, low luminosity Flat Radio Spectrum (LL FRS) sources. Our study focuses on the properties of their host galaxies, namely the nuclear stellar populations and dust content. In the optical — spectral region covered by our data — the objects in the sample are mainly dominated by the host galaxy starlight, which strongly dilutes the non-thermal continuum as well as possible emission-line features related to the active nucleus. We have computed the nuclear stellar populations contributing to the spectra of the objects in our sample. The stellar population synthesis has been performed by using a very reliable mathematical method, which yields a Global Principal Geometrical solution. Our results show that, for most of the objects in the sample, the populations are composed of old stars of solar metallicity, or lower; the populations are mainly composed of late-type stars, i.e. G, K and M spectral types, the young component coming thus from supergiant stars; the dust content is weak. Both the stellar populations and the dust content are in agreement with what is usually observed in “normal” elliptical galaxies. Similar stellar content has equally been found in the nuclear regions of galaxies hosting a Low Ionization Nuclear Emission Line Region, or LINER.
The present work is important in illustrating the different applications of stellar population synthesis in the study of low luminosity radio sources. In fact, the synthesis allows us not only to obtain valuable information about the stellar populations and dust content of the host galaxies, therefore providing material for further studies on the connection between host galaxy and active nucleus, but also to reveal the so-far unstudied optical emission-line features present in the spectrum of our objects.
Key Words.:
galaxies: active – galaxies: nuclei – galaxies: stellar content – galaxies: general1 Introduction
BL Lacertae objects (BL Lacs), together with Flat Spectrum Radio Quasars (FSRQs) are called blazars. Blazars display some of the most extreme behaviour observed in Active Galactic Nuclei (AGN), such as high and variable optical polarization; they also show a strong and rapid variability at radio, optical and X-ray wavelengths. BL Lacs usually have weak or non-observed optical emission lines.
Blazars exhibit characteristics indicative of relativistic beaming (Padovani & Urry 1990), which occurs when the relativistic emission (a jet) is oriented close to the observer’s line of sight (Blandford & Rees 1978). The extreme properties of blazars are generally interpreted as a consequence of non-thermal emission from the relativistic jet. A transition population between beamed BL Lacs and unbeamed radio-galaxies has not been detected (Rector et al. 1999); yet, a transition population of “low luminosity BL Lacs” (LL BLLs) was predicted to exist in abundance in samples like the one studied by Browne & Marchã (1993).
In the past few years there has been a growing interest in LL BLLs and other flat radio spectrum sources. Because they are relatively close to us, their host galaxies can be studied more easily. The knowledge of their host galaxies is of the utmost importance, not only as a test of the unification schemes, but also as a way to better understand the relationship between nuclear activity and host galaxy. BL Lac host galaxies seem to be luminous ellipticals, often in loose groups; in fact, from a morphological point of view, BL Lac host galaxies seem to be absolutely normal ellipticals (Urry et al. 2000; Falomo & Ulrich 2000). HST observations by Verdoes Kleijn et al. (1999) suggest that, apart from the presence of dust and gas distributions, the nuclei of FR I radio-galaxies also resemble those of normal bright ellipticals. While there are some studies concerning the host galaxy morphology, little is, however, known about the nuclear stellar populations of Low Luminosity Flat Radio Spectrum (LL FRS) sources.
In an effort to better understand such objects and their host galaxies, we undertook the study of the optical properties of a sample of low luminosity, core-dominated radio sources expected to contain a high fraction of objects observed at small angles to the line-of-sight. This sample is known to contain several weak emission line galaxies, which could be objects related to BL Lac phenomena, but observed at larger angles from the line-of-sight; it is also possible that some of the galaxies are “hidden” BL Lacs, whose nuclear emission is completely swamped by the host galaxy starlight (Dennett-Thorpe & Marchã 2000).
With this study, we had two main purposes:
(i) studying the nuclear stellar populations of low luminosity, flat radio spectrum nuclei such as LL BLLs;
(ii) to search for the clear optical signature of the underlying activity.
To do this, we must rely on the computation of the nuclear stellar populations with subsequent subtraction of their contribution to the total nuclear spectra. Our stellar synthesis is not done by using templates of normal nearby galaxies to estimate the stellar populations. In fact, we take the spectra of our objects to compute the stellar populations; in this way, the information on the stars that compose our galaxies is taken directly from the data, without any a priori assumption on the nature of the stellar populations.
In Sect. 2 we describe the sample from which we have selected the objects discussed in this paper; we present our own sub-sample, as well as the criteria behind its selection. Section 3 briefly describes the observational data analyzed in the paper. In Sect. 4 we introduce the stellar population synthesis method; we also describe how it has been applied to the data, presenting the results obtained for each galaxy. In Sect. 5 we summarize our results and conclusions.
2 The sample
Being interested in studying the optical properties of LL FRS sources, we undertook the analysis of a set of such objects taken from the sample discussed in Marchã et al. (1996). This sample presents objects with a redshift up to 0.1. Since it only contains nearby objects, the host galaxies are therefore easy to study.
| ID | Name | (J2000) | (J2000) | (%) | (%) | |||
|---|---|---|---|---|---|---|---|---|
| 0035+227 | MG3 J0038082303 | 00 38 08.1 | 23 03 28.4 | 0.097 | 0.44 | 0.57 | 0.81 | 0.84 |
| 0055+300 | NGC 315 | 00 57 48.9 | 30 21 08.8 | 0.017 | 0.50 | 0.56 | 0.18 | – |
| 0116+319 | 4C 31.04 | 01 19 35.0 | 32 10 50.0 | 0.060 | 0.46 | 0.56 | 0.22 | 1.15 |
| 0149+710 | RX J0153.37115 | 01 53 25.8 | 71 15 06.5 | 0.023 | 0.32 | 0.46 | 2.67 | 3.31 |
| 0651+410 | Zw 20427 | 06 55 10.0 | 41 00 10.1 | 0.022 | 0.47 | 0.55 | 0.43 | 0.47 |
| 0729+562 | TXS 0729562 | 07 33 28.6 | 56 05 41.7 | 0.107 | 0.43 | 0.61 | 1.02 | 1.11 |
| 0733+597 | RX J0737.45941 | 07 37 30.1 | 59 41 03.2 | 0.041 | 0.43 | 0.58 | 0.62 | 0.70 |
| 0848+686 | CGCG 332026 | 08 53 18.9 | 68 28 19.0 | 0.041 | 0.46 | 0.54 | 2.54 | 0.74 |
| 0902+468 | TXS 0902+468 | 09 06 15.5 | 46 36 19.0 | 0.085 | 0.48 | 0.54 | 0.99 | 1.20 |
| 1144+352 | RX J1147.33500 | 11 47 22.1 | 35 01 07.5 | 0.064 | 0.43 | 0.51 | 0.44 | 0.63 |
| 1146+596 | NGC 3894 | 11 48 50.4 | 59 24 56.4 | 0.011 | 0.50 | 0.56 | 0.31 | 0.36 |
| 1241+735 | 8C 1241735 | 12 43 11.2 | 73 15 59.3 | 0.075 | 0.43 | 0.49 | 8.02 | 0.75 |
| 1245+676 | PGC 043179 | 12 47 33.3 | 67 23 16.5 | 0.107 | 0.50 | 0.56 | 1.02 | 1.31 |
| 1558+595 | PGC 056566 | 15 59 01.7 | 59 24 21.8 | 0.060 | 0.56 | 0.57 | 1.06 | 0.78 |
| 1658+302 | PGC 059420 | 17 00 45.2 | 30 08 12.9 | 0.036 | 0.45 | 0.54 | 1.97 | 0.80 |
| 1703+223 | 87GB 170321.7221932 | 17 05 29.3 | 22 16 07.6 | 0.050 | 0.45 | 0.53 | – | 0.43 |
| 1755+626 | NGC 6521 | 17 55 48.4 | 62 36 44.1 | 0.028 | 0.53 | 0.59 | 1.62 | 0.41 |
| 2202+363 | 87GB 220211.3361757 | 22 04 21.1 | 36 32 37.1 | 0.075 | 0.48 | 0.55 | 1.26 | 0.52 |
| 2320+203 | RX J2323.32035 | 23 23 20.3 | 20 35 23.5 | 0.039 | 0.41 | 0.53 | 1.41 | – |
Marchã’s et al. original sample contains 57 optically bright ( 17), nearby ( 0.2), radio sources; these were selected on the basis of the spectral slope ( 0.5 between 1.4 and 5 GHz) and are all located north of 20°, being off the galactic plane by at least 12°. The sample has a flux density limit of 200 mJy at 5 GHz.
The main purposes of such a sample were:
(i) to find LL BLLs with radio luminosities comparable to X-ray selected BL Lacs (most of which we now refer to as “high frequency peak” BL Lacs);
(ii) to investigate the differences between BL Lacs and other flat spectrum radio sources.
Spectroscopy of these objects yielded a high fraction of BL Lacs ( 35%) and a relatively high number ( 20%) of sources with strong emission lines. The remainder of the sample is composed of objects with hybrid properties (i.e. objects showing simultaneously BL Lac properties, such as high and variable polarization, and broad emission lines, usually associated with the spectra of quasars) and by galaxies which do not show any conspicuous signs of activity, the main contribution to the their optical spectra being of stellar origin.
In this paper we focus our attention on the latter. These galaxies, although radio selected together with confirmed BL Lacs and objects displaying a “Seyfert-type” emission spectrum, following exactly the same criteria, are optically very different from them, showing no strong emission lines (as Seyferts do), nor a flat continuum and no emission or absorption features (as usually observed in BL Lacs). This persuaded us that there should be more to these sources than meets the eye.
Among the galaxies in Marchã’s sample which displayed such characteristics, we have selected 19 objects according to the following criteria:
(i) the dilution of the absorption features due to the power-law continuum must be small enough so that information can be inferred from the lines. We took the 4000 Å break contrast = 0.3111The 4000 Å break contrast is defined as , where and are the fluxes measured redward and blueward of the break, respectively. Several tests with our population synthesis method have shown that for lower values of the stellar populations cannot be determined. as our lowest possible limit.
(ii) the signal to noise ratio must be high enough so that the continuum can be traced and the absorption features used.
Table 1 gives the list of the 19 galaxies selected for this study; for the sake of consistency, we have kept the same nomenclature as in Marchã et al. (1996).
3 Observational data
The data consist of optical spectra ( 3500–8700 Å and 3500–7400 Å) obtained at the Multiple Mirror Telescope on Mt. Hopkins. The spectra were acquired through a 15 slit, oriented along the parallactic angle, and have a spectral resolution of 20 Å (FWHM); they have been flux-callibrated using the spectrophotometric standards observed on each night. All spectra were reduced according to the standard procedure using IRAF and ESO/MIDAS packages. Further observational and reduction aspects are discussed in detail in Marchã et al. (1996).
The spectra have been corrected for the interstellar reddening using the Howarth (1983) Galactic reddening law; the values of for each galaxy were calculated using the maps of dust IR emission from Schlegel et al. (1998). A correction to the broadening of the lines due to velocity dispersion is not necessary, since our spectral resolution is low.
| Line Identification | Wavelength Interval | Line Identification | Wavelength Interval | ||
|---|---|---|---|---|---|
| FeI,NiI,CrI | 3570 | 3543-3598 | FeI,TiO | 5653 | 5630-5676 |
| FeI,NiI,CaI,TiI | 3630 | 3598-3661 | FeI,NaI | 5700 | 5676-5725 |
| FeI,CrI,TiI,NiI | 3677 | 3661-3693 | FeI,TiO | 5775 | 5725-5825 |
| FeI,CaII,TiI,TiII,NiI,CN | 3736 | 3693-3780 | FeI,TiO,CaI | 5850 | 5825-5874 |
| H10,CN L band | 3794 | 3780-3808 | NaI | 5894 | 5874-5914 |
| H9,CN L band,FeI,MgI,HeI | 3835 | 3808-3862 | FeI,Ti,MnI | 5972 | 5914-6029 |
| H8,CN L band,FeI,SiI,HeI | 3885 | 3862-3908 | FeI,CaI | 6070 | 6029-6110 |
| CaIIK | 3930 | 3908-3952 | FeI | 6129 | 6110-6148 |
| CaIIH,H | 3970 | 3952-3988 | TiO,CaI | 6178 | 6148-6208 |
| FeI,HeI | 4004 | 3988-4020 | TiO,FeI | 6266 | 6208-6325 |
| FeI,HeI | 4037 | 4020-4054 | FeI,CaH,TiO | 6350 | 6325-6374 |
| FeI,SrII | 4068 | 4054-4082 | FeI,CaI | 6428 | 6374-6481 |
| H | 4100 | 4082-4118 | CaI,TiO | 6508 | 6481-6535 |
| FeI | 4138 | 4118-4159 | H,TiO | 6558 | 6535-6582 |
| CN | 4186 | 4159-4214 | FeI,TiO | 6602 | 6582-6622 |
| CaI | 4229 | 4214-4244 | TiO | 6636 | 6622-6651 |
| FeI,CrI | 4260 | 4244-4277 | TiO,FeI | 6670 | 6651-6690 |
| CH G band,FeI,CrI | 4298 | 4277-4318 | TiO,FeI,CaI | 6726 | 6690-6761 |
| H,FeI,FeII | 4341 | 4318-4364 | FeI,MgII | 6778 | 6761-6795 |
| FeI,C2,FeII,TiII | 4392 | 4364-4420 | TiO,CaH | 6811 | 6795-6827 |
| FeI,CaI,TiO,MgII,HeI | 4446 | 4420-4472 | FeI,SiI | 7008 | 6969-7048 |
| CH,CN | 4489 | 4472-4506 | TiO | 7063 | 7048-7078 |
| FeI,FeII,TiII | 4537 | 4506-4568 | TiO,NiI,FeI | 7109 | 7078-7140 |
| FeI,FeII,TiO,TiII,CN,CaI | 4595 | 4568-4622 | TiO,VO | 7359 | 7341-7377 |
| FeI,TiO,C2 | 4655 | 4622-4688 | FeI,VO | 7406 | 7377-7434 |
| FeI,MgI,TiI,HeI,NiI,C2 | 4714 | 4688-4741 | FeI,VO | 7458 | 7434-7482 |
| FeI,MgH,NiI,MnI,TiO | 4772 | 4741-4802 | FeI,VO | 7511 | 7482-7540 |
| TiO,MgH,CN,MnI | 4818 | 4802-4835 | TiO,OI | 7780 | 7737-7823 |
| H,TiO,FeI | 4856 | 4835-4876 | TiO,CN,VO | 7855 | 7823-7888 |
| FeI | 4886 | 4876-4897 | VO,CN,FeI,SiI | 7929 | 7888-7970 |
| FeI,FeII,CN,HeI | 4922 | 4897-4946 | FeI,CN | 8015 | 7970-8060 |
| FeI,TiO,TiI | 4972 | 4946-4998 | TiO,FeI | 8432 | 8411-8453 |
| FeI,FeII,TiO,CN,HeI,TiI | 5028 | 4998-5058 | TiO,FeI | 8472 | 8453-8490 |
| FeI | 5107 | 5058-5156 | CaII | 8498 | 8490-8508 |
| FeI,MgI+MgH | 5198 | 5156-5240 | FeI,VO,TiI | 8518 | 8508-8527 |
| FeI | 5274 | 5240-5308 | CaII | 8542 | 8527-8557 |
| FeI | 5336 | 5308-5356 | FeI,VO,TiO | 8601 | 8557-8645 |
| FeI | 5388 | 5356-5421 | CaII | 8662 | 8645-8677 |
| FeI,TiO,MgI | 5488 | 5421-5554 | FeI,MgI | 8723 | 8677-8768 |
| CaI,FeI,TiO | 5592 | 5554-5630 | FeI,MgI | 8812 | 8768-8855 |
4 Stellar population synthesis
The main purpose of a stellar population synthesis is to gather information on the stellar content of the galaxies under study; our synthesis also provides an evaluation of the dust content, the internal reddening being a parameter taken into account for the calculations.
In addition to these pieces of information, the stellar synthesis also allow us to remove the starlight contribution from the data and consequently to unveil the optical emission-line features present in the spectra. Even though a few weak emission lines could be previously detected in some of the galaxies in our sample, their optical to near-UV spectra are clearly dominated by the stellar continuum. In fact, the fraction of starlight in such objects is so important that it almost completely swamps any strong emission feature associated with the active nucleus.
The method used to compute the nuclear stellar populations and its application to our sub-sample of objects are described below.
4.1 The method
We have used a synthetic population algorithm developed by Pelat (1997). This algorithm uses a new mathematical method which gives a unique solution (Global Principal Geometrical solution, or GPG), contrary to the other methods widely used for population synthesis. It uses the equivalent widths (EW) of all the absorption features found in the spectra. Essentially, it considers a galaxy as being made up of a set of stars with different spectral types, luminosities and metallicities. This particular composition will carry its own signature in terms of the EW of the absorption lines; it then defines the composition by matching this signature as closely as possible to the observed EW, using the least squares method. The internal reddening is also a free parameter given by the method in an indirect way.
The accuracy of the fit is estimated by a parameter, the distance, which is defined as the sum, for all absorption features, of the difference between the observed EW and the synthetic EW calculated through the combination of the different stars that compose the stellar populations obtained. This value depends on the number of absorption features used and the smaller this distance, the better the fit. In addition, residuals estimated over the continuum help us to verify the accuracy of the solution found. The theoretical aspects of the method are described in Pelat (1997). This method was already applied to the synthesis of nuclear stellar populations in AGN and proved to give very good results (Serote Roos 1996; Serote Roos et al. 1998; Boisson et al. 2000).
The stars used for the synthesis were compiled from the Silva & Cornell (1992) library. These authors have made available 72 stellar types with a large coverage in spectral types, luminosity classes and metallicities. The library wavelengths range from 3500 Å to 9000 Å, thus covering quite well the spectral range of our data. Their resolution being 11 Å, we have convolved the stars in the library with a Gaussian with = 7.1, in order to match the resolution of our spectra (20 Å). The stellar library has been chosen in order to cover the space temperature/gravity as much as possible without being degenerate. In fact, we cannot include as many stellar types as we would like to, in order to prevent stellar library degeneracy, i.e. having two different stellar types with spectral energy distributions similar enough to be indistinguishable in a mathematical sense. Some super metal rich stars (SMR) have also been included. In total, the stellar library used contains 30 stars.
We have identified and measured the EW of all absorption features ( 80) present in the spectra, as well as the values of the continuum for each feature. Identification of the absorption lines and bands, together with the wavelength ranges used to measure the EW of the features, can be found in Table 2.
| Library | 0035 | 0055 | 0116 | 0149 | 0651 | 0729 | 0733 | 0848 | 0902 | 1144 | 1146 | 1241 | 1245 | 1558 | 1658 | 1703 | 1755 | 2202 | 2320 |
|---|---|---|---|---|---|---|---|---|---|---|---|---|---|---|---|---|---|---|---|
| Stars | +227 | +300 | +319 | +710 | +410 | +562 | +597 | +686 | +468 | +352 | +596 | +735 | +676 | +595 | +302 | +223 | +626 | +363 | +203 |
| O5V | 0 | 0 | 0 | 0 | 0 | 0 | 0 | 0 | 0 | 0 | 0 | 0 | 0 | 0 | 0 | 0 | 0 | 0 | 0 |
| B3-4V | 0 | 0 | 0 | 0 | 0 | 0 | 0 | 0 | 0 | 0 | 0 | 0 | 0 | 0 | 0 | 0 | 0 | 0 | 0 |
| A1-3V | 0 | 0 | 0 | 0 | 0 | 0 | 0 | 0 | 0 | 0 | 0 | 0 | 0 | 0 | 0 | 0 | 0 | 0 | 0 |
| A8V | 0 | 0 | 0 | 0 | 0 | 0 | 0 | 0 | 0 | 0 | 0 | 0 | 0 | 0 | 0 | 0 | 0 | 0 | 0 |
| F8-9V | 0 | 0 | 0 | 0 | 0 | 0 | 0 | 0 | 0 | 0 | 0 | 0 | 0 | 0 | 0 | 0 | 0 | 0 | 0 |
| G9K0V | 28 | 63 | 0 | 29 | 49 | 0 | 24 | 100 | 87 | 0 | 0 | 0 | 0 | 0 | 6 | 0 | 17 | 0 | 82 |
| K5V | 0 | 0 | 0 | 0 | 0 | 0 | 0 | 0 | 0 | 0 | 0 | 0 | 0 | 0 | 0 | 0 | 0 | 0 | 0 |
| M2V | 2 | 7 | 0 | 11 | 0 | 5 | 2 | 0 | 0 | 5 | 2 | 9 | 16 | 4 | 6 | 7 | 4 | 3 | 8 |
| r F8V | 0 | 0 | 0 | 0 | 0 | 0 | 0 | 0 | 0 | 0 | 0 | 0 | 0 | 0 | 0 | 0 | 0 | 0 | 0 |
| r G5V | 0 | 0 | 33 | 0 | 0 | 0 | 0 | 0 | 0 | 0 | 51 | 0 | 0 | 0 | 47 | 0 | 0 | 0 | 0 |
| r K0V | 20 | 0 | 0 | 0 | 0 | 40 | 35 | 0 | 1 | 70 | 0 | 0 | 63 | 43 | 0 | 24 | 51 | 0 | 0 |
| O7B1III | 0 | 0 | 0 | 0 | 0 | 0 | 0 | 0 | 0 | 0 | 0 | 0 | 0 | 0 | 0 | 0 | 0 | 0 | 0 |
| B5III | 0 | 0 | 0 | 0 | 0 | 0 | 0 | 0 | 0 | 0 | 0 | 0 | 0 | 0 | 0 | 0 | 0 | 0 | 0 |
| B9III | 0 | 0 | 0 | 0 | 0 | 0 | 0 | 0 | 0 | 0 | 0 | 0 | 0 | 0 | 0 | 0 | 0 | 0 | 0 |
| F4-7III | 0 | 0 | 0 | 32 | 0 | 0 | 0 | 0 | 0 | 17 | 0 | 0 | 0 | 0 | 0 | 0 | 0 | 0 | 0 |
| G0-4III | 0 | 1 | 19 | 14 | 0 | 8 | 0 | 0 | 0 | 0 | 0 | 39 | 0 | 0 | 0 | 0 | 0 | 47 | 0 |
| G8III | 0 | 0 | 0 | 0 | 0 | 0 | 27 | 0 | 0 | 0 | 36 | 0 | 0 | 20 | 0 | 0 | 9 | 0 | 0 |
| K4III | 0 | 0 | 0 | 0 | 0 | 4 | 0 | 0 | 0 | 0 | 0 | 0 | 7 | 4 | 0 | 0 | 0 | 0 | 0 |
| M0-1III | 2 | 0 | 0 | 0 | 9 | 5 | 0 | 0 | 0 | 0 | 4 | 3 | 0 | 0 | 0 | 0 | 0 | 1 | 0 |
| M3III | 0 | 0 | 0 | 1 | 0 | 0 | 0 | 0 | 0 | 0 | 0 | 0 | 0 | 0 | 0 | 0 | 0 | 0 | 0 |
| M5III | 3 | 0 | 5 | 0 | 0 | 0 | 0 | 0 | 0 | 0 | 0 | 0 | 0 | 0 | 0 | 0 | 0 | 0 | 0 |
| r K3III | 9 | 11 | 0 | 0 | 0 | 0 | 0 | 0 | 0 | 0 | 0 | 22 | 0 | 0 | 0 | 20 | 8 | 0 | 0 |
| O8I | 0 | 0 | 0 | 0 | 0 | 0 | 0 | 0 | 0 | 0 | 0 | 0 | 0 | 0 | 0 | 0 | 0 | 0 | 0 |
| B3-5I | 0 | 0 | 0 | 0 | 0 | 0 | 0 | 0 | 0 | 0 | 0 | 0 | 0 | 0 | 0 | 0 | 0 | 0 | 0 |
| A7-9I | 0 | 0 | 0 | 0 | 0 | 3 | 0 | 0 | 0 | 0 | 0 | 0 | 0 | 0 | 0 | 0 | 0 | 0 | 0 |
| G0-1I | 35 | 15 | 24 | 0 | 0 | 0 | 0 | 0 | 0 | 0 | 0 | 21 | 0 | 0 | 0 | 45 | 3 | 25 | 0 |
| K1-2I | 1 | 0 | 0 | 13 | 39 | 15 | 0 | 0 | 0 | 7 | 0 | 0 | 0 | 0 | 26 | 0 | 0 | 0 | 6 |
| K3-5I | 0 | 0 | 0 | 0 | 0 | 12 | 10 | 0 | 7 | 0 | 3 | 0 | 7 | 29 | 5 | 3 | 7 | 19 | 0 |
| r K3I | 0 | 0 | 12 | 0 | 0 | 0 | 0 | 0 | 0 | 0 | 0 | 2 | 0 | 0 | 0 | 0 | 0 | 0 | 0 |
| CO | 0 | 1 | 6 | 0 | 2 | 6 | 2 | 0 | 4 | 1 | 3 | 3 | 6 | 0 | 10 | 0 | 0 | 5 | 3 |
| 53 | 43 | 115 | 157 | 83 | 50 | 153 | 89 | 64 | 70 | 111 | 70 | 253 | 147 | 64 | 88 | 93 | 87 | 102 | |
| lines used | 52 | 52 | 58 | 48 | 47 | 48 | 55 | 49 | 48 | 53 | 63 | 44 | 55 | 54 | 52 | 49 | 45 | 44 | 51 |
| 0.1 | 0.15 | 0.22 | 0.1 | 0.0 | 0.1 | 0.15 | 0.3 | 0.25 | 0.25 | 0.25 | 0.0 | 0.0 | 0.0 | 0.1 | 0.03 | 0.1 | 0.1 | 0.15 |
The wavelength ranges have been defined taking into account the shape of the absorption features in both hot and cool stars of the stellar library. The continuum level has been determined globally over the whole wavelength range. The error due to the uncertainty on the continuum level is dominant over all other measurements and statistical uncertainties. For well defined strong features (e.g. Na ID) this error is always less or equal to 1 Å in absolute value. It can go up to a few Angström for wide bands and strong blends.
The EW of the same spectral features have been measured in the spectra of the observed galaxies. For these, we discarded the intervals corresponding to the emission lines, as well as those showing atmospheric absorption features. We would like to stress the fact that discarding some intervals does not affect the results of the method, as we still have used a very large number of parameters (between 44 and 63 EW, depending on the objects).
4.2 Synthesis results
4.2.1 Stellar content
Several studies performed in normal, nearby and distant ellipticals, in the field and in clusters (e.g. Pickles 1985; Carter et al. 1986; Couture & Hardy 1988, 1990, 1993; Munn 1992; Davies et al. 1993; Brown 1996; Trager 1997; Charlot et al. 1998; Mobasher & James, 2000; Minniti 2001) show old stellar populations, with a main contribution of late stellar types, typically main sequence stars. However, for the more luminous ellipticals a non-negligeable component of O-B main sequence stars seems to be present in many objects. The populations in the centre of the galaxies are generally super metal rich dwarf and/or subdwarf stars, contrary to the ones found in the bulge. A population gradient is usually found, with the populations being younger and richer in metals at the centre of the galaxies. Concerning galaxies in clusters, the younger populations of red giants and supergiant stars are usually found in the ellipticals located at the outskirts of the cluster.
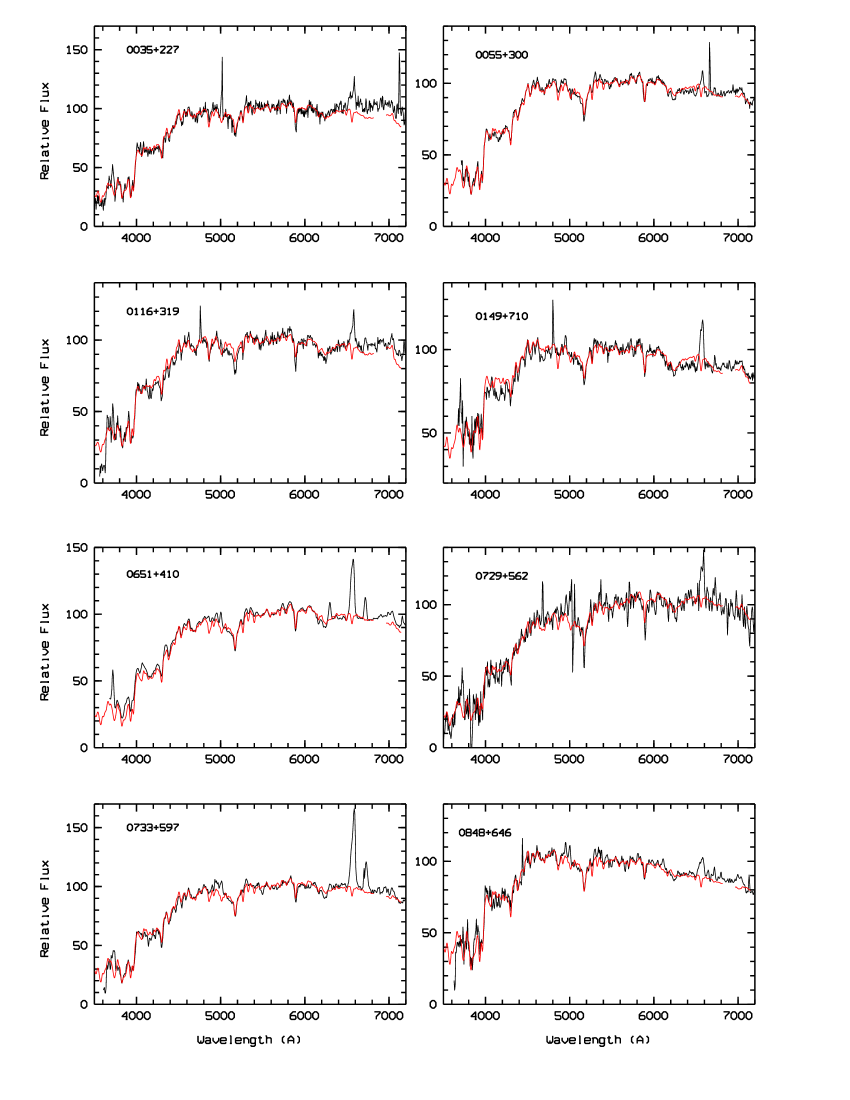
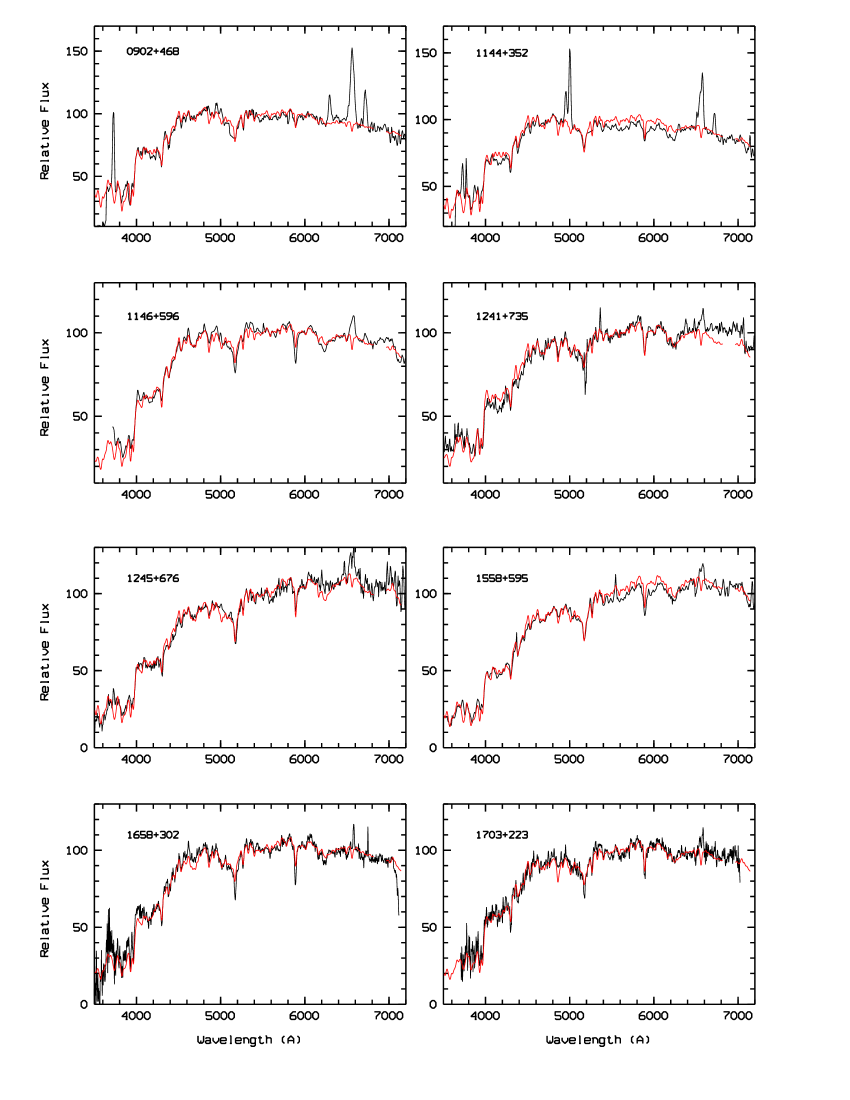
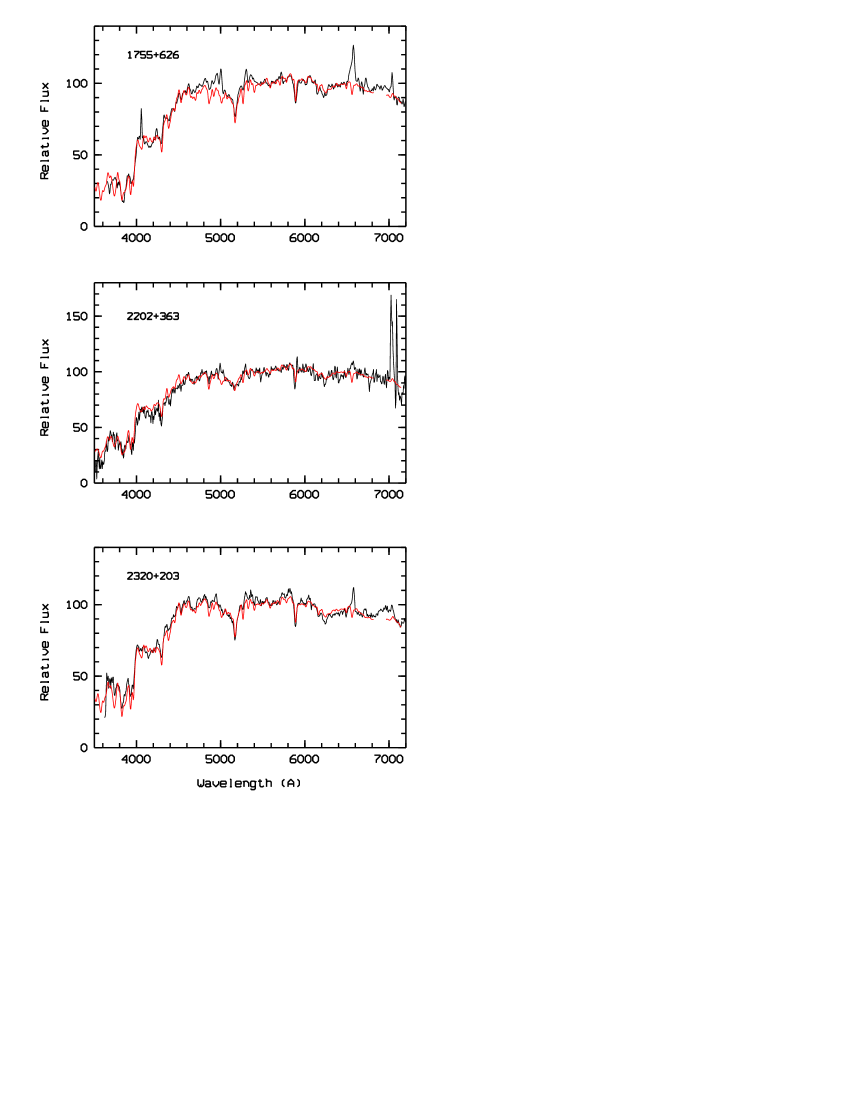
In Fig. 1 we plot the observed spectra (black lines) superposed on the synthetic ones (grey lines); all spectra are given in the rest frame.
Table 3 shows the stellar populations obtained for the 19 objects studied, together with the value of the distance for each solution, the number of absorption features used in the synthesis, and the internal reddening derived.
Due to the nature of the synthesis method we use, it is important to have in mind several considerations when analysing the results obtained for each object. In particular, we do not pretend to derive the stellar content of the objects in its very details, but to have an idea of its main components in terms of hot and cold stars, young and old populations; note that the young population is given not only by hot stars, but also by supergiants.
In a general way, we find old stellar populations typical of normal elliptical galaxies. For more than half of the objects in our sample, we do not find much dust. Concerning the super metal rich population, we have made some tests in order to estimate the importance of this component. Except for 0116+319 and 1241+735, this population is not important; we find good solutions to fit the spectra without it, as well. The hot stars are never present in the solutions, the populations being dominated by G, K and M spectral types. Thus, the younger populations appear in the form of supergiant stars (typical ages of the order of years). Despite supergiants being a very special class (which can include various types of stars, from the very massive and very young ones to the AGB or post-AGB stars, i.e. very old stars in their final phases), the fact that we are observing them in the optical range signifies that the contribution from supergiantes we are seeing comes from the young stars (Bruzual & Charlot, 1993); in fact, AGB and post-AGB stars contribute mainly in the UV range.
For several objects in the sample (0733+597, 0848+686, 1144+352, 1146+596 and 1755+626) we find only a small contribution of supergiants, implying that, in these objects, the population is quite old with ages of the order of – years. For 0651+410, 0902+468, 1245+676, 1658+302 and 2320+203, the largest contribution comes from main sequence and supergiant stars, the contribution from giant stars being quite small ( 10%); this means that the old component comes from a non-evolved population of main sequence stars. For 0651+410 and 1658+302, a strong (41%) young component in the form of supergiants appears. A lack in main sequence stars (contribution of 10%) is found for two of the galaxies in the sample: 1241+735 and 2202+363; in these cases, the population is distributed more or less equally between giant and supergiant stars.
NGC 3379, a normal elliptical was studied using the same method of computing the stellar populations (Boisson et al., 2000). For this galaxy we have found a very homogeneous old population (with almost no population gradients in the central regions of the galaxy) with a main component of main sequence stars (K and M spectral types) and some contribution from giant (K, M) stars. This population seems to be supermetal rich, i.e. composed of stars with a metallicity higher than solar. This metal enrichment is a direct proof of strong star formation in the past. Little dust is present in the solutions.
Comparing these results with the ones found in the present work, for our sample of galaxies, we verify that our objects have equally an old stellar population, the main contributors being G, K and M stars of luminosity classes V and III. The main difference is that our populations do not seem to be metal rich (except in the case of two objects: 0116+319 and 1241+735), contrary to the one found for NGC 3379. This can be due to the fact that only the central regions of NGC 3379 are discussed in Boisson et al.’s study, whereas in this work we are dealing with an integreted spectrum of the whole galaxy. Since star formation can be really intense in the central regions, this metal enrichment would be more proeminent there, thus justifying the difference found.
4.2.2 Colours and ages
In order to have another constraint on the population ages, we have computed the colours of our objects. Only the and indicies were calculated; we did not use the and colours because these filters do not fall entirely in our wavelengh range, and therefore we would be losing too much light to achieve confident results. Using evolutionary synthesis models for elliptical galaxies, from the Bruzual & Charlot code (Bruzual et al. 1997), we have estimated the ages of the populations. Two different kinds of models were used: a single stellar population model, i.e. a model computing the spectral evolution of a single initial instantaneous-burst of star formation, and a model that computes the evolution of the stellar populations with longer time scales of star formation, i.e. where the star formation rate (SFR) decreases exponentially with time (that is with the available gas content), during 1 Gyr. For both models the results are essentially the same. We find that the colour indices of most spectra are compatible with an intermediate/old stellar population with ages ranging from to years. This is in agreement with the results of our population synthesis, corroborating the method and our conclusions.
4.2.3 Dust content
A degenerency exists between the galaxy’s internal dust and the blue continuum of the spectrum, i.e. we can fit the observed continnum either with a given amount of dust plus a given blue slope, or just with a certain amount of dust (smaller in this case). This happens because both contributions have the effect of blueing the spectrum. In this work we have fitted all spectra in such a way that the continuum is also perfectly fitted by a value of , thus assuming that all contribution to the continuum comes from the dust and stellar content of the host galaxy. Instead, we could have found a blue excess in the continuum by adding more dust to the solutions and then argue about this quantity coming from the active nucleus. However, in this case it would be difficult to quantify either the quantity of dust present in the object, or the slope of the blue continuum. Also, and from the values of the Balmer break contrasts of the objects, we estimate the non-stellar continuum to be negligeable, well within the error bars of the flux calibration of the spectra. This is why we chose not to include a contribution from an AGN to the continuum.
5 Summary and Conclusions
In an effort to better understand LL FRS sources and their host galaxies, we undertook the spectroscopic study of 19 objects selected from Marchã’s et al. 200 mJy sample; this was known to contain a high fration of objects oriented close to the line-of-sight, such as LL BLLs. This study focused on the stellar content of the host galaxies.
We performed stellar population synthesis aimed at identifying the nuclear stellar populations present in the objects; our work made use of a very reliable mathematical method, yielding a Global Principal Geometrical solution.
Our main result concerns the stellar populations found in these objects, which are in agreement with those found in elliptical galaxies; our results show that the nuclear populations are composed of old stars of solar metallicity or lower; the dust content is weak, which is also typical of “normal” elliptical galaxies. It is most interesting to note that similar stellar populations were reported in Low Ionization Nuclear Emission-Line Regions. In particular, Serote Roos (1996) and Boisson et al. (2000) have shown, in a study of the stellar populations in a sample of AGN with different types of activity, that LINERs present the more evolved populations of the sample, with little recent star formation, i.e. the central regions of these objects are largely dominated by a red evolved population of metal rich stars.
The present work demonstrates the importance of stellar population synthesis in the study of low luminosity radio sources. We have shown that stellar synthesis allows us to obtain information on the stellar populations of the host galaxies, therefore providing material for further studies on the connection between host galaxy and the active nucleus. Stellar synthesis also constitutes a precious tool allowing us to unveil the optical emission lines present in the spectra of our objects. The analysis of such features provides information on the nature of the nuclear emission regions and excitation mechanisms at work in LL FSR sources; such a study has been performed and is the subject of a companion paper (Paper II).
Acknowledgements: We are greatly indebted to D. Pelat for the use of the population synthesis GPG program. We thank Thibault Lejeune for kindly computing the colours for our objects as well as the evolutionary synthesis models used in this work. We thank M. Marchã and A. Caccianica for fruitful discussions, and P. Véron for valuable comments. M. Serote Roos acknowledges financial support from FCT, Portugal, under grants no. BPD/9995/96 and BPD/5684/01, and from FCT/ESO Project ref. PESO/C/PRO/1254/98. A. C. Gonçalves acknowledges financial support from FCT, Portugal, under grant no. SFRH/BPD/9422/2002.
References
- (1) Blandford, R. D., & Rees, M. J. 1978, Some comments on radiation mechanisms in Lacertids, in Pittsburgh Conference on BL Lac Objects, ed. A. M. Wolfe (U. of Pittsburgh, Pittsburgh, Pennsylvania), 328
- (2) Boisson, C., Joly, M., Moultaka, J., Pelat, D., & Serote Roos, M. 2000, A&A, 357, 850
- (3) Brown, T. 1996, AAS, 189, 620
- (4) Browne, I. W. A., & Marchã, M. J. 1993, MNRAS, 261, 795
- (5) Bruzual G., Barbuy B., Ortolani S., Bica E., Cuisinier F., Lejeune T., Schiavon R. P., 1997, AJ, 114, 1531
- (6) Carter, D., Visvanathan, N., & Pickles, 1986, ApJ, 311, 637
- (7) Charlot, S., Liu, M, Graham, J. 1998, AAS, 193, 906
- (8) Couture, J., & Hardy, E. 1988, AJ, 96, 867
- (9) Couture, J., & Hardy, E. 1990, AJ, 99, 540
- (10) Couture, J., & Hardy, E. 1993, ApJ, 406, 142
- (11) Davies, R. L., Sadler, E. M., & Peletier, R. F. 1993, MNRAS, 262, 650
- (12) Dennett-Thorpe, J., & Marchã, M. J. 2000, A&A, 361, 480
- (13) Falomo, R., & Ulrich, M.-H. 2000, A&A, 357, 91
- (14) Gonçalves, A. C., & Serote Roos, M., A&A, in press (Paper II)
- (15) Howarth, I. 1983, MNRAS, 203, 301
- (16) Marchã, M., Browne, I., Impey, C., & Smith, P. 1996, MNRAS, 281, 425
- (17) Minniti, D. 2001, MxAC, 11, 73
- (18) Mobasher, B., James, P.A. 2000, MNRAS, 316, 507
- (19) Munn, J. A. 1992, ApJ, 399, 444
- (20) Padovani, P., & Urry, C. M. 1990, ApJ, 356, 75
- (21) Pelat, D. 1997, MNRAS, 284, 365
- (22) Pickles, A. J. 1985, ApJ, 296, 340
- (23) Rector, T. A., Stocke, J. T., Perlman, E. S. 1999, ApJ, 516, 145
- (24) Schlegel, D., Finkbeiner, D., & Davis, M. 1998, ApJ, 500, 525
- (25) Serote Roos, M., Boisson, C., Joly, M., & Ward, M. 1998, MNRAS, 301, 1
- (26) Serote Roos, M. 1996, Ph.D. Thesis, University of Paris VII
- (27) Silva, D., & Cornell, M. 1992, ApJS, 81, 865
- (28) Terlevich R., & Melnick J. 1985, MNRAS, 213, 841
- (29) Trager, S.C., 1997, PhD Thesis, University of California, Santa Cruz
- (30) Urry, C. M., Scarpa, R., O’Dowd, M., et al. 2000, ApJ, 532, 816
- (31) Verdoes Kleijn, G. A., Baum, S. A., de Zeeuw, P. T., o’Dea, C. P. 1999, AJ, 118, 2592