First INTEGRAL observations of GRS 1915105††thanks: Based on observations with INTEGRAL, an ESA project with instruments and science data center funded by ESA and member states (especially the PI countries: Denmark, France, Germany, Italy, Switzerland, and Spain), the Czech Republic, and Poland and with the participation of Russia and the US.
We present data from the first of six monitoring Open Time observations of GRS 1915105 undertaken with the orbiting INTEGRAL satellite. The source was clearly detected with all three X-ray and gamma-ray instruments on board. GRS 1915105 was in a highly variable state, as demonstrated by the JEM X-2 and ISGRI lightcurves. These and simultaneous RXTE/PCA lightcurves point to a novel type of variability pattern in the source. In addition, we fit the combined JEM X-2 and ISGRI spectrum between 3–300 keV with a disk blackbody powerlaw model leading to typical parameter values found earlier at similar luminosity levels. A new transient, IGR J19140098, was discovered during the present observation.
Key Words.:
X-rays:binaries – X-rays: GRS 19151051 Introduction
GRS 1915105 has been extensively observed at all wavelengths ever since its discovery. It was originally detected as a hard X-ray source with the WATCH all-sky monitor on the GRANAT satellite (Castro-Tirado et al. 1992) with a flux of 0.35 Crab in the 6–15 keV range (Castro-Tirado et al. 1994). Subsequent monitoring with BATSE on CGRO showed it to be the most luminous hard X-ray source in the Galaxy (Paciesas et al. 1996), with L erg s-1 (for a distance of 12.5 kpc). Apparent superluminal ejections have been observed from GRS 1915105 on at least two occasions: the first time in 1994 with the VLA (Mirabel & Rodríguez 1994) and the second time in 1997 with MERLIN Fender et al. (1999). Both times the true ejection velocity was calculated to be . Following the ejections of 1997, Fender et al. (1999) give an upper limit for the distance to the source of 11.20.8 kpc. High optical absorption ( magnitudes) towards GRS 1915105 prevented the identification of the non-degenerate companion until recently. However, using the VLT, Greiner, Cuby & McCaughrean (2001) identified the mass-donating star to be of spectral type K-M III and hence deduced the mass of the black hole to be . The Rossi X-ray Timing Explorer (RXTE) has observed GRS 1915105 since its launch in late 1995 and has shown the source to be highly variable (see e.g. Belloni et al. 2000). The source was detected up to 700 keV during OSSE observations (Zdziarski et al. 2001).
GRS 1915105 is being observed extensively with the European Space Agency’s International Gamma-Ray Astrophysical Laboratory (INTEGRAL, Winkler et al. 2003) as part of the Core Program and also within the framework of an Open Time monitoring campaign. Here we present the results of the first observation of the Open Time monitoring campaign which took place on 2003 Mar 6. We show the lightcurves and the spectra from ISGRI and JEM-X, in addition to a SPI image. We also show that the source underwent a new type of variability during this observation, which is seen in the JEM X-2 lightcurve and confirmed by simultaneous RXTE observations.
2 Observations
As part of a monitoring program which consists of six 100 ks observations separated by approximately one month, INTEGRAL observed GRS 1915105 for the first time for this campaign on 2003 Mar 6 beginning at 03:22:33UT. Simultaneously with the INTEGRAL observations, we obtained pointed RXTE observations (Rodriguez et al., in preparation), in addition to radio data from the Molonglo Observatory Synthesis Telescope, the Ryle Telescope and RATAN. These latter data will be dealt with in detail in a forthcoming paper which will cover all the observations (Hannikainen et al., in preparation). Figure 1 shows the RXTE/ASM 1.2–12 keV lightcurve beginning with INTEGRAL’s launch on 2002 Oct 17. The dashed line indicates the date of the 100 ks INTEGRAL observation. As 75 ASM ct/s corresponds to 1 Crab, our observation was undertaken while the source had a luminosity of 560 mCrab (in the 1.2–12 keV ASM range), which is close to the average luminosity of the source.

The INTEGRAL observations were undertaken using the hexagonal dither pattern (Courvoisier et al. 2003): this consists of a hexagonal pattern around the nominal target location (1 source on-axis pointing, 6 off-source pointings, each 2 degrees apart and each science window of 2200 s duration). This means that GRS 1915105 was always in the field-of-view of all three X-ray (JEM X-2) and gamma-ray (IBIS and SPI) instruments throughout the whole observation. The source was clearly detected by all three X-ray and gamma-ray instruments as shown below (Figs. 2, 4, 5 and 7). (Due to high extinction towards the source, the target was not visible in the optical monitor.) The properties of the INTEGRAL instruments are described in detail elsewhere in this journal and so we give only a brief introduction. In this section we present the results of the INTEGRAL observation of 2003 Mar 6.
All data reductions were performed using standard software explained elsewhere in the present issue, using instrument responses available in June 2003.
2.1 ISGRI

The Imager on Board the INTEGRAL Spacecraft (IBIS, Ubertini et al. 2003) is a coded mask instrument designed for high angular resolution (12 arcmin, but source location down to 1 arcmin) imaging in the energy range from keV to MeV. Its total field of view is degrees for zero response with a uniform sensitivity within the central degrees. It has degrees FWHM, i.e. up to 50% response of the instrument. The INTEGRAL Soft Gamma-Ray Imager (ISGRI, Lebrun et al. 2003) is the top layer of the IBIS detection plane, which consists of an array of 128128 Cadmium Telluride (CdTe) square pixels (4 mm 4 mm each) and covers the energy range from 20 keV to a few hundred keV. Data reduction has been performed following the standard method described in Goldwurm et al. (2003) extracting from each 2200s pointing the source positions and count rates. Then a mosaic was produced from the summation of all pointings.
Figure 2 shows the IBIS/ISGRI 20–40 keV () mosaicked image of the field of GRS 1915105, with an exposure time of 98300 s. A preliminary instrumental background correction has been performed (Terrier et al. 2003). Two other known sources, H1907097 and 4U 190907, are visible in the field.
In addition, a new transient, IGR J19140098 (SIMBAD corrected name IGR J19140+0951) was discovered during the observation of 2003 Mar 6 (Hannikainen, Rodriguez & Pottschmidt 2003).
Figure 3 (top) shows the 20–40 keV and (bottom) the 40–80 keV ISGRI lightcurves. The horizontal line indicates the 50 mCrab level in the given energy ranges. As can be inferred, the luminosity of the source varies between mCrab in the 20–40 keV range and between mCrab in the 40–80 keV range.

2.2 SPI
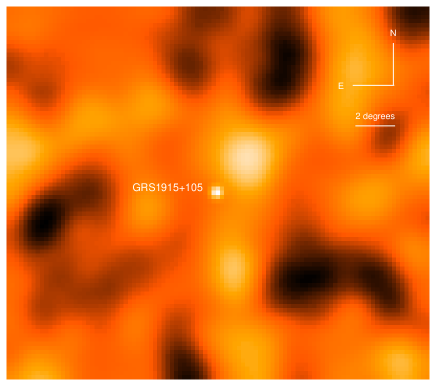
The Spectrometer on INTEGRAL (SPI, Vedrenne et al. 2003) is a coded mask instrument designed for high energy resolution (2 keV at 1 MeV) spectroscopy of gamma-ray sources in the 20 keV to 8 MeV range. It consists of an array of 19 hexagonal high-purity Germanium detectors. The field of view is 16∘ in diameter with an angular resolution of 2∘. The resulting 100–200 keV SPI image is shown in Figure 4. GRS 1915105 is clearly detected up to 200 keV.
One point which must be noted is that the new transient, IGR J19140+098, lies only 1.13∘ away from GRS 1915105 thus rendering the spectral extraction highly uncertain (due to source confusion) at this early stage of the mission.
2.3 JEM X-2
 |
 |
 |
The Joint European X-ray monitor, JEM-X (Lund et al. 2003), consists of two identical coded mask instruments designed for X-ray imaging in the range of 3–35 keV with an angular resolution of 3 arcmin and a timing accuracy of 122 -s. At present, only JEM X-2 is operational, so all results shown here are from that instrument. The top left-hand side of Figure 5 shows the JEM X-2 lightcurve from the whole 100 ks observation. As can be seen, the source was in a very variable state, with the flux varying between 0.25 to 2 Crab with a mean of Crab. The other panel shows a zoom of the lightcurve, which shows particularly striking rapid oscillations. Of particular interest are the main peaks separated by minutes. Although this kind of variability resembles the -heartbeat, and oscillations (variability classes of Belloni et al. (2000)), these are more uniform and occur on shorter timescales. Our RXTE observations did not cover the entire 100 ks INTEGRAL data but were simultaneous. They confirm the variability seen by JEM X-2. We produced a color-color (CC) diagram for the RXTE data in the same manner as in Belloni et al. (2000) (note that the energy-channel conversion for PCA corresponds to epoch 5). The resultant plot is shown in Fig. 5. This CC-diagram and the JEM X-2 lightcurve seem to indicate a new type of variability not seen in the 12 classes by Belloni et al. (2000). The JEM X-2 lightcurves were also built in four energy bands and a CC-diagram ( (6–15 keV)/(3–6 keV) vs (15–35 keV)/(3–6 keV) ) constructed for the mean pulse profile of the 5-min oscillations. The resulting CC-diagram was very similar to that of RXTE shown in Fig. 5. The ‘ups’ were harder than the ‘downs’ – this behavior is opposite to that seen in the , and oscillations.
In order to have a first overview of the JEM X-2 capability in timing analysis, we produced a simple Fourier Transform of the whole JEM X-2 lightcurve (Fig. 6). After removing artefacts due to some gaps in the data, we can identify a Quasi-Periodic Oscillation (QPO) at a frequency Hz ( Hz). At the current stage, the exact power of the feature cannot be known exactly since it requires a precise background estimate. The observation of such a low QPO with JEM X-2 is, however, of prime importance since it opens the studies of low frequencies (difficult to access with RXTE due to its 90-minute orbit, and usually shorter observations) through the long, continuous INTEGRAL observations. The frequency of this QPO is in agreement with the 5-minute timescale of the main peaks in the lightcurve. The fact that such a feature is detected from the Fourier transform of the whole 100 ks JEM X-2 lightcurve indicates that this class of variability is dominated by the 5-min oscillations. A deeper analysis of the variability is in progress and will be published elsewhere.

2.4 Preliminary spectral analysis

ISGRI spectra were extracted with a pre-flight 128 channels redistribution matrix file (rmf) and despite source variability, all spectra from all pointings were averaged. Figure 7 shows the ISGRI spectrum accumulated over the whole observation of 100 ks. Note that we used an ancillary response file (arf) preliminarily corrected compared to the pre-flight matrix (P. Laurent, private communication). JEM X-2 spectra from science window 26, i.e. the interval covering (Fig. 5) IJD=1160.79063 to 1160.81615, were extracted. Data above 450 keV in the case of ISGRI and above 30 keV in the case of JEM X-2 were ignored, and some bins above 100 keV were co-added.
The XSPEC package v11.2.0 was used for the fitting. The resulting co-added spectrum and model is shown in Fig. 7. The model used was photoelectric absorption, plus a disk blackbody and powerlaw. NH was frozen to 5 (Lee et al. 2002). The fit yielded an inner temperature of the disk of 1.10.17 keV and a photon index 2.970.3. This photon index is what is expected for the medium luminosity level (see Fig. 1) during which the present observations were performed (e.g. Muno et al. 1999, Vilhu et al. 2001). The normalizations for both ISGRI and JEM X-2 were left free. The best fit led to a normalization of photons/keV/cm2/s at 1 keV for JEM X-2, and photons/keV/cm2/s for ISGRI. The 2–20 keV unabsorbed flux was erg cm-2 s-1. The blackbody component accounts for 51, of the 2–20 keV unabsorbed flux.
The flux in the 20–450 keV range is erg cm-2 s-1, which corresponds to a luminosity of erg s-1 for a distance of 11.5 kpc. However, it must be noted that the source was in a very variable state and is known to vary on all timescales, so the resulting spectrum is in fact an average over the variability.
3 Summary
Although major analysis of the Open Time observations of GRS 1915105
is being undertaken and the results will be presented elsewhere, here
we want to stress the following:
GRS 1915 was clearly detected by all three of INTEGRAL’s X-ray and gamma-ray instruments
The source was highly variable as demonstrated by both the JEM X-2 3–35 keV and ISGRI 20–40 and 40–80 keV lightcurves. This class of variability seems to be new in comparison with previous studies.
The source brightness varied from 0.25 to 2 Crab in the JEM X-2 energy range and between mCrab ( mCrab) in the 20–40 keV (40–80 keV) ISGRI ranges
Assuming a distance of 11.2 kpc, GRS 1915105 had an averaged 20–450 keV luminosity erg s-1
Acknowledgements.
DCH and OV acknowledge the Academy of Finland, TEKES, and the Finnish space research program ANTARES for financial support in this research. AAZ has been supported by KBN grants 5P03D00821, 2P03C00619p1,2 and PBZ-054/P03/2001, and a grant from FNP. The authors acknowledge P. Laurent, M. Cadolle-Bel for kindly providing preliminary ISGRI response matrices, and V. Beckmann for useful help with the SPI data analysis. JR acknowledges financial support from the French space agency (CNES). We acknowledge quick-look results provided by the ASM/RXTE team. We thank the referee for valuable comments which made this paper more complete.References
- Belloni et al. (2000) Belloni, T., Klein-Wolt, M., Méndez, M., van der Klis, M. & van Paradijs, J. 2000, A&A, 355, 271
- Castro-Tirado et al. (1992) Castro-Tirado, A.J., Brandt, S., & Lund, N. 1992, IAU Circ., 5590
- Castro-Tirado et al. (1994) Castro-Tirado, A.J., Brandt, S., & Lund, N. et al. 1994, ApJS, 92, 469
- Courvoisier et al. (2003) Courvoisier, T.J.L., Walter, R. et al. 2003, A&A, this volume
- Fender et al. (1999) Fender, R.P., Garrington, S.T., McKay, D.J., et al., 1999, MNRAS, 304, 865
- Goldwurm et al. (2003) Goldwurm, A., David, P., Foschini, L., et al. 2003, A&A, this volume
- Greiner et al. (2001) Greiner, J., Cuby, J.G., McCaughrean, M.J., Castro-Tirado, A. & Mennickent, R.E. 2001, A&A, 373, L37
- Hannikainen, Rodriguez & Pottschmidt (2003) Hannikainen, D.C., Rodriguez, J. & Pottschmidt, K., 2003, IAUC 8088
- Lebrun et al. (2003) Lebrun, F., Leray, J.-P., Lavocat, P., et al. 2003, A&A, this volume
- Lee et al. (2002) Lee, J., Reynolds, C.S., Remillard, R., Shulz, N.S., Blackman, E.G. & Fabian, A.C. 2002, ApJ, 567, 1102
- Lund et al. (2003) Lund, N., et al. 2003, A&A, this volume
- Mirabel & Rodríguez (1994) Mirabel, I.F. & Rodríguez, L.F. 1994, Nature, 371, 46
- Muno et al. (1999) Muno, M.P., Morgan, E.H., Remillard, R.A. 1999, ApJ, 527, 321.
- Paciesas et al. (1996) Paciesas, W.S, Deal, K.J., Harmon, B.A., et al. 1996, A&AS, 120, 205
- Terrier et al. (2003) Terrier, R., Lebrun, F., Sauvageon, A., et al. 2003, A&A, this volume
- Ubertini et al. (2003) Ubertini, P., Lebrun, F., Di Cocco, et al. 2003, A&A, this volume
- Vedrenne et al. (2003) Vedrenne, G., et al. 2003, A&A, this volume
- Vilhu et al. (2001) Vilhu, O., Poutanen, J., Nikula, P. & Nevalainen, J. 2001, ApJ, 553, L51
- Winkler et al. (2003) Winkler, C., et al. 2003, A&A, this volume
- Zdziarski et al. (2001) Zdziarski, A.A., Grove, J.E., Poutanen, J., Rao, A.R. & Vadawale, S.V. 2001, ApJ, 554, L45