The baryonic mass-velocity relation; clues to feedback processes during structure formation and the cosmic baryon inventory
Abstract
We show that a global relation between baryonic mass and virial velocity can be constructed from the scale of dwarf galaxies up to that of rich galaxy clusters. The slope of this relation is close to that expected if dark matter halos form in the standard hierarchical cosmogony and capture a universal baryon fraction, once the details of halo structure and the adiabatic contraction of halos due to cooling gas are taken into account. The scatter and deficiency of baryons within low mass halos ( km/s) is consistent with the expected suppression of gas accretion by photo-evaporation due to the cosmic UV background at high redshift. The data are not consistent with significant gas removal from strong supernovae winds unless the velocities of galaxies measured from their gas kinematics are significantly lower than the true halo velocities for objects with km/s. Thus models such as CDM with a steep mass function of halos may find it difficult to reproduce both the baryonic mass-velocity relation presented here whilst at the same time reproducing the flat luminosity/HI function of galaxies. Galaxies hold about 10% of the baryons in the Universe, which is close to the collapsed mass fraction expected within hierarchical models on these scales, suggesting a high efficiency for galaxy formation. Most of the baryons are expected to be evenly distributed between diffuse intergalactic gas in low density environments and the intra-galactic medium within galaxy groups.
keywords:
cosmology:theory — galaxies: dynamics — galaxies: halos1 Introduction
Rotational velocities and luminosities of disk galaxies combine to yield the well known Tully-Fisher relation (Tully & Fisher 1978) across several decades of galaxy masses. The break in the Tully-Fisher relation at velocities lower than km/s is removed once total baryonic masses, including gas masses, are used instead of luminosities (McGaugh et al. 2000). Many faint disk galaxies are indeed gas-rich, with the neutral hydrogen component often outweighting the stellar mass (Schombert et al. 2001). The latter ”baryonic” Tully-Fisher is well defined down to velocities as low as km/s, with the small intrinsic scatter possibly due to the spread in stellar-mass-to-light ratios resulting from reasonable variations in the star formation histories (Verheijen et al. 1997). The slope of the baryonic Tully-Fisher measured by McGaugh et al. (2000, hereafter MC00) is close to . As the relation links the amount of baryons within galaxies with their overall potential/total mass (through the rotational velocity), it reflects a tight coupling between dark matter and baryons and hence provides an important test for galaxy formation models. Taken at face value the observed slope might be too steep compared to the slope of the relation between virial mass and peak velocity of halos expected in a concordance CDM model ( - see Bullock et al. 2001). However the baryons themselves can modify the mass profile as a result of adiabatic contraction (Blumenthal et al. 1986), which raises the peak velocity - an effect that must be taken into account when comparing theory with observations.
The apparent break existing in the Tully Fisher at low velocities has often been interpreted as evidence for a strong effect of supernovae feedback that ejects baryons from galaxies (Dekel & Silk 1986). The absence of a break in the observed baryonic Tully-Fisher relation does not support these feedback models (MC00). However it is not clear whether this is true for even for fainter more extreme dwarf galaxies, like those that populate the outer fringes of the Local Group (with measured rotational velocities lower than 50 km/s, see Mateo 1998). Indeed, whilst the most sophisticated numerical models of supernovae explosions suggest that even at such low galactic masses only a very small fraction of the total gas mass can be removed by supernovae winds (Mac Low & Ferrara 1999; Mori, Ferrara & Madau 2002), the need to suppress the overcooling in galaxies (White & Frenk 1991) and the failure of cosmological simulations with hydrodynamics to form realistic disks is usually taken as a strong motivation for the need of strong supernovae winds (Navarro & White 1993; Navarro & Steinmetz 2000; Thacker & Couchman 2001; but see Governato et al. 2003). These winds would eject significant amounts of gas in small, early forming objects, quenching galaxy formation at small scales and leaving a larger amount of diffuse, higher angular momentum gas available to form larger galaxies that will be assembled later. A low efficiency of galaxy formation, suggestive of strong feedback mechanisms, is also advocated in the recent estimate of the baryonic mass function of galaxies (Bell et al. 2003), who find that less than of the total number of baryons in the Universe are found in galaxies.
The cosmic UV background at high redshift was strong enough to significantly suppress the collapse of gas in small halos (Benson et al. 2002a,b, 2003) and might provide a feedback mechanism capable of explaining why the number of luminous galaxy satellites of the Milky Way is much lower than expected from the theory (Kauffmann, White, & Guiderdoni, 1993; Moore et al. 1999; Bullock, Kravtsov & Weinberg 2001). On the larger mass scales of groups and clusters of galaxies strong pre-heating of gas at high-redshift, by either supernovae or AGNs (Bower et al. 2001; Borgani et al. 2002), has also been invoked to explain the steepening of the relation between the X-ray luminosity and the X-ray temperature of the hot virialized gas towards decreasing masses (e.g. Babul et al. 2000, Borgani et al. 2002). However, there are claims that radiative cooling alone might account for most of this effect (Dave et al. 2001; Bryan 2000).
In this paper we report on a first attempt to extend the baryonic Tully-Fisher relation to both lower masses, by including the faintest disk galaxies known, and larger masses, up to rich clusters of galaxies. The implications of our results on the role of feedback mechanisms in structure formation will be discussed. We will then revisit the distribution of baryons in the Universe within the concordance cosmological model.
2 Construction of the sample
We use a variety of datasets to construct the extended baryonic Tully Fisher relation. (We assume km s-1Mpc-1 throughout.) The total baryonic mass of systems are inferred directly by observations employing a variety of tracers, from HI and mostly near infrared photometry in galaxies to hot ionized gas measured through its X-ray emission in clusters. For bright galaxies our analysis is mostly based on the data published by MC00 (these are already a combination of different samples, with photometry in B, H, I and K bands) to which we add recent B band photometry and HI kinematics of dwarf galaxies from Stil et al. (2003a,b) and the data on the outer Local Group dwarf irregular galaxies from Mateo (1998). Note that that we do not include the very nearby dwarf spheroidals because the structure of these galaxies may have been substantially reshaped by the tidal interactions with the Milky Way and M31 (Mayer et al. 2001a,b). We also stress that the baryonic mass estimated for galaxies is more precisely the sum of the stars and the cold gas component (the latter is the mass of HI augmented by the mass in helium and metals but no molecular hydrogen, computed as in MC00). We do not take into account the eventual contribution of a warm/hot ionized medium in their halos or disks since the quantitative information from observations is still poor; however, we will discuss the impact that this would have on the estimates of the total baryonic content of galaxies in light of recent observations in Section 4.
For clusters we use two datasets, one from Ettori & Fabian (1999), which contains 36 rich clusters observed with ROSAT, and one from Ettori et al. (2002) containing 50 clusters with a slightly lower average temperature observed by BeppoSax. The same method was used in these two latter papers to derive cluster masses using fits to NFW profiles. For groups we use the small sample by Mulchaey et al. (1996), that to our knowledge, is the only one providing an estimate of both gas masses and total stellar masses which are non negligible in groups. We assume a fixed stellar mass-to-light ratio (in any given band) to compute the stellar mass from the luminosity of galaxies; we follow MC00 (from which the largest sample is drawn), therefore and (these stellar mass-to-light ratios are based on a stellar population synthesis model orginally developed by de Jong (1996) assuming a Salpeter stellar initial mass function (IMF), see MC00 for details).
We have to make some assumptions to derive the virial circular velocity, , from kinematics of galaxies or from the measured temperature of the intracluster medium. These assumptions are based on the current paradigm of structure formation within a cold dark matter scenario. Hereafter we will assume the standard CDM model (, ). Circular velocity profiles of CDM halos are not flat; they reach a peak value, at some inner radius and then fall gently out to the virial value, . The ratio depends on the concentration, , where is the halo virial radius and is the halo scale radius. We have , with 4.62[log (Bullock et al. 2001). Kinematical data are normally limited to the inner portion of the galaxies, hence only is accessible (we discuss later the possibility that even has not really been measured for many dwarf galaxies).
For galaxies with resolved rotation curves is typically identified with the flat portion of the rotation curve, otherwise the half-line width is taken as a reference value (see MC00 and Gonzalez et al. 2000). can be than computed from by means of the function . Cosmological simulations (Bullock et al. 2001) show that the mean value of changes by less than 30% between and a few times due to the mild trend of increasing concentration with decreasing halo virial mass - the mean value of varies between and in this mass range; galaxies with km/s are expected to have a virial mass larger than (Bullock et al. 2001), and hence for them we assume as a representative value to calculate . The rotation curves of many dwarf and low surface brightness galaxies often suggest the presence of a constant density core instead of the inner cusp of the NFW profile (de Blok, McGaugh & Rubin, 2001a,b; de Blok & Bosma 2002). However, here we are not interested in the mass distribution near center of galaxies, instead we want to estimate the global parameters of a given system, and in this respect we rely on the fact that reasonable NFW fits to most of the extent of the rotation curve can be obtained provided that one uses concentrations in the range , significantly lower than expected in CDM models at the scale of dwarf galaxies (Van den Bosch & Swaters 2001; Swaters et al. 2003a; Blais-Ouellette, Amram & Carignan et al. 1999, 2001). Therefore, we compute for a fixed for galaxies with km/s (note that typical concentrations for such systems, whose total mass is supposedly lower than , should be - see Bullock et al. 2001).
We further correct for the steepening of the rotation curve which would result by the infall of baryons and the adiabatic contraction of the halo during galaxy formation (Blumenthal et al. 1994). We adopt the fitting functions by Mo, Mao & White (1998), which depend on the halo spin parameter , , the disk mass fraction and the ratio between disk and halo specific angular momentum, . We assume , namely that dark matter and baryons start with the same specific angular momentum and baryons conserve the latter during collapse. Assuming the most probable value for the halo spin (, see Gardner 2001) and a conservative value for the disk mass fraction (e.g. Jimenez, Verde & Oh 2003), this last correction lowers by another the value of calculated from . For simplicity we assume a single correction factor for all galaxies with km/s (corresponding to km/s). We do not apply the correction for adiabatic contraction in galaxies with lower - indeed photoionization at high redshift should have reduced substantially the infall of baryons within small halos, leaving their dark matter circular velocity profiles nearly unaffected by the baryons (Quinn, Katz & Efstathiou 1996; Gnedin 2000).
Finally, when its contribution to the kinematics is non-negligible (typically for the faintest dwarf irregulars) we also include the gas velocity dispersion in the calculation, defining ( is the 1D, line-of-sight velocity dispersion, is the rotational velocity), which follows from the virial theorem (Swaters et al. 2003b), and we assume isotropy such that .
For clusters and groups we use X-ray temperatures of the diffuse hot gaseous medium to infer the 1-dimensional velocity dispersion, , under the assumption that the system is in virial equilibrium, (see Binney & Tremaine 1987), where the molecular weight is (we assume ionized gas with cosmological abundances) and is the mass of the proton. The velocity dispersion is then used to determine the circular velocity by simply assuming the asymptotic relation valid for an isothermal potential, , which is approximately valid even for an NFW profile (Taffoni et al. 2003). We use the gas masses measured within the outermost radius for all clusters; this radius is between 1 and 1.5 Mpc and we assume that it is a good estimate of the virial radius (if the true virial radius is larger we should only slightly underestimate the total gas mass given the steep outer slope of the NFW profile).
For some of the groups and clusters it is possible to compare the masses inferred from using the X-ray data and optical velocity dispersion data. We found that the agreement is very good for all clusters while for some groups, especially those whose X-ray emission is not centered and smooth, the resulting dispersions are smaller than those derived from kinematics, which in turn results in smaller virial masses. When the disagreement is strong we remove the group from the sample as this might indicate an unbound or, at least, non virialized system. We caution that the groups are the most uncertain among the datasets; the extent of the X-ray emission is limited by instrumental sensitivity and in general a smaller fraction of the virial radius is probed (Mulchaey & Zabludoff 1998). As a consequence, the estimated gas masses for groups are simply lower limits.
3 The extended baryonic mass-velocity relation
In Figure 1 we show that a baryonic mass-velocity relation holds across the entire range of scales of virialized objects. The line shown follows the expected mass-velocity relation of dark halos in a CDM model, where . To derive the latter we calculate the baryonic mass at any given value of the circular velocity as , where is the universal baryon fraction, whose best estimate is (Spergel et al. 2003), and is the virial mass at a given expected for virialized halos in a standard CDM model.
As shown in Figure 1, data and theory can be brought into a reasonable agreement once the correction for both the added baryonic mass and the adiabatic contraction of the halo are properly taken into account, contrary to previous claims (MC00). We stress that applying the correction for the adiabatic contraction of the halos is essential to reach consistency with the theoretical curve at galaxy scales. We also note that the correction accounting for different halo concentrations depends on the normalization of the power spectrum, hence on . Here we assumed , lower/higher values will yield less/higher concentrated halos and thus a smaller/bigger correction to the observed , respectively. Although a mean relation exists, the data deviate from the simplest theoretical prediction at group scales (near km/s) and at the scale of the smallest dwarf galaxies, corresponding to km/s (in particular, the best-fit curve at small scales would have a steeper slope, around -3.4). In both cases the deviation can be seen as a deficit of baryons at a given value of the circular velocity (the opposite interpretation, namely an overestimate of the circular velocity, is highly unlikely, at least for galaxies, as the observed velocities have been reduced as much as possible following the assumption that the data yield - if some of the rotation curves are still rising we would be underestimating ).
The deviation and increased scatter at dwarf galaxy scales can be easily explained as a result photoionization by the UV background at high redshift. Semi-analytical models and numerical simulations (Quinn, Katz & Efstathiou 1996; Benson et al. 2002a,b; Bullock et al. 1999; Thoul & Weinberg 1996) suggest that gas collapse might have been substantially inhibited for objects with km/s once reionization begins. At even lower circular velocities evaporation of gas that had already collapsed might also take place (Barkana & Loeb 1999; Shaviv & Dekel 2003). These previous results may need some re-interpretation in light of a possible early epoch of reionistation suggested by WMAP (Spergel et al. 2003)
In Figure 1 we compare our results with the predictions from some of the highest resolution simulations of early galaxy formation that include the cosmic UV background (Tassis et al. 2003). We observe a good agreement between the observations and simulations in both the scatter and deficiency of baryons within small galaxies.
Simulations from the same authors that also include the effect of thermal and kinetic heating by supernovae find that the minimum baryonic masses would be up to three orders of magnitudes lower than shown in Figure 1. This is also similar to the semi-analytic model predictions discussed later.
One could argue that our analysis is missing galaxies with very low baryon fractions simply because they would be too faint to be seen. These objects might be purely gaseous or nearly optically dark; a significant population of the gas-rich objects in the local Universe seems to be ruled out by recent wide-field HI surveys (Zwaan et al. 2003), but the second possibility cannot be excluded at the moment.
The simulations of Tassis et al. (2003) that include strong supernovae feedback predict that even fairly bright spiral galaxies, with masses well in excess of , corresponding to km/s, would have an average baryon fraction almost an order of magnitude lower than the cosmological value, lying well below the relation reported in Figure 1.
Therefore our results suggest that supernovae winds do not eject significant baryonic mass from galaxies. This, however, does not mean that feedback is not important as a regulating mechanism for the ambient gas temperature and density, and thus for star formation, in galaxies both small and large.

It is notable that the baryonic Tully-Fisher has such a small scatter across most of the galaxy population. As already pointed out by MC00, variations of the stellar mass-to-light ratio due to different star formation histories would already account for most of the scatter along the vertical axis, leaving little room for variation in the IMF of stars. Along the horizontal axis, a scatter of 0.4 in log would be expected if, at a fixed value of the concentration, we vary in the range and in the range . These variations in the main parameters controlling disk formation inside dark halos already account for the entire scatter in the plot at km/s.
Cosmic scatter in the structure of dark halos alone, which translates into a possible range for the concentration of halos at a given mass, is expected to produce an additional scatter of roughly 0.2-0.3 in log( (Bullock et al. 2001), and therefore globally we would expect data points to be more scattered than they actually are. A similar problem was already argued by Bullock et al. (2001) for the Tully-Fisher relation. However, at least in our datasets, the galaxies considered are only late-type objects. Spheroidal components are never dominant and this eliminates a large portion of the available parameter space, and thus of the scatter. In particular, both low spin objects () and systems with very high disk mass fractions () may transform into early-type spirals or S0 galaxies as a substantial fraction of their disk mass transforms into a bulge because of bar formation and secular bar evolution (Combes et al. 1990; Mo et al. 1998). Considering the restricted parameter space (, ), the scatter along the horizontal axis due to variations in the conditions of disk formation reduces to less than 0.2 in log, leaving room for the other possible sources of scatter.
The deviation at group scales is also interesting, although the interpreation is hindered by the small size of the sample considered here. One possibility is that groups contain a substantial mass of gas at temperatures K that has not been observed because it falls below the detection limits of current instruments (Mulchaey & Zabludoff 1998;Burstein & Blumenthal 2002). Alternatively, pre-heating and evaporation of gas induced by winds from AGNs, with an effective reduction of the gas masses bound to the groups, can be invoked (Silk & Rees 1998; Bower et al. 2001). Indeed, in a scenario where there is a strong link between the formation of spheroids and supermassive black holes (Ferrarese & Merritt 2000), we can imagine that X-ray bright groups like those considered here would be affected most. We also note that even at cluster scales several points lie slightly below the theoretical curve. This might indicate that some fraction of the baryonic matter is in a warm undetected phase even at these scales, as recently argued by Ettori (2003).
4 The baryon pie
If galaxies have most of their baryons locked in their disks it might seem odd that observational measurements of the baryonic mass function of galaxies indicate that the latter contribute only a tenth of the total amount of baryons expected in the Universe (e.g. Bell et al. 2003). However, the question here is how large a contribution do galaxies make to the total (dark + baryonic) mass of the Universe in the first place?
We use a large high-resolution N-Body simulation to estimate the contribution of different mass scales to the total mass in a representative volume of the Universe. The CDM simulation (Reed et al. 2003) has a box of side 50 Mpc-1 and the particle mass is , such that it has enough resolution to probe objects as small as the most massive dwarf galaxies in the Local Group (a few times ).
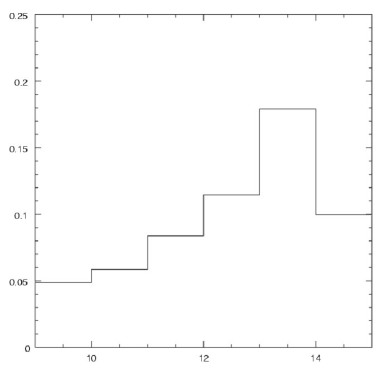
At we integrate the mass function in different mass bins (Figure 2) and find for the following broad mass scales:
Galaxies: 13%.
Groups: 30%.
Clusters 10%.
Note that among the galaxies we have not included bound systems with masses . These are found in the simulation and contribute another to the total mass. However, even assuming that they have a cosmological baryon fraction they would have baryonic masses lower than the lower limit in the analysis of Bell et al. (2003). In addition, as we explained above, at these mass scales ( km/s) the effect of photoionization is important - gas that might have collapsed at these scales will more likely end up contributing to a diffuse IGM component (see below).
Bell et al.(2003), by measuring the mass in stars and cold gas within galaxies (hence at the baryonic mass in their disks), find that the contribution of galaxies to the baryon budget is around and interpret this as a low efficiency for galaxy formation. However, this number is quite close to the 13% that we would estimate here for the expected contribution of galaxies to the baryonic pie under the assumption that they captured the cosmological baryon fraction. In fact, galaxies will contribute a fraction to the total baryonic content of the Universe, where is the baryonic fraction in galaxies, is the cosmological baryonic fraction, and is the fractional mass contribution of galaxy-scale objects to the total. If we assume , using the above estimate for , namely , it also follows that . This actually indicates a high efficiency for galaxy formation.
It is likely that galaxies have a substantial component of hot gas in an extended halo, material that is still cooling inwards onto the disk. Evidence for the existence of this component is gradually accumulating, at least for the Milky Way, thanks to new observations of OVI and X-ray absorption (Sembach et al. 2003a,b; Nicastro et al. 2003; Kalberla & Kerp 2001). These observations suggest that the hot gas could have a density of up to atoms cm-3 between 50 and 100 kpc and that its temperature at these distances is less than K. Further evidence for a hot halo with this density comes from the hydrodynamical model for the LMC-Halo interaction and the Magellanic Stream (Mastropietro et al., 2003). Assuming that the hot gas profile follows the dark matter (NFW) profile its total mass would be about 30% of the disk mass, or 25% of the sum of both components. If of the galactic baryons are in the this diffuse halo component, then the fraction of baryons locked into the cold phase , namely in the disk of stars and gas, will be less than , in even betteragreement with the estimate of Bell et al. (2003), who are indeed neglecting any baryonic component outside the disks.
Groups of galaxies potentially hold the largest fraction of baryons in virialised structures, whilst clusters of galaxies (defined by mass above) would contribute only about . We caution that, due to the modest box size, statistical Poisson fluctuations in the mass function of objects are of order at the group scale and up to at the cluster scale (see Reed et al. 2003). Even so, groups would always be the most important contribute most of the mass. The importance of groups for the baryon budget has been noted by many authors in the past, among them Fukugita, Hogan & Peebles (1998).
It is now apparent why clusters and groups contain more baryons in gas than the sum of the galaxies that formed these systems. The volume from which clusters collapse is large enough to capture a large fraction of the low density IGM thus giving a final high fraction of diffuse gas.
In the CDM simulation there is also about of diffuse mass, which is outside of (resolved) virialized structures. While this diffuse dark matter component would certainly collapse in smaller structures at even higher resolutions (Moore et al. 1999) most of these small halos are expected to be dark, thereby not contributing to the baryon budget. Indeed, within halos of masses (the lower limit is given by the cosmological Jeans mass) baryons can cool via molecular hydrogen at very high redshift () but would immediately photo-dissociate H, halting baryonic collapse until they achieve masses in the range (corresponding to a virial temperature K) and can cool via atomic hydrogen (Haiman, Thoul & Loeb 1996; Haiman, Abel & Rees 2000; Haiman 2003).
At later times low mass halos may reionize the intergalactic medium, suppressing the collapse of baryons at scales up to . Therefore the diffuse mass in our simulations should mostly trace a truly diffuse IGM baryonic component. This latter component together with gas inside, or eventually, expelled from groups by AGNs should make up the dominant contribution to the baryon budget, about according to our numbers. A substantial amount of ”warm” gas ( K K) outside virialized structures would indeed explain the soft X-ray background (Cen & Ostriker 1999; Dave et al. 2001). The same reasoning and baryon fractions in the different components would also apply to warm dark matter, or other models that have reduced power on small scales (below ).
5 Discussion
We have shown that a relation between the mass of baryons and the depth of the potential well holds across a wide range of scales, from the smallest dwarf galaxies to galaxy clusters. The mean relation is consistent with the mass-velocity relation expected for most cosmological models in which dark matter halos grow and collapse through gravitational instability. Deviations from the mean relation at the scale of dwarf galaxies are explained as a result of heating/evaporation from the UV background at high redshift, while at group scales we cannot exclude a role of feedback from AGNs (Silk & Rees 1998; Kaiser & Binney 2003). Our results argue against the existence of the ”strong form” of supernovae feedback, namely that capable of substantial removal of baryons in dwarfs (Dekel & Silk 1986; Dekel & Woo 2003).
We believe that it will be an interesting challenge for the standard concordance CDM model to reproduce both the baryonic mass function presented here whilst also producing a luminosity (and HI) function of galaxies with a reasonably flat faint end slope. Most models in which the dark matter is a collisionless component predict a mass function of dark matter halos which is much steeper than the luminosity function of galaxies. These models rely on strong feedback to give rise to a mass dependent mass-to-light ratio to flatten the observed luminosity function of halos – photoionization alone is not enough (see Benson et al. 2003).

In Figure 3 we compare our results with the predictions of the Durham semi-analytic galaxy formation models that include both photoionization and supernovae winds (Benson et al. 2002a,b; Cole et al. 2000). In the latter model, a large fraction of the energy of supernovae explosions is converted into kinetic energy, suppressing gas cooling and star formation in halos with low values of , as in the numerical simulations of galaxy formation by Navarro & White (1993). This has the expected result of reproducing reasonably well the faint end of the galaxy luminosity function. This form of feedback is not as strong as the superwinds in Benson et al. (2003), which can remove gas even in bright () galaxies, but still produces objects whose baryonic content falls short of that predicted by the baryonic mass-velocity relation (see Figure 3). The same models do indeed provide a better fit (within a factor of 2) to the I-band Tully-Fisher relation, which of course uses only the luminosities of galaxies (see Figure 7 in Cole et al. 2000); indeed strong feedback will remove most of the gas in dwarf galaxies - a larger discrepancy shows up in the baryonic Tully-Fisher simply because gas accounts for most of the baryons in observed dwarfs (MC00). We note that models with a truncated power spectrum at small mass scales such as would be produced by free streaming of a kev particle or through an interaction between the dark matter and photons (Boehm et al 2002) might be able to reproduce these observed correlations. These models should preserve the same scaling properties that allowed us to fit the baryonic mass-velocity relation down to galaxy scales, but would naturally lower the number of low mass halos such that the mass function has a linear relation to the luminosity function.
A caveat in the results presented here is that measurements of both the peak velocity and the baryonic masses of galaxies are subject to several uncertainties, especially in the case of dwarf galaxies. A factor of two variation in the stellar masses of galaxies is indeed easily achieved by changing the IMF of stars (Cole et al. 2001). In additions, the data for the faintest galaxies included in our sample (Stil & Israel 2002a,b; Mateo 1998) do not extend far from the center such that some have rotation curves that are not clearly flat at the last measured point. In the smallest galaxies the velocity field of the gas is quite chaotic and is dominated by random motions in the outer part (for example GR8, see Carignan, Freeman & Beaulieau 1991) such that the association of the measured velocity with is uncertain. In these cases we cannot exclude that we are only probing the inner part of a much bigger system with much higher velocity, which would move the data points to the right in Figure 3, towards the predictions of the semi-analytical models. A similar argument has been made by Stoher et al. (2002) to fix the comparison between the observed number of galactic satellites and that predicted in the CDM model. As a simple exploration of where the data points would lie if we push the systematic effects in favour of cold dark matter models, in Figure 4 we show the data points after allowing both a factor of 2 increase in the true halo virial velocity (this being quantitatively consistent with the predictions of Stoher et al.) and a factor of 2 decrease in the stellar mass of galaxies due to a different IMF - the correction to the velocity is applied only to galaxies with measured velocities km/s since these have the more poorly determined rotation curves. In this case there is a much better agreement with the predictions of semi-anaytical models, but still not a perfect overlap.

How does our Galaxy fit in the picture presented so far? According to the results of Figure 1, the Milky Way, in order to be ”typical” for a baryonic mass , as suggested by its K-band luminosity (Kochanek et al. 2002), must have km/s, and a total virial mass . Such a model for the Milky Way is plausible based on its rotation curve and on the other observational constraints available, and in particular, is in agreement with the most baryonic dominated, maximum disk models (Klypin, Zhao & Somerville 2002; Wilkinson & Evans 1999). The additional of hot gas in the halo suggested by the LMC kinematics, FUSE and ROSAT data would imply that we have accounted for all the expected baryons in the Galaxy.
Our analysis does not include individual elliptical galaxies (these of course enter in the global estimates of baryonic masses in groups and clusters). Interestingly, a recent paper by Padmanabhan et al. (2003), which uses photometry and kinematics of almost 30.000 elliptical galaxies with velocity dispersions larger than km/s taken from the Sloan Digital Sky Survey, finds that the dynamical to stellar masses are between 7 and 30. Taking into account that a typical elliptical galaxy also has a significant hot gaseous X-ray halo, they conclude that these galaxies appear to have captured close to the cosmological baryon fraction, in agreement to what we find here for other types of galaxies.
An additional piece of this complex puzzle is the relationship with the dynamical mass estimates of field galaxies from weak lensing (McKay et al 2001, Guzik & Seljak 2002). Weak lensing should provide the strongest constraints on the total mass-to-light ratios of galaxies. McKay et al. (2001) obtained extremely high average mass-to-light ratios, roughly around . However, more recently Guzik & Seljak reanalysed the same SDSS data set taking into account the effects of clustering and cosmologically motivated models for the halo density profiles. At , they find a virialised dark matter halo to baryon mass ratio of 10. They also comment that this implies a high efficiency in the conversion of baryons to stars. In other words, the weak lensing data also imply that galaxies have captured the expected baryon fraction and that feedback has been inefficient at preventing star formation and has not ejected a large fraction () of baryons into the IGM.
We thank Darren Reed, Fabio Governato and Tom Quinn for allowing us to use their CDM simulation, Andrew Benson, Carlos Frenk and the other members of the Durham theory group for providing us with the results of the Durham semi-analytical models and for stimulating discussions. We also thank Frank Van den Bosch and Andi Burkert for helpful comments on an earlier version of the paper and George Lake for numerous discussions on feedback.
References
- [] Barkana, R., & Loeb, A., 1999, ApJ, 523, 54
- [] Blumenthal, G. R., Faber, S. M., Flores, R., Primack, J. R. 1986, ApJ, 301, 27
- [1] Bell, E.F., McIntosh, D.H., Katz, N., Weinberg, M.D., 2003, ApJ, 585, L117
- [] Benson, A, J., Lacey, C.G., Baugh, C.M., Cole, S., Frenk, C.S. 2002a, MNRAS, 333, 156B
- [] Benson, A, J., Frenk, C.S., Lacey, C.G., Baugh, C.M., & Cole, S. 2002b, MNRAS, 333, 177B
- [] Benson, A.J., Bower, R.G., Frenk, C.S., Lacey, C.G., Baugh, C.M., & Cole, S., submitted to ApJ (astro-ph/0302450)
- [] Binney, J., & Tremaine, S., 1987, Galactic Dynamics (Princeton University Press: Princeton)
- [] Blais-Ouellette, S., Amram, P., & Carignan, C., 2001, AJ, 121, 1952
- [] Boehm, C., Riazuelo, A., Hansen, S.H., & Schaeffer, R., Phys.Rev.D., 2002, 66, 083505
- [] Borgani, S., Governato, F., Wadsley, J., Menci, N., Tozzi, P., Quinn, T., Stadel, J., Lake, G., 2002, MNRAS, 336, 409
- [] Bower, R. G., Benson, A. J., Lacey, C. G., Baugh, C. M., Cole, S., & Frenk, C. S., 2001, MNRAS, 325, 497
- [] Bullock, J.S., Kravtsov, A.V., & Weinberg, D.H., 2000, ApJ, 539, 517
- [] Bullock, J. S., Kolatt, T.S., Sigad, Y., Somerville, R.S., Kravtsov, A.V., Klypin, A.A., Primack, J.R., Dekel, A. 2001, MNRAS, 321, 559
- [] Burstein, D., & Blumenthal, G., 2002, ApJ, 574, L17
- [] Carignan, C., Beaulieu S., & Freeman, K.C., 1990, AJ, 99, 178
- [] Cen, R., & Ostriker, J.P., 1999, ApJ, 514, 1
- [] Cole, S., Lacey, C.G., Baugh, C.M., Frenk, C.S., 2000, MNRAS, 319, 168
- [] Cole, S., et al., 2001 MNRAS, 326, 255
- [] Combes, F., Debbasch, F., Friedli, D., Pfenniger, D., 1990, A&A, 233, 82
- [] Dave, R. et al., 2001, ApJ, 552, 473
- [] de Blok, W.J.G., McGaugh, S.S., Rubin, V.C., 2001a, A&A, 122, 2381
- [] de Blok, W.J.G., McGaugh, S.S., Rubin, V.C., 2001b, A&A, 122, 2396
- [] de Blok, W.J.G., Bosma, A., 2002, A&A, 385, 816
- [] de Jong, R.S., 1996, A&A, 313, 377
- [] Dekel, A., Silk,, J., 1986, ApJ, 303
- [] Dekel, A., & Woo, J., 2002, submitted to MNRAS, astro-ph/0211118
- [] Ettori, S., & Fabian, A., 1999, MNRAS, 305, 834
- [] Ettori, S., De Grandi, S., Molendi, S., 2002, A&A, 391, 841
- [] Ettori, S., 2003, MNRAS, 344, L13
- [] Ferrarese, L., & Merritt, D., 2000, ApJ, 539, L9
- [] Fukugita, M., Hogan, C.J., & Peebles, P.J.E., 1998, ApJ, 503, 518
- [] Gardner, J.P. 2001, ApJ, 557, 616
- [] Gnedin, N.Y., 2000, ApJ, 535, 530
- [] Gonzalez, A. H.; Williams, K. A., Bullock, J. S., Kolatt, T. S., Primack, J.R., 2000, ApJ, 528, 145
- [] Governato, F., Mayer, L., Wadsley, J., Gardner, J.P., Willman, B., Hayashi, E., Quinn, T., Stadel, J., & Lake, G., 2002, submitted to ApJ, astro-ph/0207044
- [] Guzik, J., Seljak, U., 2002, MNRAS, 335, 311
- [] Haiman, Z., Thoul, A., & Loeb, A., ApJ, 464, 523
- [] Haiman, Z., Abel, T., & Rees, M.J., ApJ, 2000, 534, 11
- [] Haiman, Z., in “The Mass of Galaxies at Low and High Redshift”, Proceedings of the ESO Workshop held in Venice, Italy, 24-26 October 2001, p. 316
- [] Jimenez, R., Verde, L., & Oh, S.Peng, 2003, MNRAS, 339. 243
- [] Kaiser, C.R., & Binney, J., 2003, MNRAS, 338, 837
- [] Kalberla, P.M.W., & Kerp, J., 1999, in “Stromlo Workshop on High-Velocity Clouds”, eds. Gibson, B.K. & Putman, M.E., ASP Conference Series Vol. 166, p. 170
- [] Kauffmann, G., White, S.D.M., & Guiderdoni, B., 1993, MNRAS, 264, 201
- [] Klypin, A., Zhao, H., & Somerville, R.S., 2002, ApJ, 573, 597
- [] Kochanek, C.S., Pahre, M.A., Falco, E.E., Huchra, J.P., Mader, J., Jarrett, T.H., Chester, T., Chutri, R., Schneider, S.E., 2001, ApJ, 560, 566
- [] Lemson, G., Kauffmann, G., 1999, MNRAS, 302, 111
- [] Mac Low, M., & Ferrara, A., 1999, ApJ, 513, 142
- [] Mastropietro, C., Moore, B., Mayer, L., Stadel, J., & Wadsley, J., 2003, in “Satellites and Tidal Streams”, La Palma 26-30 May 2003, Spain, eds, F. Prada, D. Martínez-Delgado, T. Mahoney, in press
- [] McGaugh, S.S., Schombert, J.M., Bothun, G.D., de Blok, W.J.G., 2000, ApJ, 533, L99
- [] Mateo, M.I., 1998, ARA&A, 36, 435
- [] Mayer, L., Governato, F., Colpi, M., Moore, B., Quinn, T., Wadsley, J., Stadel, J., Lake G. 2001b, 559, 754
- [] McKay, et al. 2002, submitted to ApJ (astro-ph/0108013)
- [] Mo, H.J., Mao, S., White, S.D.M. 1998, MNRAS, 96, 847
- [] Moore, B., Ghigna, S., Governato, F., Lake, G., Quinn, T., Stadel, J., & Tozzi, P., 1999, ApJ, 524, L19
- [] Mori, M., Ferrara, A., & Madau, P. 2002, ApJ, 571, 40
- [] Mulchaey, J. S., Davis, D. S., Mushotzky, R F., & Burstein, D., 1996, ApJ, 456, 80
- [] Mulchaey, J.S, & Zabludoff, A.I., 1998, ApJ, 496, 73
- [] Navarro, J., & White, S.D.M., 1993, ApJ, 265, 271
- [] Navarro J.F., Frenk C.S., White S.D.M., 1995, MNRAS, 275, 56
- [] Navarro J.F., Frenk C.S. White, S.D.M. 1997, MNRAS, 490, 493
- [] Navarro, J., Steinmetz, M., 2000, ApJ, 538, 477
- [] Nicastro, F., et al. 2003, Nature, 421, 719
- [] Padmanabhan, N., et al., submitted to New Astronomy, astro-ph/0307082
- [] Reed, D., Gardner, J., Quinn, T., Stadel, J., Fardal, M., Lake, G., & Governato, F., 2003, to appear on MNRAS, astro-ph/0301270
- [] Quinn, T., Katz, N., & Efstathiou, G., 1996, MNRAS, 278, L49
- []
- [] Schombert, J. M., McGaugh, S. S.; Eder, J.A., 2001, AJ, 121, 1420
- [] Sembach, K. R. et al. 2003, ApJS, 146, 165
- [] Shaviv, N.J., & Dekel, A., submitted to MNRAS, astro-ph/0305527
- [] Silk, J., & Rees, M.J., 1998, A&A, 331, L1
- [] Spergel, D.N., et al., 2003, ApJS, 148, 175
- [] Steinmetz, M., & Navarro, J., 2002, NewA, 7, 155
- [] Stil, J.M., & Israel, F.P., 2002, A&A, 389, 29
- [] Stil, J.M., & Israel, F.P., 2002, A&A, 389, 42
- [] Stoehr, F., White, S.D.M., Tormen, G., & Springel, V., 2002, MNRAS, 335, L84
- [] Swaters, R.A., Madore, B.F., van den Bosch, F.C., Balcells, M., 2003, ApJ, 583, 732s
- [] Swaters, R.A., Verheijen, M.A.W., Bershady, M.A., & Andersen, D.R., 2003, ApJ, 587, L19
- [] Taffoni, G., Mayer, L., Colpi, M., & Governato, F., 2003, MNRAS, 341, 434
- [] Thacker, R.J., Couchman, H.M.P., 2001, ApJ, 555, L17
- [] Tassis, K., Abel, T., Bryan, G.L., Norman, M.L., 2003, ApJ, 587, 13
- [] Thoul, A.A., & Weinberg, D.H. 1996. ApJ, 466, 608
- [] Tully, R. B.& Fisher, J. R, 1977, A&A, 54, 661
- [] Van den Bosch, F.C.,& Swaters, R.A., 2001, MNRAS, 325, 101
- [] Verheijen, M.A.W., 1997, PhD thesis, Univ. of Groeningen
- [] White, S.D.M., & Rees, M.J., 1978, MNRAS, 183, 341
- [] White, S.D.M., & Frenk, C.C., 1991, ApJ, 379, 52
- [] Wilkinson, M.I., & Evans, N.W., 1999, MNRAS, 310, 645
- [] Zwaan, M.A., et al., 2003, AJ, 125, 2842