Radio Monitoring of Supernova 2001ig:
The First Year
Abstract
Supernova 2001ig in NGC 7424 has been observed with the Australia Telescope Compact Array at 2 week intervals since its discovery, making this the best-studied Type IIb radio supernova since SN 1993J. We present radio light curves for frequencies from 1.4 to 20 GHz, and preliminary attempts to model the observed behaviour. Since peaking in radio luminosity at 8.6 and 4.8 GHz some 1-2 months after the explosion, SN 2001ig has on at least two occasions deviated significantly from a smooth decline, indicative of interaction with a dense circumstellar medium and possibly of periodic progenitor mass-loss.
1 Introduction
On the evening of Dec 10 2001, the Rev. Robert Evans found his 39th supernova from his home in the Blue Mountains, west of Sydney evans01 . SN 2001ig lies in the outskirts of the SAB(rs)cd galaxy NGC 7424, at a distance of 11.5 Mpc tu88 . Early optical spectroscopy with the 6.5 m Baade Telescope by Matheson & Jha mj01 highlighted several similarities between SN 2001ig and the Type IIb SN 1987K fil88 . In the months following, the spectral evolution of SN 2001ig began to resemble more and more that of the “prototypical” Type IIb SN 1993J, as the H recombination lines faded cp01 ; clo02 , and eventually disappeared fc02 .
During a Director’s Discretionary Time observation, SN 2001ig was detected by the ACIS-S instrument on board the Chandra X-ray Observatory on 2002 May 22 UT. A total of 30 counts was recorded in 23400 sec of integration, corresponding to a 0.2-10.0 keV luminosity erg s-1 sr02 .
Since its commissioning, the Australia Telescope Compact Array (ATCA)111The Australia Telescope is funded by the Commonwealth of Australia for operation as a National Facility managed by CSIRO. has played a leading role in the monitoring of several supernovae at radio wavelengths, most notably SN 1987A lss92 , SN 1978K sdr93 ; ems99 , and SN 1998bw/GRB980425 wkf99 . As SN 2001ig was too far south to allow effective monitoring with the Very Large Array (VLA) in its most compact (D) configuration at the time, we commenced observations with the ATCA within a week of its discovery, and have been following it on a regular basis since then.
2 Radio Light Curves
Our first ATCA observations of SN 2001ig over 6 hours on 2001 Dec 15 UT yielded a positive detection at 8.64 GHz, and a marginal detection at 4.79 GHz sr01 . On 2001 Dec 31 UT, we detected SN 2001ig using a prototype 18.8 GHz receiver system on just three ATCA antennas. Observations have been carried out with a 128 MHz bandwidth, centered on the primary frequencies of 8.64, 4.79, 2.50, and 1.38 GHz, supplemented by some higher frequency data from both the ATCA and the VLA. The primary flux calibrator for the ATCA data is PKS B1934-638, while the source PKS B2310-417 serves as the secondary gain and phase calibrator. The primary beam around SN 2001ig happens to include an adjacent background source just away, which has also proved useful for gain calibration when phase stability was poor, or hour-angle coverage limited. Figure 1 presents our entire dataset up to 2003 March 16.

The radio “light curve” of a supernova typically proceeds through three phases – a rapid turn-on, with a spectral index which is inverted ( or steeper, where ) due to absorption along the line-of-sight; followed by a peak in the flux density, firstly at the higher frequencies; then a more gradual decline in the optically-thin phase, with a non-thermal spectral index. By the end of February 2002, SN 2000ig had already peaked at frequencies of 8.64 GHz and 4.79 GHz. However, in early March, the fluxes at these two frequencies jumped by a factor of 2, and remained almost constant for the next two months, before resuming their decline. In August 2002, there was another short but significant pause in the decline. Similar, but less-pronounced deviations are also apparent in the data at 2.50 and 1.38 GHz.
Superimposed on Fig. 1 are model fits to the multi-frequency dataset, based on the “minishell” model of che82 , as parameterised by kw02 :
Here is the flux density, and the attenuation by a homogeneous, and a clumpy absorbing medium respectively, at a frequency of 5 GHz one day after the explosion date ; is the spectral index; the rate of decline in the optically-thin phase; while and describe the time dependence of the optical depths in the homogeneous, and clumpy circumstellar medium (CSM) respectively. By constraining the model fits using only the data leading up to the high-frequency turnover, as well as the late-time decay, we can at least compare the global characteristics of this event with those of the best-studied Type IIb supernova, SN 1993J (Table 1, svd03 ). We note that despite the temporary “boosts” in the radio flux, the overall rate of decline in SN 2001ig is still much faster than SN 1993J. Furthermore, while the model correctly predicted a 5 GHz peak luminosity twice that of SN 1993J, it was not actually attained until after day 100.
| Parameter | SN 2001ig | SN 1993J |
|---|---|---|
| (mJy) | ||
| (erg s-1 Hz-1) |
3 Periodic mass-loss
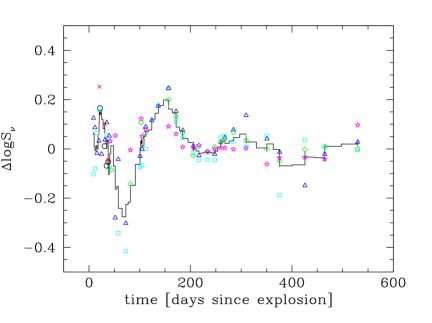
Bumps and dips in the radio light curve can arise from modulations in either the optical depth, or the CSM density structure (both of which are coupled to some extent) via enhanced mass-loss. Throughout all these events, the spectral index is relatively unaffected, which leads us to favour the latter mechanism. A constant implies that the percentage change in flux is the same at all frequencies, and this is illustrated in Fig. 2 on which is plotted the fractional deviation of the observed flux density from the best-fit model curves in Fig. 1, as a linear function of time. Figure 2 also highlights an apparent periodicity in CSM density enhancements, with the shock wave reaching the peak of the first at 150 days, a second peak near 300 days, and hints of a third peak between 400 and 500 days. For an ejecta expansion velocity of 15000 km s-1 and a stellar wind velocity of 10 km s-1, this would imply a series of shells 0.006 pc apart, ejected every 600 years or so. This is much longer than standard stellar pulsation timescales, but is not inconsistent with the period between thermal pulses (C/He shell flashes) in 5-10 M⊙ AGB stars ir83 .
Only SN 1979C has shown such regular structure in its radio light curve kw92 , though these variations eventually ceased mm00 . The proposed explanation was modulation of the red supergiant progenitor wind due to eccentric orbital motion with a 4000 year period about a massive companion. Acceleration of the progenitor near periastron would result in wind density enhancements superimposed on a pinwheel-like CSM structure, which can account for the periodicity in the radio emission sp96 . However, the variations will only be pronounced if the orbital plane is viewed from close to edge-on, which would then naturally account for why so few supernovae display such regular variations in their radio light curves.
Direct evidence for the existence of binary-generated spiral shocks comes from near-infrared aperture-masking interferometry on the Keck I telescope of the Wolf-Rayet stars WR 104 tmd99 and WR 98a mtd99 . Both sources show pinwheel-shaped nebulae, which are attributed to dust forming where the stellar winds of the WR star and an OB-type companion collide, then splaying outward. These sources may represent local, compact analogs of the CSM structure that is currently being swept up by the expanding blast wave from SN 2001ig.
Acknowledgements: We are grateful to the staff of the ATNF Paul Wild Observatory for their assistance with the ATCA observations.
References
- (1) R. O. Evans: IAU Circ. 7772 (2001)
- (2) R. B. Tully: Nearby Galaxies Catalog (Cambridge University Press, Cambridge 1988)
- (3) T. Matheson, S. Jha: IAU Circ. 7772 (2001)
- (4) A. V. Filippenko: AJ 96, 1941 (1988)
- (5) A. Clocchiatti, J. L. Prieto: IAU Circ. 7781 (2001)
- (6) A. Clocchiatti: IAU Circ. 7793 (2002)
- (7) A. V. Filippenko, R. Chornock: IAU Circ. 7988 (2002)
- (8) E. M. Schlegel, S. D. Ryder: IAU Circ. 7913 (2002)
- (9) L. Staveley-Smith, R. N. Manchester, M. J. Kesteven et al: Nature 355, 147 (1992)
- (10) S. D. Ryder, L. Staveley-Smith, M. A. Dopita et al: ApJ 416, 167 (1993)
- (11) E. M. Schlegel, S. D. Ryder, L. Staveley-Smith et al: AJ 118, 2689 (1999)
- (12) M. H. Wieringa, S. R. Kulkarni, D. A. Frail: A&AS 138, 467 (1999)
- (13) S. D. Ryder, K. Kranz, E. Sadler, R. Subrahmanyan: IAU Circ. 7777 (2001)
- (14) R. Chevalier R.: ApJ 259, 302 (1982)
- (15) K. W. Weiler, N. Panagia, M. Montes, R. A. Sramek: ARA&A 40, 387 (2002)
- (16) S. Van Dyk: these proceedings (2003)
- (17) I. Iben I., A. Renzini: ARA&A 21, 271 (1983)
- (18) K. W. Weiler, S. D. Van Dyk, J. E. Pringle, N. Panagia: ApJ 399, 672 (1992)
- (19) M. J. Montes et al: ApJ 532, 1124 (2000)
- (20) D. H. Schwarz, J. E. Pringle: MNRAS 282, 1018 (1996)
- (21) P. G. Tuthill, J. D. Monnier, W. C. Danchi: Nature 398, 487 (1999)
- (22) J. D. Monnier, P. G. Tuthill, W. C. Danchi: ApJ 525, L97 (1999)