HUBBLE SPACE TELESCOPE/WFPC2 INVESTIGATION OF THE NUCLEAR MORPHOLOGY IN THE TOOMRE SEQUENCE OF MERGING GALAXIES11affiliation: Based on observations made with the NASA/ESA Hubble Space Telescope, obtained at the Space Telescope Science Institute, which is operated by the Association of Universities for Research in Astronomy, Inc., under NASA contract NAS 5-26555. These observations are associated with proposal #8669.
Abstract
We report on the properties of nuclear regions in the Toomre Sequence of merging galaxies, based on imaging data gathered with the Hubble Space Telescope WFPC2 camera. We have imaged the 11 systems in the proposed evolutionary merger sequence in the F555W and F814W broad-band filters, and in H+[N II] narrow-band filters. The broad-band morphology of the nuclear regions varies from non-nucleated starburst clumps through dust-covered nuclei to a nucleated morphology. There is no unambiguous trend in the morphology with merger stage. The emission-line morphology is extended beyond the nucleus in most cases, but centrally concentrated (within 1 kpc) emission-line gas can be seen in the four latest-stage merger systems. We have quantified the intrinsic luminosity densities and colors within the inner 100 pc and 1 kpc of each identified nucleus. We find little evidence for a clear trend in nuclear properties along the merger sequence, other than a suggestive rise in the nuclear luminosity density in the most evolved members of the sequence. The lack of clear trends in nuclear properties is likely due both to the effects of obscuration and geometry, as well as the physical variety of galaxies included in the Toomre Sequence.
TO BE PUBLISHED IN THE DECEMBER 2003 ISSUE OF THE ASTRONOMICAL JOURNAL
1 INTRODUCTION
Disk galaxy mergers are believed to be responsible for triggering a variety of global and nuclear responses in galaxies. The global effects have been well documented, both with observations, starting with Zwicky’s extensive work (1950, 1956, 1964), and with numerical simulations, first convincingly demonstrated by Toomre & Toomre (1972). Work during the last decades strongly suggests that a fraction of elliptical galaxies has formed as a result of disk galaxy merging (see Schweizer, 1998, and references therein). The morphology of tidal tails has been used to trace the mass distribution in galactic halos (Dubinski, Mihos, & Hernquist, 1996; Mihos, Dubinski, & Hernquist, 1998; Springel & White, 1999), and the tails themselves are possible birthplaces of some dwarf galaxies (Barnes & Hernquist, 1992; Elmegreen et al., 1993; Duc & Brinks, 2001). Mergers have also been closely connected to luminous and ultraluminous infrared galaxies (Lonsdale, Persson, & Matthews, 1984; Joseph & Wright, 1985; Schweizer, 1990; Sanders et al., 1988a; Scoville et al., 2000; Borne et al., 2000).
Perhaps the most dramatic physical process associated with disk galaxy merging is the inflow of gas into the nuclear region and the consequent excitation of nuclear starburst and AGN activity. This process has been reported from simulations (Barnes & Hernquist, 1991; Mihos & Hernquist, 1994a; Barnes & Hernquist, 1996) and from observations (Joseph & Wright, 1985; Sanders et al., 1988a; Hutchings & Neff, 1992; Bahcall, Kirhakos & Schneider, 1995; Surace, Sanders & Evans, 2001). Whether the gas “hangs up” and forms stars in the inner kiloparsec, or continues to flow inward towards a putative AGN, has a strong impact on the luminosity and evolution of the merger. The details of the nuclear gasdynamics will depend on the structure of the host galaxies and the dynamical stage of the interaction (Mihos & Hernquist, 1996; Barnes & Hernquist, 1996). Several scenarios have been suggested in which interactions evolve from starburst-dominated to AGN-dominated regimes as the galaxies merge (Weedman, 1983; Sanders et al., 1988a; Veilleux et al., 1995).
Unfortunately, until now, both observations and numerical simulations have lacked the spatial resolution needed to study the evolution of the merging nuclei on scales smaller than a few hundred parsecs. For this reason, our understanding of how mergers fuel nuclear starburst and AGN activity, and drive galaxy evolution from the nucleus out, has remained woefully incomplete. Theoretical arguments suggest that the evolution of the merging nuclei is where the merger hypothesis for the formation of elliptical galaxies through disk galaxy mergers faces its most stringent test.
A wide variety of physical processes may shape the nuclei. Purely stellar dynamical merging alone would tend to produce diffuse nuclei with large cores and a very shallow nuclear surface brightness gradient (Hernquist, 1992) unless the progenitor nuclei were dense (Barnes, 1988). In the case of gas-rich disk galaxies, the dissipative flow of gas into the nuclei and accompanying star formation would tend to result in a steep luminosity profile (Mihos & Hernquist, 1994b) and a large central density, as seen in several young merger remnants (R. P. van der Marel et al., in preparation; see also figure 2 in van der Marel & Zurek 2000). The presence of a central supermassive black hole would also induce a strong nuclear power-law cusp (Young, 1980; Quinlan, Hernquist, & Sigurdsson, 1995). Yet if both galaxies contain supermassive central black holes which merge, the resulting black hole binary would act as a dynamical slingshot and eject stars from the center, thus lowering the stellar density there (Quinlan & Hernquist, 1997; Milosavljević & Merritt, 2001).
For these reasons we are undertaking a high resolution Hubble Space Telescope (HST) survey of the nuclear regions in a sequence of merging galaxies. The questions we want to answer include the following: 1. What is the morphology of the ionized gas distribution around the nucleus? Is it clumpy, diffuse and extended, ring-like, or compact and disk-like? Does this morphology depend on the interaction stage? 2. How is the current star formation, as revealed by the H line emission, distributed with respect to the young stellar populations as revealed by their blue color (and, eventually, spectra)? 3. How do the nuclear starbursts affect the radial color gradients of the merger remnants? The spatial resolution of the HST (10–50 pc in nearby systems) is required to investigate these questions, which are the focus of the current paper. In future papers, we will study the stellar populations, kinematics, and evolution of the merger-induced starbursts of the Toomre Sequence nuclei, using HST STIS spectra and NICMOS imaging.
2 GALAXY SAMPLE AND OBSERVATIONS
2.1 Sample
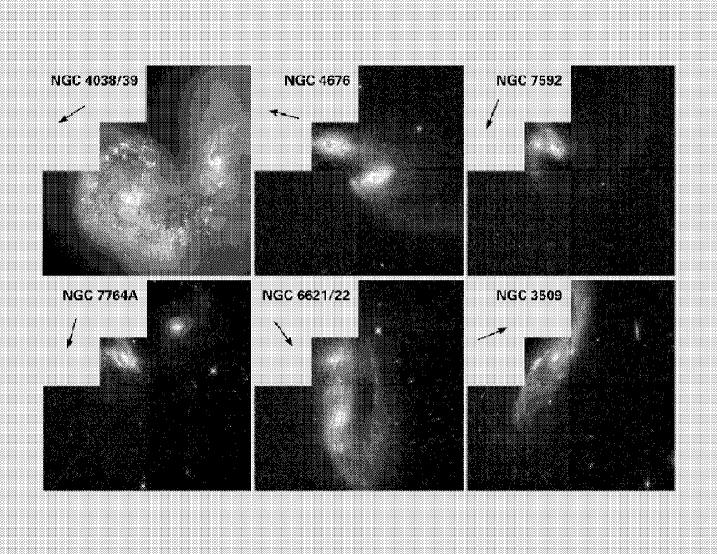
The Toomre Sequence (Toomre, 1977) is a sample of 11 relatively nearby (within 120 Mpc) interacting and merging disk galaxies, which have been arranged into a sequence according to the putative time before or since merging. These systems were chosen because they exhibit conspicuous tidal tails and “main bodies that are nearly in contact or perhaps not even separable” (Toomre, 1977). They span a range of dynamical phases, from galaxies early in the merging process (e.g., NGC 4038/39 and NGC 4676) to late-stage merger remnants (e.g., NGC 3921 and NGC 7252; see Figure 1 and Table 1). We want to emphasize the word “putative”, since the placing of a system in this sequence was based on the apparent degree of coalescence of the progenitor main bodies in low-resolution optical photographical plates, assuming that the progenitors resembled normal disk galaxies in the pre-encounter stage.
Because of the requirement of well-developed tidal tails, these systems have suffered, or are suffering, encounters that are most likely of prograde sense (with the disks rotating in the same sense as they orbit each other). In such a scenario, the orbits of interacting galaxies decay as the galaxies lose orbital energy and angular momentum via dynamical friction with their dark halos. Ultimately, the galaxies coalesce and form a single merger remnant. On these grounds we can call the Toomre Sequence an evolutionary sequence. Because it is an optically selected sample of merging galaxies, it suffers less from dust obscuration than infrared-luminous samples, allowing the nuclei to be studied at optical wavelengths. The Toomre Sequence has been widely investigated by ground-based observations (Joseph & Wright, 1985; Stanford & Bushouse, 1991; Hibbard & van Gorkom, 1996; Schweizer, 1998; Yun & Hibbard, 2001; Georgakakis et al., 2000), space-based observations (Fabbiano et al., 1997; Read & Ponman, 1998; Awaki et al., 2002; Zezas et al., 2002a, b), and numerical studies (Toomre & Toomre, 1972; Barnes, 1988; Stanford & Balcells, 1991; Mihos et al., 1993; Hibbard & Mihos, 1995; Barnes, 1998).
| Sequence Number | Galaxy | R.A. (J2000.0)aaCoordinates refer to the measured positions of the nuclei in our WFPC 2 images, except for Nuc 1 in NGC 520 where it was measured from a ground-based -band image (no clear nuclear position could be determined in our HST images). | Dec. (J2000.0)aaCoordinates refer to the measured positions of the nuclei in our WFPC 2 images, except for Nuc 1 in NGC 520 where it was measured from a ground-based -band image (no clear nuclear position could be determined in our HST images). | bbHeliocentric velocity, data taken from the NASA Extragalactic Database (NED), except for NGC 4676, for which the value was taken from the Lyon Extragalactic Database (LEDA). | Dist.ccDistance for . In cases where the two components have different systemic velocities, the distance to both is the average of the two Hubble law distances. | ddNuclear separation in arcseconds, calculated from the listed positions. | 01eeSpatial scale in pc corresponding to 01. | Dynamical |
|---|---|---|---|---|---|---|---|---|
| (hh mm ss.ss) | (dd°mm′sss) | (km s-1) | (Mpc) | (″) | (pc) | ModelffDynamical model means that an N-body simulation that tries to reproduce the observed structure and kinematics of the merger exists. | ||
| 1. | NGC 4038 | 12 01 53.06 | 18 52 01.3 | 1616 | 21.6 | 61.4 | 10 | YggBarnes 1988. |
| 1. | NGC 4039 | 12 01 53.54 | 18 53 09.3 | 1624 | 21.6 | 61.4 | 10 | YggBarnes 1988. |
| 2. | NGC 4676 NUC1 | 12 46 10.06 | +30 43 55.5 | 6613 | 88.2 | 37.1 | 43 | YhhBarnes 1998. |
| 2. | NGC 4676 NUC2 | 12 46 11.17 | +30 43 21.2 | 6613 | 88.2 | 37.1 | 43 | YhhBarnes 1998. |
| 3. | NGC 7592 NUC1 | 23 18 21.73 | 04 24 56.7 | 7280 | 97.1 | 13.0 | 47 | N |
| 3. | NGC 7592 NUC2 | 23 18 22.60 | 04 24 57.3iiThe position of Nuc 2 in NGC 7592 is highly uncertain, as it is very difficult to determine the location of the nucleus in the optical images. | 7280 | 97.1 | 13.0 | 47 | N |
| 4. | NGC 7764A | 23 53 23.74 | 40 48 26.3 | 9162 | 122.2 | 0 | 59 | N |
| 5. | NGC 6621 | 18 12 55.25 | +68 21 48.5 | 6191 | 84.4 | 41.7 | 41 | N |
| 5. | NGC 6622 | 18 12 59.74 | +68 21 15.1 | 6466 | 84.4 | 41.7 | 41 | N |
| 6. | NGC 3509 | 11 04 23.59 | +04 49 42.4 | 7704 | 102.7 | 0 | 50 | N |
| 7. | NGC 520 NUC1 | 01 24 34.89 | +03 47 29.9 | 2281 | 30.4 | 40.3 | 15 | YjjStanford & Balcells 1991. |
| 7. | NGC 520 NUC2 | 01 24 33.30 | +03 48 02.4 | 2281 | 30.4 | 40.3 | 15 | YjjStanford & Balcells 1991. |
| 8. | NGC 2623 | 08 38 24.11 | +25 45 16.6 | 5535 | 73.8 | 0 | 36 | N |
| 9. | NGC 3256 | 10 27 51.17 | 43 54 16.1 | 2738 | 36.5 | 0 | 18 | N |
| 10. | NGC 3921 | 11 51 06.96 | +55 04 43.1 | 5838 | 77.8 | 0 | 38 | N |
| 11. | NGC 7252 | 22 20 44.78 | 24 40 41.8 | 4688 | 62.5 | 0 | 30 | Y kkHibbard & Mihos 1995. |
2.2 Observations and Data Reduction
All images were taken with the WFPC2 camera onboard the HST. We used the F555W and F814W filters, which mimic the better-known - and -bands, with integration times of 320 seconds in each band, split into two exposures of 160 seconds to allow for cosmic ray rejection (see Table 2 for more information on the exposure times). Images in these bands for NGC 4038/39 (Whitmore et al., 1999), NGC 3921 (Schweizer et al., 1996), and NGC 7252 (Miller et al., 1997) already existed in the HST archive. We used those images in our current study. Narrow-band images covering the H+[N II] lines were taken with the F673N narrow-band filter in cases where the line emission from the target fell within the wavelength range covered by this filter (NGC 3509; NGC 7592), or otherwise with the Linear Ramp Filter (LRF). The LRFs have a bandwidth of about 1.3% of the central wavelength. The position of the galaxy on the CCD chip depends on the central wavelength and limits the field of view to about for the LRF. The list of the adopted filters, central wavelengths, and FWHM values of the filters together with integration times are given in Table 2. The Antennae, NGC 4038/39, was imaged earlier in the HST F658N H filter by Whitmore et al. (1999), and we used these data in our work.
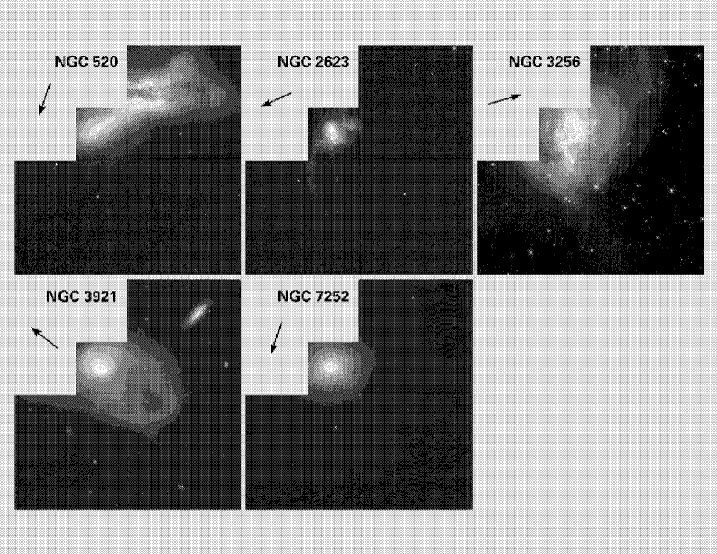
We employed the STSDAS task WFIXUP to interpolate (in the x-direction) over bad pixels as identified in the data quality files. We also used the STSDAS task WARMPIX to correct consistently warm pixels in the data, using the most recent warm pixel tables. The STSDAS task CRREJ was used to combine the two 160 second exposures. This step corrects most of the pixels affected by cosmic rays in the combined image. In general, a few cosmic rays remain uncorrected, mostly when the same pixel was hit in both exposures. Also, a small number of hot pixels remain uncorrected because they are not listed even in the most recent warm pixel tables. We corrected these with the IRAF task COSMICRAYS, setting the “threshold” and “fluxratio” parameters to values selected by a careful comparison of the images before and after correction, to ensure that only questionable pixels were replaced. The rest of the reduction was done with the standard WFPC2 pipeline tasks using the best reference files available. The LRF exposures were flat-fielded using the narrow-band F656N and F673N (whichever was closer in wavelength) flat fields. We also created mosaiced F555W and F814W images with the IRAF/STSDAS task WMOSAIC. Color composite mosaics of these images, which show the environment around the nuclei, and tidal tails in some systems, are displayed in Figure 1.
The photometric calibration, and conversion to Johnson - and -bands was performed according to guidelines in Holtzman et al. (1995). A -correction has not been applied to any of our measurements. Since the throughput of the narrow-band filters does not vary much at the wavelengths of the lines, it was possible to calibrate the line fluxes by assuming zero width for the lines (monochromatic). We used the IRAF/STSDAS SYNPHOT task BANDPAR to compute the conversion from counts sec-1 to ergs sec-1 cm-2. The results were the same within errors to those produced by the SYNPHOT task CALCPAR.
Using the known relative orientation of the various chips on WFPC2, we rotated the chips which contained the line emission and the PC-chip and images to the same orientation. We used stars in the images to register the frames. The final emission-line images were constructed by accounting for the different scales of images on various chips (usually the PC chip and WF2 chip), and scaling down the - and -band images to the expected count levels corresponding to the wavelength and band of the line image, with the help of the WFPC2 exposure time calculator. We then combined the broad-band images by taking their geometric mean and performed a final adjustment to this combined continuum image by selecting areas well outside emission-line regions (with pure stellar emission) and comparing fluxes in corresponding areas in the continuum and line images. Finally, we subtracted the scaled continuum image from the line image. Using the combination of and images eliminates the extinction terms in the case of foreground extinction, as explained in detail by Verdoes Kleijn et al. (1999). In some cases, the residual image shows negative pixels, which are most likely due to strong color gradients near the nuclei. We estimate that the final uncertainty in the line fluxes is no better than 50%, based on varying the scaling of the continuum image within acceptable limits and comparing the derived total line fluxes.
| Object | Chip | Filter | 0aaCentral wavelength in Å [from the WFPC2 Handbook, Table 3.1 Biretta et al. (2000), for the standard filters; as specified in the observations for the LRF filters]. | bbFilter width in Å [from the WFPC2 Handbook, Table 3.1 Biretta et al. (2000), for the standard filters; equivalent Gaussian FWHM from the IRAF CALCPHOT task for the LRF filters]. | (sec)ccIntegration time. |
|---|---|---|---|---|---|
| NGC 4038/39ddData from Whitmore et al. 1999. | WF2/WF4 | F555W | 5407 | 1223 | 4 1100 |
| NGC 4038/39ddData from Whitmore et al. 1999. | WF2/WF4 | F814W | 5407 | 1223 | 4 500 |
| NGC 4038/39ddData from Whitmore et al. 1999. | WF2/WF4 | F658N | 6591 | 28.5 | 3800 |
| NGC 4676 Nuc 1 | PC1 | F555W | 5407 | 1223 | 2 160 |
| NGC 4676 Nuc 1 | PC1 | F814W | 7940 | 1758 | 2 160 |
| NGC 4676 Nuc 1 | WF2 | LRF | 6715.3 | 80.1 | 2 600 |
| NGC 4676 Nuc 2 | PC1 | F555W | 5407 | 1223 | 2 160 |
| NGC 4676 Nuc 2 | PC1 | F814W | 7940 | 1758 | 2 160 |
| NGC 4676 Nuc 2 | WF2 | LRF | 6714.4 | 79.9 | 2 600 |
| NGC 7592 | PC1 | F555W | 5407 | 1223 | 2 160 |
| NGC 7592 | PC1 | F814W | 7940 | 1758 | 2 160 |
| NGC 7592 | WF2 | F673N | 6732 | 47.2 | 2 600 |
| NGC 7764A | PC1 | F555W | 5407 | 1223 | 2 160 |
| NGC 7764A | PC1 | F814W | 7940 | 1758 | 2 160 |
| NGC 7764A | WF2 | LRF | 6770.8 | 84.2 | 2 600 |
| NGC 6621 | PC1 | F555W | 5407 | 1223 | 2 160 |
| NGC 6621 | PC1 | F814W | 7940 | 1758 | 2 160 |
| NGC 6621 | WF2 | LRF | 6706.2 | 79.3 | 2 700 |
| NGC 6622 | PC1 | F555W | 5407 | 1223 | 2 160 |
| NGC 6622 | PC1 | F814W | 7940 | 1758 | 2 160 |
| NGC 6622 | WF2 | LRF | 6711.5 | 79.9 | 2 700 |
| NGC 3509 | PC1 | F555W | 5407 | 1223 | 2 160 |
| NGC 3509 | PC1 | F814W | 7940 | 1758 | 2 160 |
| NGC 3509 | PC1 | F673N | 6732 | 47.2 | 2 600 |
| NGC 520 Nuc 1 | PC1 | F555W | 5407 | 1223 | 2 160 |
| NGC 520 Nuc 1 | PC1 | F814W | 7940 | 1758 | 2 160 |
| NGC 520 Nuc 1 | PC1 | LRF | 6619.2 | 75.5 | 2 600 |
| NGC 520 Nuc 2 | PC1 | F555W | 5407 | 1223 | 2 160 |
| NGC 520 Nuc 2 | PC1 | F814W | 7940 | 1758 | 2 160 |
| NGC 520 Nuc 2 | PC1 | LRF | 6617.1 | 75.8 | 2 600 |
| NGC 2623 | PC1 | F555W | 5407 | 1223 | 2 160 |
| NGC 2623 | PC1 | F814W | 7940 | 1758 | 2 160 |
| NGC 2623 | WF2 | LRF | 6691.4 | 78.6 | 2 600 |
| NGC 3256 Nuc 1 | PC1 | F555W | 5407 | 1223 | 2 160 |
| NGC 3256 Nuc 1 | PC1 | F814W | 7940 | 1758 | 2 160 |
| NGC 3256 Nuc 1 | WF2 | LRF | 6631.4 | 75.9 | 2 600 |
| NGC 3256 Nuc 2 | PC1 | F555W | 5407 | 1223 | 2 160 |
| NGC 3256 Nuc 2 | PC1 | F814W | 7940 | 1758 | 2 160 |
| NGC 3256 Nuc 2 | WF2 | LRF | 6631.4 | 75.9 | 2 600 |
| NGC 3921eeData from Schweizer et al. 1996. | PC1 | F555W | 5407 | 1223 | 2 1200 |
| NGC 3921eeData from Schweizer et al. 1996. | PC1 | F814W | 7940 | 1758 | 2 900 |
| NGC 3921 | WF2 | LRF | 6698.9 | 79.0 | 2 700 + 800 |
| NGC 7252ffData from Miller et al. 1997. | PC1 | F555W | 5407 | 1223 | 3600 |
| NGC 7252ffData from Miller et al. 1997. | PC1 | F814W | 7940 | 1758 | 2400 |
| NGC 7252 | WF2 | LRF | 6673.9 | 77.9 | 2 700 + 600 |
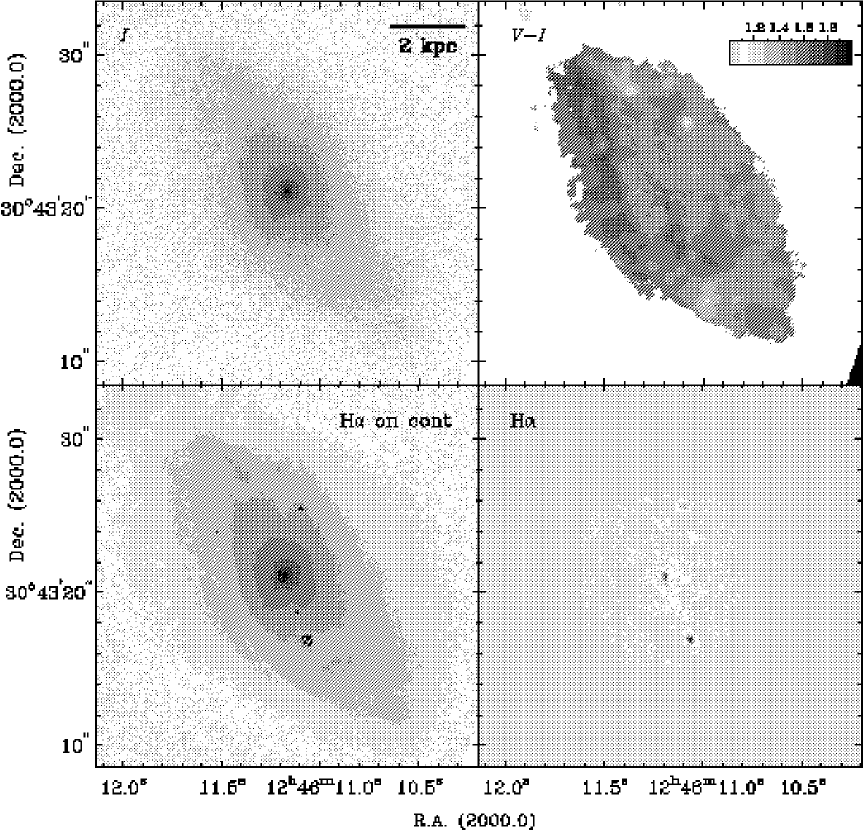
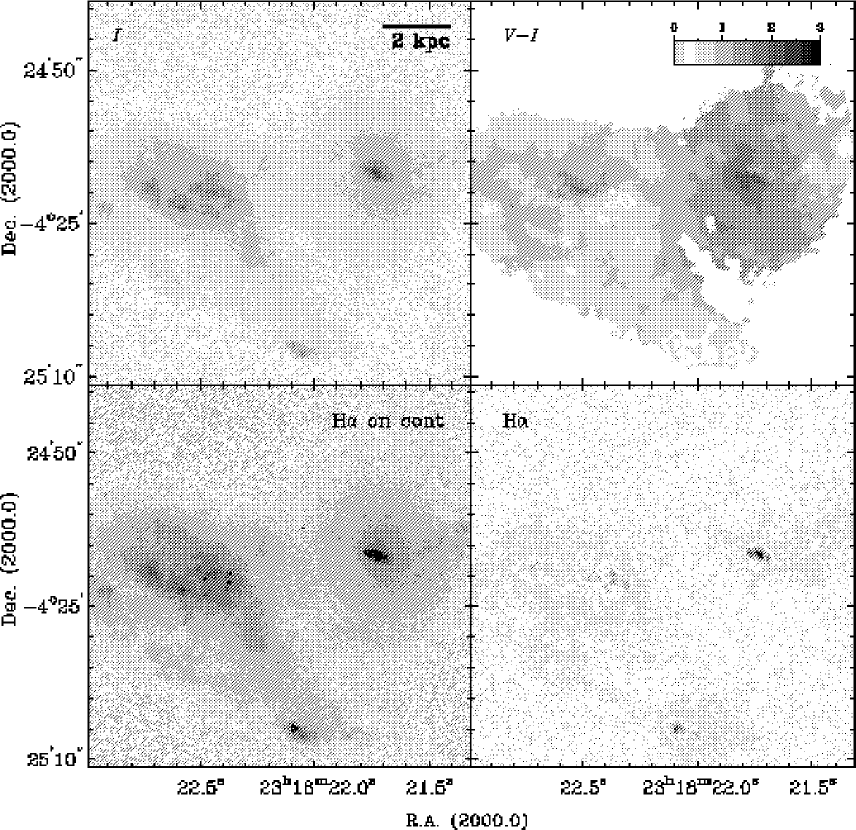
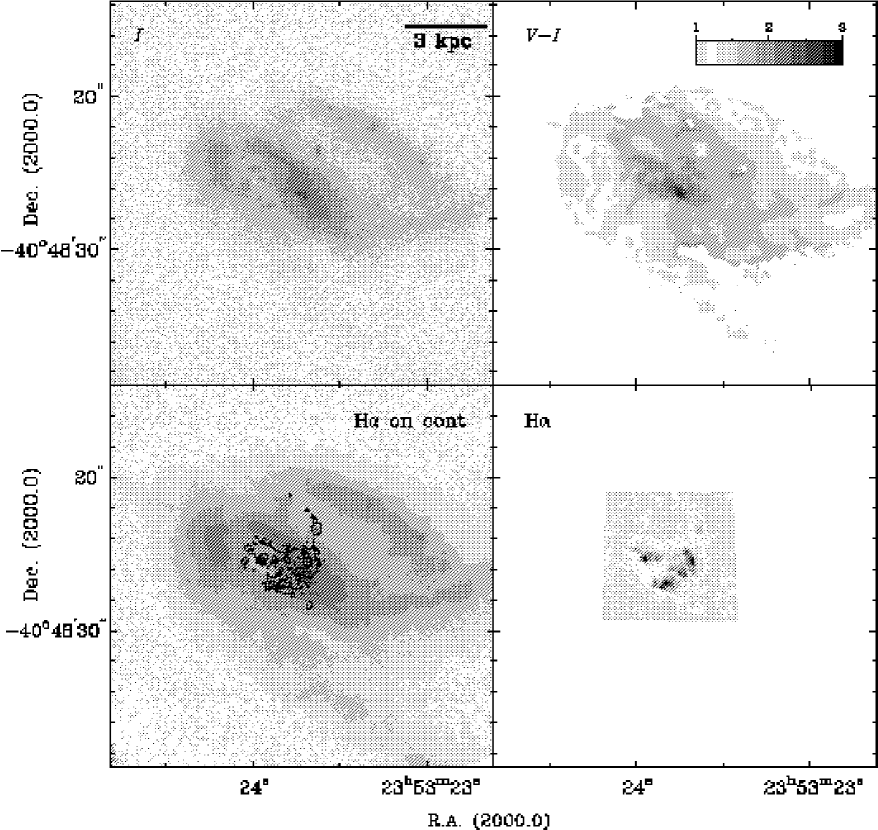
Color index images were created by dividing the F555W image by the F814W image, taking the logarithm of the result, and correcting for differences in the color terms, using the synthetic calibration from Holtzman et al. (1995). For our new imagery (i.e., all systems except NGC 4038/39, NGC 3921, and NGC 7252), many regions in the raw color index images are of low signal-to-noise. We therefore constructed smoothed color index maps using an adaptive filtering procedure, as described by Scoville et al. (2000), where areas with lower signal-to-noise ratios were smoothed by a larger boxcar. These images were then masked so as to only show areas with adequate signal-to-noise (signal-to-noise greater than two in both - and -images after being smoothed with an 1111 pixel boxcar median filter). The resulting smoothed color index images, together with the unsmoothed broad-band images and H+[N II] images, are shown in Figures 2–16.
3 GALAXY MORPHOLOGY
In the following we give a brief description of each system, based on Figures 2–16, together with a few references to earlier work. We use a Hubble constant of throughout this paper.
3.1 NGC 4038 and NGC 4039 (The Antennae)
Perhaps the best-known system in the sequence is the Antennae. We use the spectacular HST , and H images of this system from Whitmore et al. (1999; see also Whitmore & Schweizer 1995 and Figure 1). These images show the chaotic dust lanes and prevalent star formation in the interface between the two galaxies. They also reveal the redder color of the underlying population in the bulge component of each galaxy. The focus of the Whitmore et al. papers was on the abundant young star clusters which have apparently formed as the result of the interaction of the two galaxies. The properties and evolution of such clusters in a merger event have been discussed extensively in a series of papers by Whitmore and his collaborators (e.g., Whitmore & Schweizer, 1995; Schweizer et al., 1996; Miller et al., 1997; Whitmore et al., 1997, 1999; Zhang, Fall, & Whitmore, 2001). The nuclear regions of merging galaxies are potential formation sites of new super star clusters (Bekki & Couch, 2001). We instead investigate the morphology and star formation activity in the central few hundred parsecs.
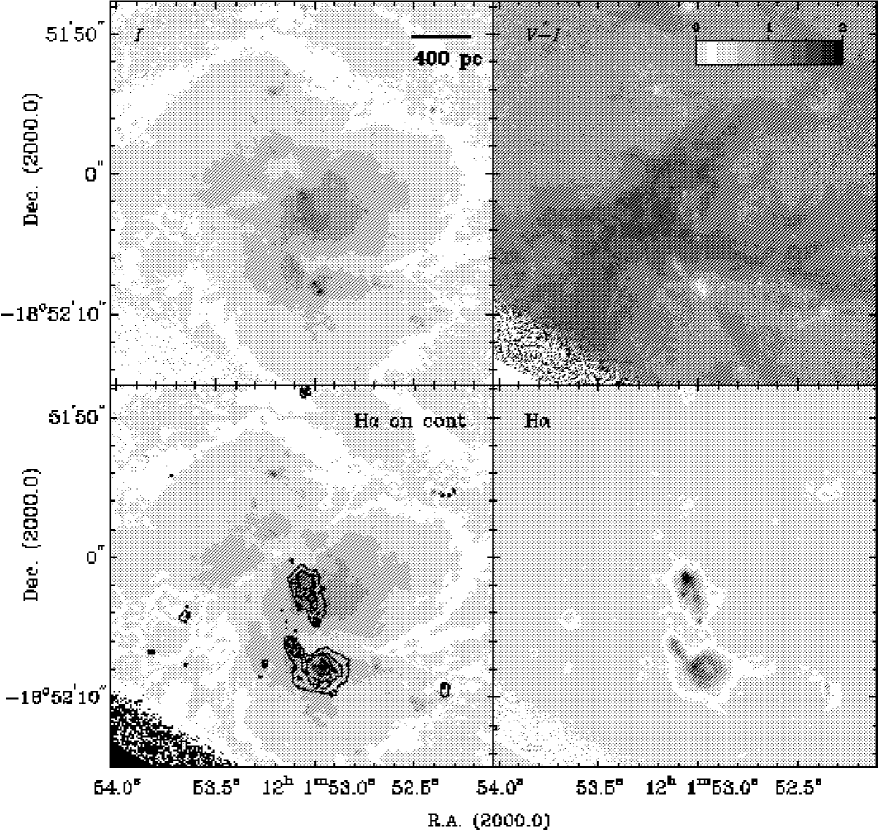
The nuclear region of the northern component of the Antennae, NGC 4038, is bracketed by star clusters in the and images. The position of the nucleus is most likely near the knot ”J” in the classification scheme of Whitmore & Schweizer (1995), and close to the nuclear position identified in the radio continuum by Zhang et al. (2001; using the radio continuum data of Neff & Ulvestad 2000) and in the near-infrared by Mengel et al. (2001). In our I-band image, this is located near the center of the frame displayed in Fig. 2. There we see an elongated ring-like structure, with an axis ratio of about 0.3 and a diameter of about 25 (260 pc), pointing north-northeast. The coordinates of the optical knot that we identified as the nucleus of NGC 4038 in the WFPC2 images are given in Table 1. They agree with the radio continuum position to within one arcsecond and they are within about 3 arcseconds of the estimated near-infrared position of the nucleus. The absolute accuracy of the coordinates reported in this paper is 1″. This is the intrinsic accuracy of the HST guide star coordinate system. The H image (see Fig. 2) also shows the elongated ring structure with a peak in the north-northeastern corner at the position of the star clusters seen in the - and -band images. The colors of the clusters in the ring-like structure vary from 0.4 to 1.0, while a typical color outside and inside the ring is 1.5, reaching up to 1.9 in the dust lanes. Most of the dust is concentrated on the southeastern side of the elongated ring-like structure. Near-infrared high resolution HST NICMOS observations of the nucleus will be reported in a future paper. They promise to shed more light on the issue of the true location of the nucleus in NGC 4038. Previous ground-based near-infrared imaging (Bushouse & Werner, 1990; Hibbard et al., 2001; Mengel et al., 2001) does not have high enough spatial resolution to indicate the exact location of the nucleus.
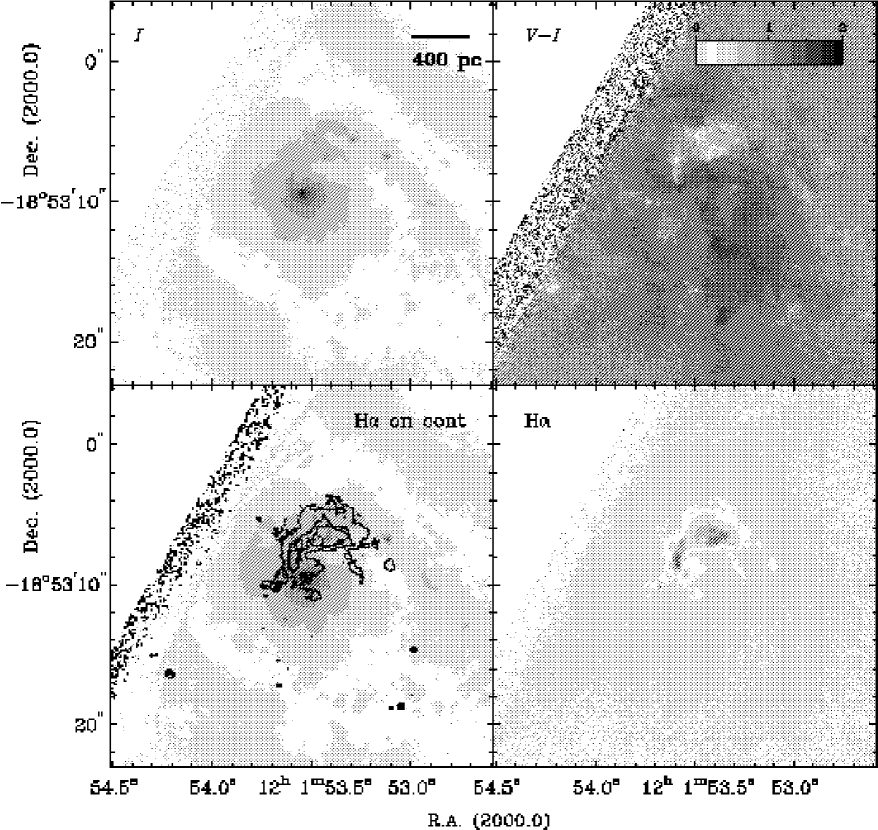
The nucleus of NGC 4039, the southern component of the Antennae, is much easier to recognize in the and images (see Fig. 3). Our identified nuclear position (the position of the optical peak) in Table 1 agrees to within about two arcseconds of the estimated nuclear positions from the radio continuum data (Zhang et al., 2001) and near-infrared data (Mengel et al., 2001). The nucleus is surrounded by dust patches and dust lanes. There is also a minor peak of H emission at the location of the nucleus, which could be due to continuum subtraction uncertainties. Much more intense H emission is seen in the arm connecting to the nucleus. The color of the nucleus of NGC 4039 is about 1.0, and the surrounding area has a color around 1.3, with values of 1.7 in a dusty region close to the nucleus.
Neither NGC 4038 nor NGC 4039 is classified as a Seyfert or LINER nucleus. These nuclei are instead hosts of mild starbursts (e.g., Dahari, 1985; Véron–Cetty & Véron, 1986). Further evidence for the starburst nature of these nuclei comes from X-ray observations with the ROSAT High-Resolution Imager (Fabbiano et al., 1997) and with Chandra (Zezas et al., 2002a, b). The northern X-ray nucleus (NGC 4038) has a soft spectrum, which hints at thermal emission and is probably related to a hot wind, whereas the thermal + power-law spectrum of the southern X-ray nucleus (NGC 4039) indicates a hot ISM and a contribution from X-ray binaries.
3.2 NGC 4676 (The Mice)
The Mice is a pair of spiral galaxies with only moderately active nuclei (classified as LINER-type by Keel et al. 1985). The nucleus of NGC 4676A or Nuc 1 (the northern component of the pair) is covered by dust in our optical and images (Fig. 4). This dust is likely associated with the dense edge-on molecular disk imaged in CO(1-0) by Yun & Hibbard (2001). Adopting standard conversion factors, the observed peak CO flux density suggests that the nucleus of NGC 4676A is hidden beneath 60 magnitudes of extinction.
Just south of the area of heavy dust obscuration near the base of the northern tail is a V-shaped structure (with the V being sideways and opening to the east, and the tip of the V at R.A. 12h46m101 and Dec. 43′550) of brighter emission from young stellar clusters near the center of the main body. About 7″ (3 kpc) to the south one can see a triangle-shaped structure of young clusters. The tip of the central V-shaped cluster lies near the peak emission in a ground-based K’ image (J. Hibbard, unpublished; see also Bushouse & Stanford 1992), so we assume that the nucleus lies near this position. The H emission from NGC 4676A is weak. In general, the emission is elongated in the north–south direction of the main body. The V-shaped structure has very red colors above 2.2. Perhaps even more surprisingly, the color of the heavily extinguished dust patch near the base of the tail is actually bluer than its surroundings, having an average value less than 1. We interpret this region as scattered light from young stars which are mostly hidden by the dust. A hint of this young star population is seen in the image (not shown here). Such a young star forming region can be seen even more clearly in the new, deeper ACS images of the Mice (Ford et al., 2002). In contrast to the V-shaped structure, the triangle-shaped structure of clusters near the southern end of the main body has bluer colors than its surroundings, with values around 1 or slightly below it.
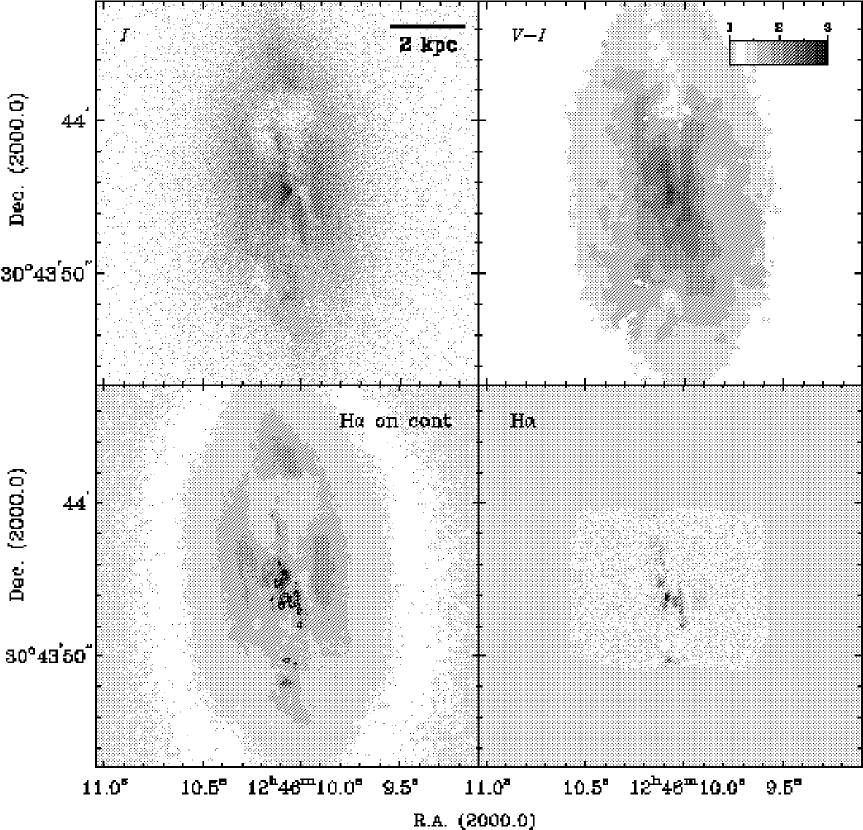
The nucleus is easily identified in NGC 4676B or Nuc 2. It is surrounded by a rather amorphous disk, and a dust lane that seems to wrap around the whole disk, ending near the location of the nucleus (Fig. 5). There is a peak of H emission offset by about 02 from the nucleus of NGC 4676B, but in general the H emission is weak and patchy. The nucleus has colors close to 1.3. A dust patch near the nucleus has a color as red as 1.7. The majority of the disk outside the dust lanes and dust patches has a color of 1.2–1.3. The overall appearance of NGC 4676B, particularly the well-defined bulge/nucleus, is consistent with it being of an earlier Hubble-type than its interacting partner, NGC 4676A (Yun & Hibbard, 2001).
3.3 NGC 7592
This is the third most distant system in the Toomre Sequence, and the main bodies of both galaxies fit within the PC chip of the WFPC2. NGC 7592A or Nuc 1, further to the west, has an active Seyfert 2 nucleus, whereas NGC 7592B or Nuc 2 is classified as a starbursting system (Dahari, 1985; Rafanelli & Marziani, 1992; Kewley et al., 2001; Hattori et al., 2002). NGC 7592A has a much better defined nucleus or bulge than NGC 7592B, consistent with the suggestion of Hattori et al. (2002), who argue that NGC 7592A is of an earlier Hubble-type than NGC 7592B. Bushouse & Werner (1990) claim that NGC 7592A is seen almost face-on, because of its roundish appearance in ground-based optical and -band images. If so, this galaxy appears to possess a bar-like structure in the bulge, although the bar classification is uncertain due to patchy emission and one-sided dust. Similarly, Bushouse & Werner (1990) argued that NGC 7592B is more highly inclined to the line-of-sight. This, together with its later Hubble-type, explains why no clear nucleus is seen in this system. A comparison to the ground-based -band image of Bushouse & Werner (1990) suggests that the nucleus of NGC 7592B lies near the center of the ring-like structure of bright clumps seen in Figure 6. We are not able to identify any specific clump with the nucleus.
The H image shows abundant emission around the nucleus and the “bar” of NGC 7592A, and emission from the clumps in the ring of NGC 7592B, with a strong central depression in emission. The nucleus of NGC 7592A has blue colors with around 0.8, contrasting to a dust lane lying on one side of the bar with a color close to 2.0. The southern side of the ring structure in NGC 7592B has very blue colors down to of 0.3, but there is a region of red colors of up to 1.9 in the northern part of the ring. Although there is dust visible at that location as well, the red color may suggest that the underlying red nucleus lies at this location.
3.4 NGC 7764A
This is the most distant system in our sample at = 122 Mpc. The location of NGC 7764A in the Toomre Sequence, among galaxies with clearly separate nuclei (Fig. 1) suggests that Toomre thought the nuclei of the two systems were still distinct. However, our HST images (Figure 7) do not obviously support the presence of two distinct nuclei. Future NICMOS near-infrared data will be critical in identifying the likely remains of the interacting galaxies. For now we only identify one main component from which both the tails are emanating. There is also a barred spiral galaxy, presumably at a similar redshift, displaced about 40″ (23.7 kpc in projected distance) to the southeast of the main system (imaged on one of our WF chips, see Fig. 1), and a third system with apparent tidal streamers displaced about 40″ to the northwest, just outside our PC image.
Our PC image reveals a shred or linear feature about 7″ (4.1 kpc) to the northwest of the main body of NGC 7764A. About a dozen bright, blue ( 0.6–0.8) star clusters lie within this filament. Between this filament and the center of Fig. 7 is a very bright, very blue ( 0.22) cluster. This cluster has associated H emission with a“head-tail” morphology, with the cluster at the “head”, and the “tail” pointing to the north-northeast. Following the “head” towards the center of the image in Fig. 7, there is a string of H II regions, crossed by dust lanes. The centralmost H II region is weaker than the regions to its northwest and southeast, and is associated with two adjacent bright optical clusters. These two clusters lie near the region of very red colors in the map, with the reddest region (2.4) associated with the eastern cluster. This strong dust concentration may indicate that this is the location of one of the nuclei. The western clump of the double cluster is bluer ( 1.5) and brighter.
There are more bright Hii regions about 3″ (1.8 kpc) to the northeast of the double cluster, associated with another bright star cluster embedded in dust. Further to the east of this is an amorphous luminous region with rather blue colors ( 0.6–0.8).
3.5 NGC 6621 and NGC 6622
The northern component of this interacting galaxy pair, NGC 6621, has a dusty central region punctuated by patchy star clusters and ionized gas emission (Fig. 8). Two major dust lanes lead into the central region. One of them comes in from the northwest, following the long tidal tail at larger radii. The other dust lane intersects the nuclear region from the north, cutting a bright ridge of emission regions into two parts. H emission is associated with the bright ridge of emission regions seen in the and images, and also with another emission patch across the dust lane coming in from the northwest. The emission ridge has colors around 1.0, but in the surrounding dusty area the colors are as red as 2. The southwestern emission region across the dust lane from the emission ridge has a blue color of 0.5. The nuclear spectrum of NGC 6621 has been classified to be of starburst type (Veilleux et al., 1995). The ground-based near-infrared data of Bushouse & Werner (1990) show that the nucleus likely lies near the ridge of bright emission seen in our optical images, but it is not possible to constrain the true nuclear location from these images.
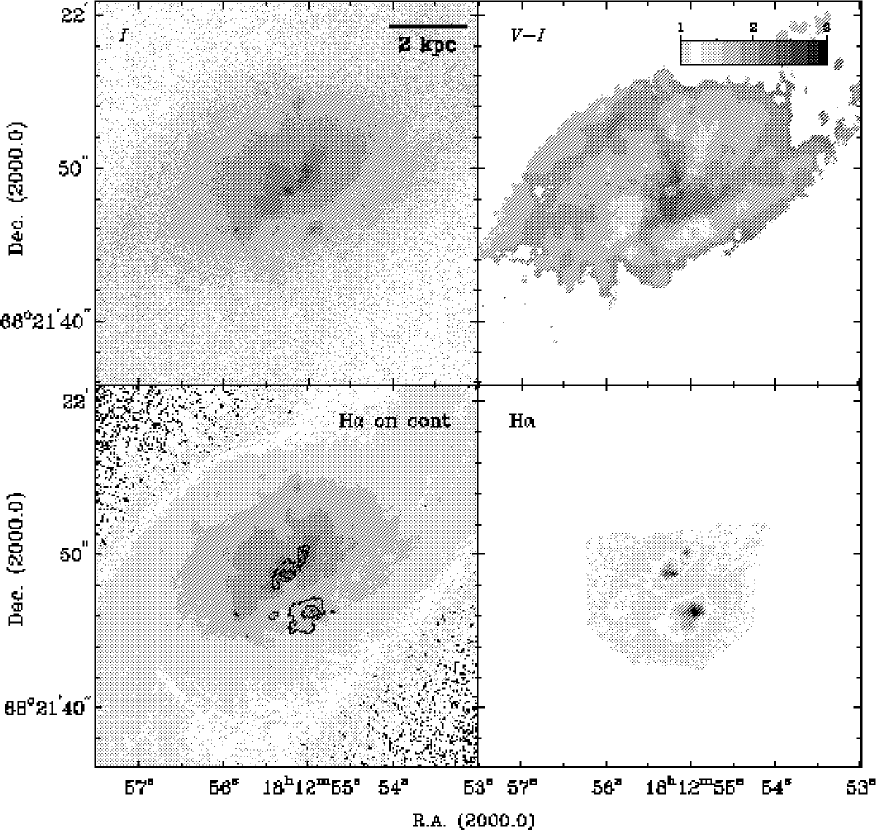
NGC 6622 has a well-defined nucleus and either a strong stellar bar, or a close to edge-on orientation to the line-of-sight (Fig. 9). The -band infrared image of Bushouse & Werner (1990) shows that the outer isophotes are not too far from being circular, making it unlikely that this is an edge-on galaxy. There is an obvious dust lane on the northern and northeastern side of the galaxy, most likely signifying perturbations caused by NGC 6621. There is practically no H emission associated with NGC 6622, suggesting that it is an early Hubble-type galaxy. The nucleus and the bar have red colors up to 2.3. The typical color in the remainder of the disk is 1.3. There is a star forming region in the area between NGC 6621 and NGC 6622 which has a blue color with typical values around 0.8 (near the upper right edge of Figure 9).
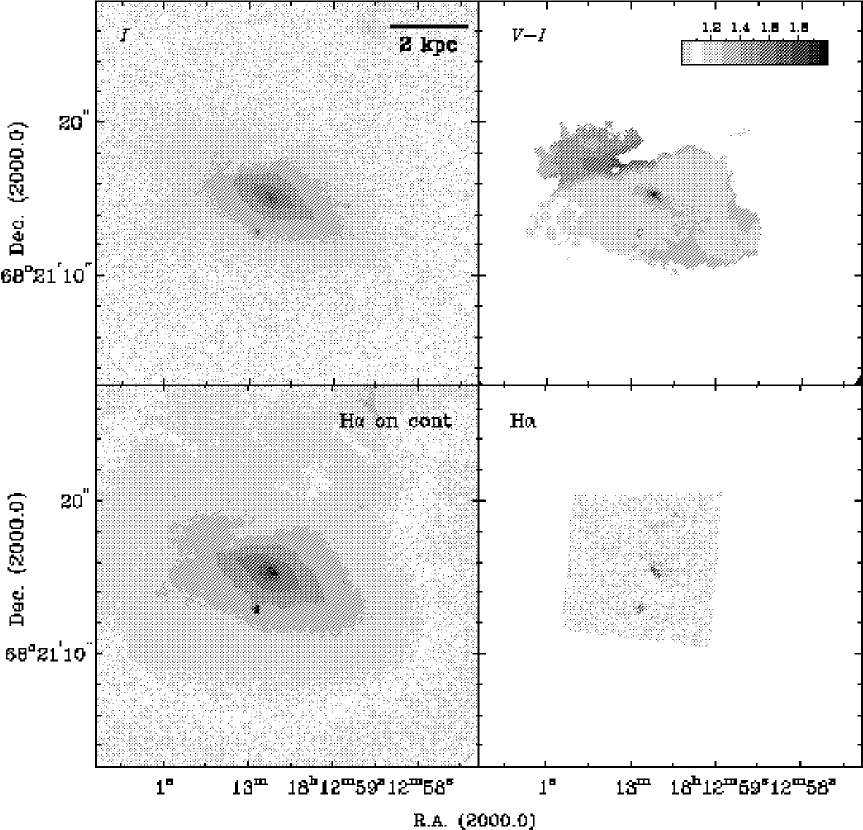
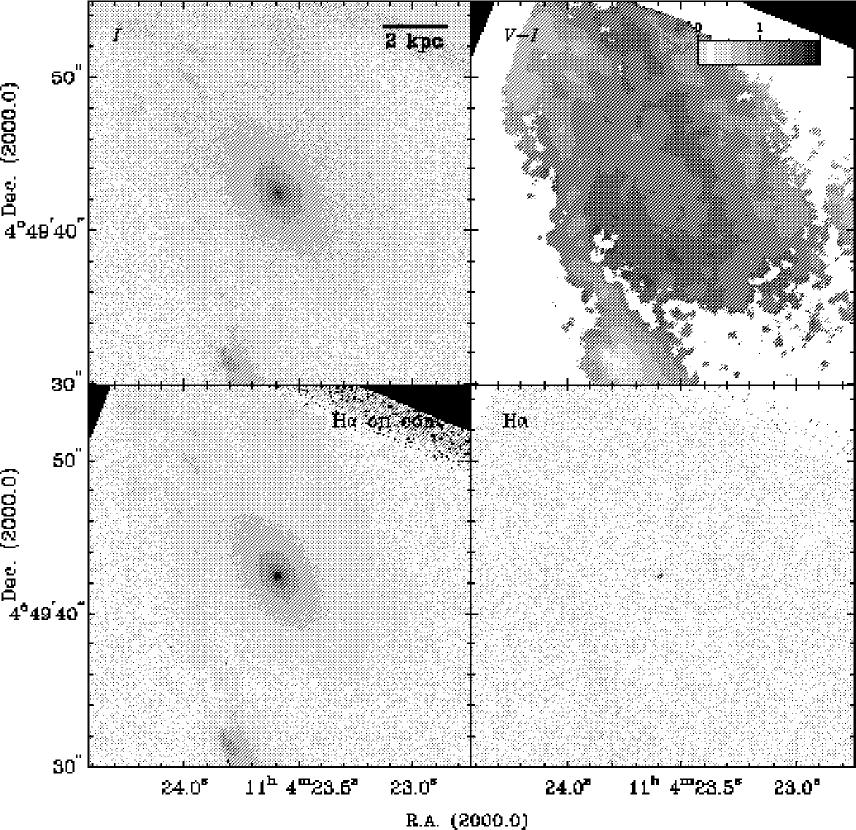
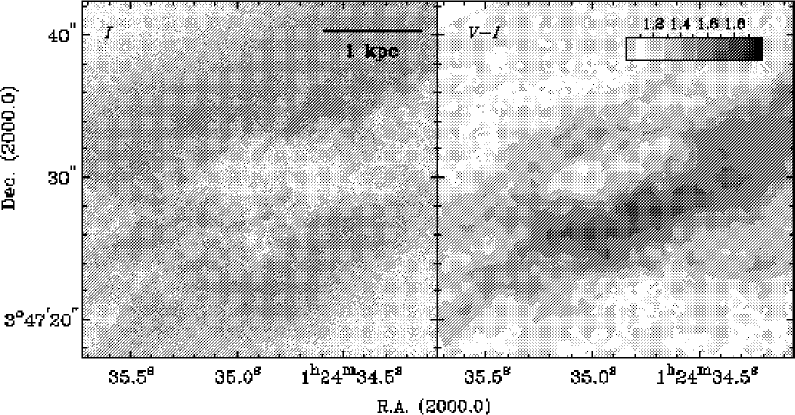
3.6 NGC 3509
The second-most distant galaxy of this sample, NGC 3509, falls in the middle of the Toomre Sequence. The sketch of this system by Toomre (1977) suggests that he envisioned a large tail curving to the northwest and a shorter tail extending to the southwest. Deep ground-based CCD imagery obtained by one of us (JEH) suggests that the southeastern feature is not a tail, but rather the bright ridge of an inclined disk. There is a very bright rectangular-shaped feature at the head of the southeastern feature, directly south of a central bulge (see also Arp, 1966), which may have been interpreted as the bulge of the second system. Our HST/WFPC2 broad-band imagery shows that this region resolves into a number of bright, blue stellar associations (Figure 10), and we believe it is much more likely to be a collection of bright star forming regions within the perturbed disk than the nucleus of a second system. The extremely blue colors of this region ( colors around 0.5; the tip of this region is seen at the bottom center of Figure 10) are in spectacular contrast to the rest of the galaxy (typical values from 1.1 to 1.4), and indicate active star formation.
In our images we can clearly identify a single relatively undisturbed nucleus, surrounded by a swirl of dust lanes (center of Figure 10). The H image reveals a peculiar double-peaked H structure straddling the nucleus in an orientation which is perpendicular to the main body of the nuclear region. H emission, indicating ongoing star formation, is also seen in the blue region south of the nucleus.
In the absence of an obvious second tidal tail in the ground-based imagery, we find little evidence that NGC 3509 is the obvious result of a major disk-disk merger. It may instead be the result of a minor merger, or an ongoing interaction with a smaller companion. In support of the minor merger hypothesis, we note the appearance of a roughly circular diffuse red concentration just to the north of the nucleus (12″ 6 kpc; see Fig. 1, just off of the PC chip) which could be the remains of a smaller galaxy. In support of the interaction hypothesis, on a deep R-band CCD image taken by one of us (JEH) we note the presence of a compact object lying 2′ towards southeast, along the minor axis of this system. This possible companion also has faint low surface brightness features pointing both toward and away from NGC 3509.
3.7 NGC 520
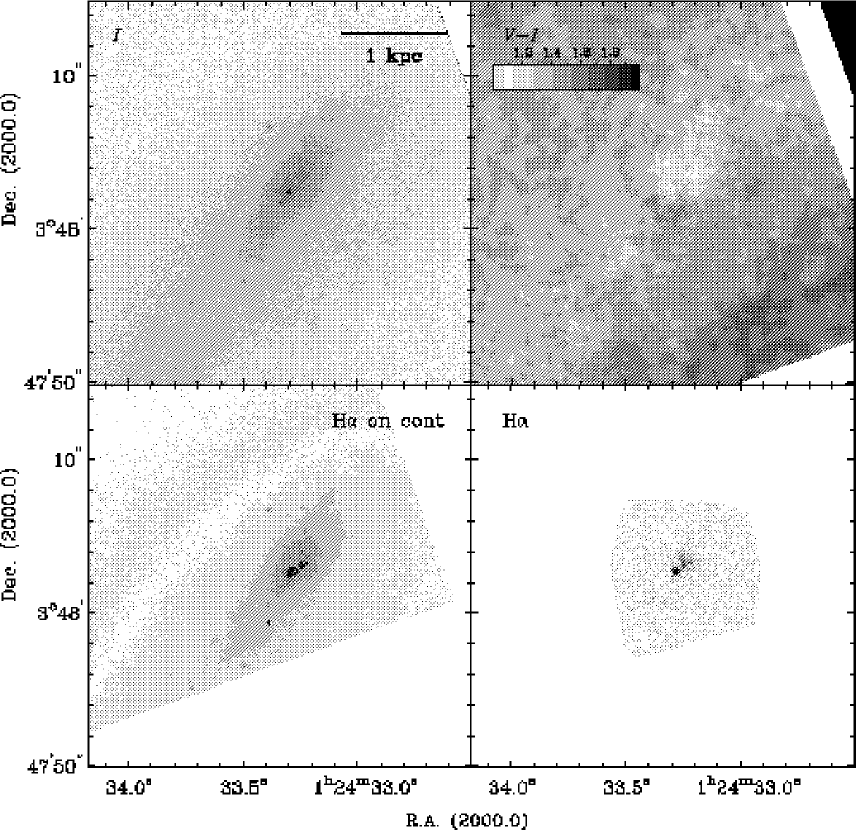
The southeastern component of NGC 520 is hidden behind a prominent and intricate dust lane (Figure 11). This dust is likely associated with the dense edge-on molecular disk imaged in CO (1–0) by Sanders et al. (1988b) and Yun & Hibbard (2001). Adopting standard conversion factors, the observed peak CO flux density suggests that the nucleus of NGC 520 is hidden beneath 300 magnitudes of extinction. It is thus not surprising that the position of the primary nucleus is impossible to determine from our data. High-resolution future NICMOS observations may point out where this nucleus lies, but based on earlier ground-based near-infrared images (e.g., Bushouse & Stanford, 1992; Kotilainen et al., 2001) the nucleus likely lies in the center of the heaviest dust absorption. Radio continuum images (e.g., Carral, Turner, & Ho, 1990) show a disk-like morphology coincident with the CO disk, suggesting on-going star formation within the central molecular disk. Practically no H emission is seen in our H image at the position of the primary nucleus. Red colors are seen along most of the primary nucleus. However, at the location of the most dust-affected regions, as seen in the image, we see relatively blue colors of 0.8 in the color index image. Again, as in the case of NGC 4676A, we interpret this as scattering of emission from young stars, hinted at in the -band image (not shown here).
The secondary, northwestern nucleus (Fig. 12) comes presumably from an earlier Hubble-type disk galaxy that is now embedded within an extended atomic gas disk associated with the primary galaxy (Hibbard & van Gorkom, 1996). The secondary nucleus is very well defined, although its surrounding disk seems to have been mostly disrupted in the merger, and probably contributes now to the extended optical tails. The only significant H emission near the secondary nucleus is in clumps within 1″ (150 pc), and displaced to the northwest. The secondary nucleus appears to have a bluish color, with of 0.6. This nucleus is observed to be in a post-starburst phase (Stanford & Balcells, 1990, 1991; Bernlöhr, 1993). The color towards the northwest of the nucleus has bluish values around 0.8, but dust reddens the color to 1.2 at about 3″ (450 pc) southeast of the nucleus.
3.8 NGC 2623
Consistent with its classification as a fairly advanced merger system, only one galaxy body is evident in NGC 2623 (Fig. 13). Again, based on the high spatial resolution optical HST images it is impossible to tell the exact location of the nucleus or nuclei. A comparison to the NICMOS images published by Scoville et al. (2000) suggests that the position of the brightest optical peak in the center of the main body of NGC 2623 is the true position of the nucleus, near J2000.0 coordinates of R.A.=8h38m241 and Dec.=2545166. This nucleus is classified as a LINER by Dahari (1985) and Vacci, Alonso-Herrero, & Rieke (1998). Dust surrounds the nucleus mostly on the southeastern, northern, and northwestern sides, although numerous dust lanes criss-cross the whole nuclear region (see Fig. 13).
A study by Joy & Harvey (1987) confirms the coalescence of two galaxies. Based on their near-infrared observations, they conclude that the merger is complete, because only one nucleus is visible (which is surrounded by a single, symmetric nuclear region). This impression is confirmed by CO observations, which reveal a single centrally concentrated compact molecular disk with simple rotational kinematics (Bryant & Scoville, 1999). There are also numerous young star clusters scattered around the main body and the surrounding shreds.
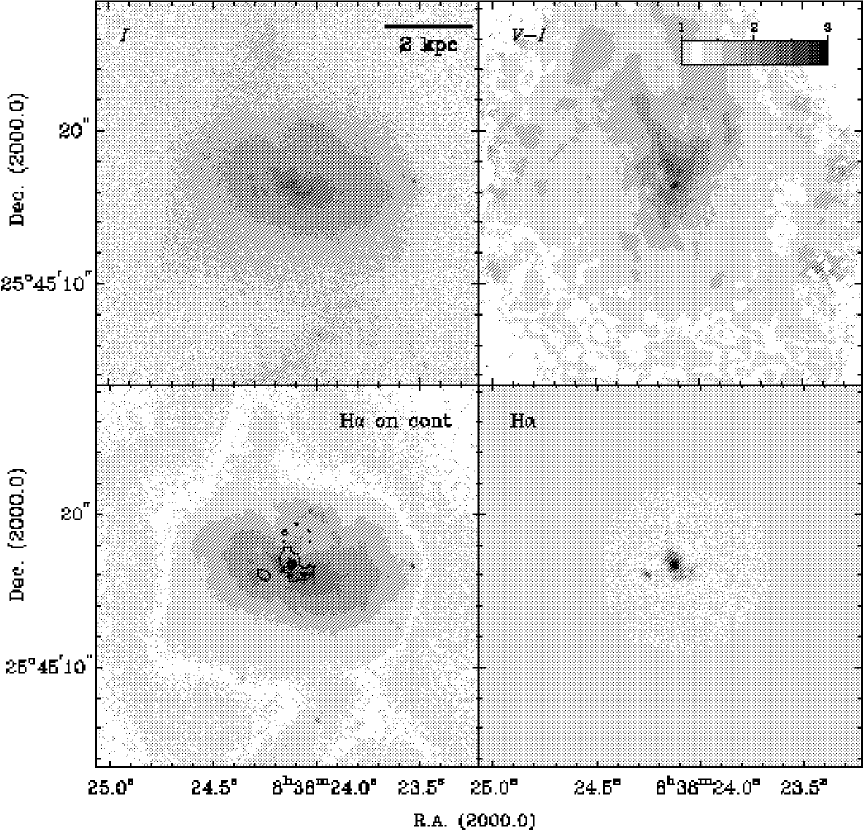
Most of the H emission comes from a disk around the nuclear position and from a location north of the nucleus, but also from a position in the dust patch southeast of the nucleus. The nucleus has a very red color at 2.5, consistent with the reddish near-infrared colors found for the nucleus by Scoville et al. (2000). The red near-infrared color, together with a relatively large CO absorption index value (Ridgway et al., 1994) suggest that there has been a recent starburst in the nuclear region. The red colors continue for about 2″ (720 pc) to the north and northwest. The main body of NGC 2623 has colors close to 1.0 or just below it.
3.9 NGC 3256
Our optical HST images show one obvious nucleus located in the center of Figure 14 (see also Zepf et al. 1999). This nucleus is surrounded by a relatively symmetric spiral morphology. Near-infrared, radio continuum, and X-ray observations (e.g., Norris & Forbes, 1995; Kotilainen et al., 1996; Lira et al., 2002) have discovered a second nucleus about 5″ (885 pc) south of the primary nucleus (marked with an “X” in Fig. 14), presumably hidden beneath the dark (red) dust feature directly south of the primary nucleus in the image of Fig. 14 (see also English et al. 2003). We do not see an optical source at the position of the second near-infrared, radio, and X-ray source. Our data therefore do not shed any new light on the nature of this source. Neither nucleus shows any evidence of being active. Studying the question of how many nuclei exist in this system (even three nuclei have been suggested by Lipari et al. 2000), would benefit from a detailed dynamical simulation of this merger system. The measurements for NGC 3256 in this paper refer only to the one nucleus we see in our WFPC2 images.
Archival NICMOS near-infrared images suggest that the position of the primary nucleus is close to the location of the brightest emission in our F814W image (Lipari et al., 2000). However, the optical HST images alone only show that this position is part of a ring-like structure, and there is nothing noticeably different about this location other than that it is the brightest clump in the image. Other bright regions are likely to be young star clusters or globular clusters, as reported by Zepf et al. (1999).
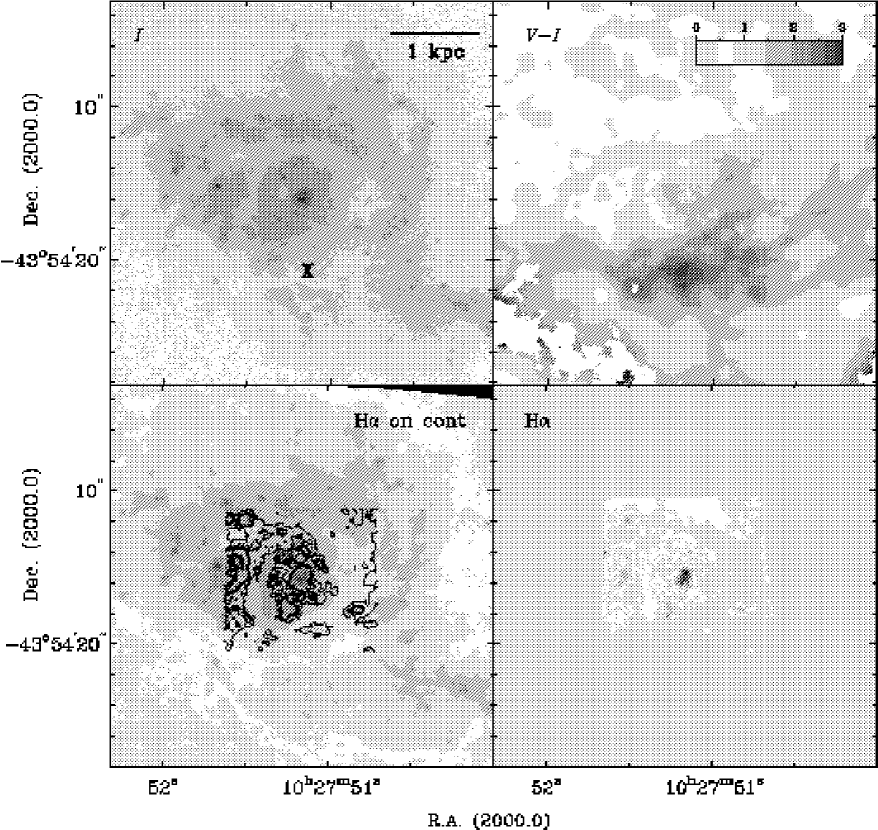
The H emission is extended and follows the spiral structure, but the brightest emission occurs at the position of the primary nucleus. Most previous studies regard this nucleus to be of starburst type, although Véron–Cetty & Véron (1986) were unable to resolve its true nature. While the primary nucleus has a blue color near 0.7, the dusty region covering the secondary nucleus to the south of the primary nucleus has a color of 2.5 or redder. In contrast, the spiral arms visible in the and images have a blue color between 0.5 and 1.0.
3.10 NGC 3921
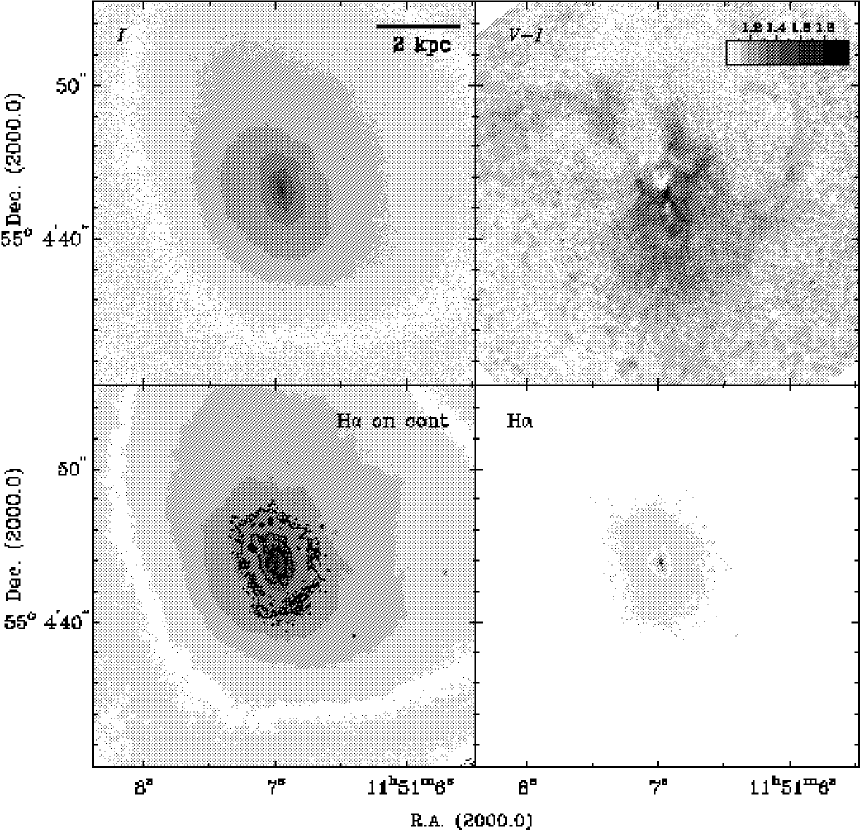
Only one nucleus is visible in NGC 3921 (Figure 15). This galaxy is a post-merger system that has developed an elliptical-like central region (see, e.g., Schweizer, 1996; Schweizer et al., 1996; Hibbard & Yun, 1999), although numerous dust lanes still criss-cross this area (see Fig. 15). The evidence for a recent merger can be seen in the outer region where tails and plumes prevail (Hibbard & van Gorkom, 1996). Several compact open star clusters or globular clusters can also be seen in the HST optical images kindly provided by B. Whitmore (see also Schweizer et al., 1996).
The H emission is centered in a disk around the nucleus, but extends to larger radii. The nucleus is classified as a LINER by Stauffer (1982a, b) and Dahari (1985). It lies in a location where the color gradient is very steep as seen in the image, but the nucleus itself has normal values of around 1.1. To the southwest of the nucleus the color increases to 1.8 at about 05 (190 pc) distance from the nucleus, and then decreases and stays around 1.1–1.2 on that side of the galaxy. To the northeast, the color decreases to values as low as 0.7 at about 05 from the nucleus, then stays around 0.9 for another 15 (570 pc). Dust extinction is at least partly responsible for this effect. Schweizer (1996) noticed that the nucleus lies substantially off-centered from the outer stellar isophotes of the main body.
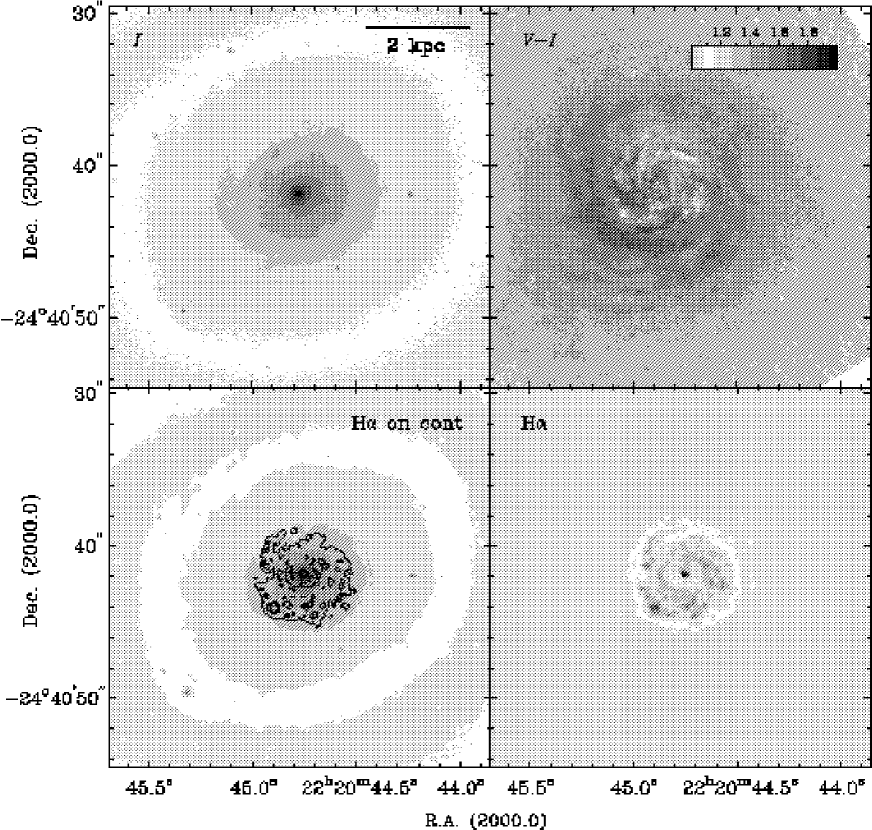
3.11 NGC 7252 (“Atoms–for–Peace” Galaxy)
We use the HST and images from Miller et al. (1997) to study the most advanced merger in the Toomre Sequence. The remnant from the merger is probably between 0.5 and 1 Gyrs old (Schweizer, 1982; Hibbard & Mihos, 1995). It has a single nucleus and is characterized by a profile typical of elliptical galaxies (Schweizer, 1982; Miller et al., 1997; Hibbard & Yun, 1999). It was quite a surprise, therefore, when HST revealed a central spiral disk (Miller et al. 1997 and Fig. 16). The disk extends to a radius of about 6″ (1.8 kpc), and is therefore coincident with the molecular disk imaged by Wang et al. (1992). Our new HST H image of this galaxy shows the disk to be actively forming stars, while the color map shows dust to be intertwined between the arms. In light of the results from recent hydrodynamical simulations (Barnes, 2002), and the observation of tidal gas streaming back into the central regions of this remnant from the tidal tails (Hibbard et al., 1994; Hibbard & Mihos, 1995), it seems likely that this central disk structure results from the re-accretion of tidally raised gas into the now-relaxed central potential.
The nucleus appears resolved, and is very bright, as we show in Section 4. H emission largely follows the spiral arms, although there appears to be a central H source as well. However, our continuum subtraction, unfortunately, is uncertain in this area due to an optically very bright nucleus. Similarly, the central color is difficult to determine reliably due to the same problem, but the color there appears to be close to 1.3, whereas the surrounding spirals have colors as blue as 0.5.
Recent X-ray observations with ASCA revealed X-ray emission that can be described by a two-component model (Awaki et al., 2002), with soft emission (kT = 0.72 keV), and a hard component (kT 5.1 keV). The hard component might indicate the existence of nuclear activity or even an intermediate mass black hole.
4 CHANGE IN PHOTOMETRIC PROPERTIES WITH MERGER STAGE
We performed aperture photometry of the Toomre Sequence galaxies to better understand the evolution of the nuclear region of merging galaxies. Because the isophotes in the nuclear region of merging galaxies are highly twisted, we did not attempt to fit ellipses and obtain radial surface brightness profiles. Instead we performed aperture photometry within circular apertures, with radii of 100 pc and 1 kpc. The lower value was dictated by the smallest resolvable physical scale in the most distant of our sample galaxies, whereas the upper value is somewhat arbitrary, but set because of our emphasis on the properties of the nuclear region. We have already characterized the morphology of the nuclear region at HST resolution in the individual galaxies above. Here we only report on the bulk photometric nuclear properties of each identified merger component galaxy.
Visual inspection of the images quickly reveals that none of the galaxies in the sample possess an extremely bright, point-like active nucleus. Based on spectroscopic evidence, as cited in Section 3, the only mildly active nuclei are in NGC 7592A (Seyfert 2), NGC 4676 Nuc 1 and Nuc 2 (LINER), NGC 2623 (LINER), and NGC 3921 (LINER). It is difficult to assess what the exact contribution of the nucleus to the integrated luminosities is.
The photometric measurements, converted to luminosity densities, are presented in Figures 17–5. The “merger stage”, plotted along the x-axis, refers to the original order of the sequence given by Toomre (1977), where 1 corresponds to NGC 4038/39 (the earliest merger stage) and 11 to NGC 7252 (the latest merger stage). The exact correspondence is given in the figure caption to Figure 17. Our observations do not suggest an obvious reordering of this sequence, although we are hampered by our inability to unambiguously identify all of the putative nuclei. Our tentative impression is that NGC 7764A (merger stage=4) may be interacting with the disturbed galaxy lying off of our image, in which case it belongs near the beginning of the sequence. And NGC 3509 (merger stage=6) is not an obvious merger at all. However, we will await NICMOS observations of this sequence before reaching any firm conclusions on this matter. We note that none of our conclusions will be affected if these two systems move earlier along or off of the sequence.
Apart from the large scatter in Figure 17 we see that the three latest merger stage systems (NGC 3256, NGC 3921, and NGC 7252) have the highest intrinsic luminosity densities. This is true for both apertures that we used (100 pc and 1 kpc). The range of luminosity density within 100 pc corresponds to a factor of more than 300. To a large extent this reflects the varying dust extinction in the central region, but partly also the morphology of the nuclear region (well-defined nuclei are bright, whereas components with no clearly recognizable nucleus are faint). With only colors available it is difficult to make a meaningful estimate of dust extinction. But, for example, Figure 5 shows that in NGC 2623 the integrated color is very red within a 100 pc radius aperture, with a value around 2.2. Assuming that the true color is 1.4 (a more typical value seen in the same figure), would imply almost = 2 mag of extinction with a typical extinction law of A (Landini et al., 1984). Since the extinction in the -band is only one tenth of that in the -band, our future NICMOS images offer some hope of revealing the true location of the nucleus.
While the colors for the 100 pc aperture attain values anywhere between 0.8 and 2.4, the majority of the nuclei have rather typical colors for the centers of spiral nuclei and elliptical galaxies, ranging from 1.2 to 1.5 (cf., e.g., Carollo et al., 1997). The presumably latest stage merger, NGC 7252, has colors even bluer than normal ellipticals. However, the morphology of the dust lanes we see in the images suggests that dust obscuration is likely to be significant in many systems of the Toomre Sequence.
The H + [N II] luminosities (Figure 5) show a marginal trend of increasing luminosities towards the late-stage mergers, most obviously in the largest 1 kpc aperture. However, the scatter is large, and based on the sample of 15 nuclei it is impossible to establish any definite trends.
Since mergers are expected to bring material into the center of galaxies and generate star formation there, we also study the nuclear concentration of light and line emission along the merging sequence. We measure the nuclear concentration quantitatively by taking the ratio of the luminosities within 100 pc to that within 1 kpc, for both the -band (Figure 5) and the line emission (Figure 5). We discuss the meaning of these ratios briefly in the following section.
5 DISCUSSION AND SUMMARY
The nuclear morphologies and central concentration are expected to be strongly affected by the timing and intensity of induced inflows and star formation during the merger. Numerical models of interacting galaxies have illustrated one mechanism by which interactions trigger these inflows and nuclear activity. Shortly after the galaxies first collide, the self-gravity of each disk amplifies the collisional perturbation into a growing mode (Noguchi, 1988; Barnes & Hernquist, 1991; Mihos & Hernquist, 1996). Depending on the structural properties of each galaxy, this mode can take the form of a strong bar, prominent spiral arms, or a pronounced oval distortion (Mihos & Hernquist, 1996; Mihos et al., 1997). These non-axisymmetric structures drive shocks in the interstellar medium of the galaxies, leading to a spatial offset between the gaseous and stellar components which robs the gas of angular momentum, and can drive it inwards well before the galaxies ultimately merge (Barnes & Hernquist, 1991; Hernquist & Mihos, 1995; Mihos & Hernquist, 1996). The onset, strength, and duration of starbursts in interacting pairs can vary widely, depending on the properties of the host galaxies. Ultimately, however, any dynamical stability provided by the presence of a central bulge or diminished disk surface density will be overwhelmed by the strong gravitational torques and dissipative shocks during the final merging of the pair, at which point gaseous inflow and central activity should be ubiquitous. Once the coalescence of the galaxies is complete, the gravitational potential settles down and gas can resettle into nuclear and/or spatially extended disks, supporting an extended period of relatively quiescent star formation.

Based on these kinds of models, we might expect to see an evolutionary trend for the nuclear properties of the Toomre Sequence, from quiescent star formation in the early stages of the sequence to strong nuclear activity in the late stages. However, we see little evidence for such trends in the morphology, luminosity density, or colors of the stellar component, or in the morphology or intensity of the ionized gas emission, apart possibly from the fact that the latest-stage systems have some of the highest broad-band luminosity densities and hints of starbursting central gaseous disk structures. This last suggestion is further strengthened by the trend towards bluer colors among the three latest-stage merger systems in Figure 5. A trend towards bluer colors was also seen in a study of merger remnants by van der Marel & Zurek (2000). Furthermore, the latest-stage merger systems have some of the highest nuclear H luminosities (Figure 5) and possess some of the largest concentrations of light in the central region (Figure 5). Such a concentration is also seen to a certain extent in the H+[N II] emission (Figure 5).
![[Uncaptioned image]](/html/astro-ph/0309377/assets/x19.png)
Integrated color indices within the circular apertures cited within the frames, as a function of the merger stage. The merger stage is defined as before in Figure 17. The error bars are based on the combined errors in the - and -band aperture magnitudes, estimated using the standard propagation of error formulas.
Are our observations of the Toomre nuclei consistent with the broad picture of interaction-induced nuclear activity in galaxies evidenced in numerical simulations? In a broad sense, yes, although this consistency is mainly due to the variety of dynamical responses available to interacting systems. The late stage mergers seem to have settled down, showing evidence for nuclear emission-line disks (NGC 2623, NGC 3256, NGC 3921, and NGC 7252), more concentrated luminosity profiles and a trend towards bluer colors. Toomre Sequence objects at earlier stages show very diverse properties, with no clear trends along the sequence. However, selecting a merging sequence based largely on the large-scale morphology of the tidal tails biases the sample towards a specific type of interaction – prograde interactions between disk galaxies – but not a specific type of disk galaxy. The galaxies which make up the Toomre Sequence likely possess a variety of structural properties so that there is no one-to-one correspondence between observed merger stage and nuclear morphology and activity. Put differently, the Toomre Sequence is not a true evolutionary sequence on anything but the largest scales. Instead, it is composed of a variety of galaxies progressing down varied paths of interaction-driven activity. Expecting to discern a clear trend in nuclear properties is likely a naive hope.
![[Uncaptioned image]](/html/astro-ph/0309377/assets/x20.png)
Integrated H+[N II] luminosities in units of ergs sec-1 within the circular apertures as cited within the frames, as a function of the merger stage. The merger stage is defined as before in Figure 17. It was impossible to measure the flux within 1 kpc reliably for NGC 520 Nuc 2 (merger stage 7), since the galaxy was so close to the edge of the chip. Therefore, no 1 kpc luminosity is plotted here and in Figure 5. Uncertainties in the fluxes are no better than 50%.
Aside from the variety of physical conditions sampled by the Toomre nuclei, searching for trends along the Toomre Sequence is also hampered by a number of observational concerns. First, the orientation of the galaxies with respect to the line-of-sight and to the orbital plane of the merger complicates the interpretation of the images. Second, extinction has a large effect on the observed morphologies, colors, and luminosities, as shown in Section 4 (e.g., NGC 520 Nuc 1 and NGC 4676 Nuc 1). In this context, we hope to improve upon the interpretation of the galaxy morphologies along the sequence through an analysis of NICMOS images of the entire Toomre Sequence. These images will suffer from much less extinction, and should also reveal the isophotes of the stellar population more clearly, thereby helping us in assessing the inclination of the merger components. The optical images shown here clearly demonstrate that dust in merging galaxies, even on small scales resolved by the HST, is not patchy enough to enable the identification of the true nuclei in optical bands.
![[Uncaptioned image]](/html/astro-ph/0309377/assets/x21.png)
Ratio of the integrated -band luminosity inside 100 pc to the integrated luminosity inside 1 kpc, plotted on a logarithmic scale, as a function of the merger stage.
In summary, these high-resolution WFPC2 images of the Toomre Sequence have given us a detailed view of the nuclear regions of interacting and merging galaxies. We have characterized the broad-band and emission-line morphologies of each member of the sequence, and measured the colors and luminosity densities of the nuclei. We find little evidence for clear trends in nuclear properties along the merger sequence, other than a suggestive rise in the nuclear luminosity density in the most evolved members of the sequence. The lack of clear trends in nuclear properties is likely due both to the effects of obscuration and geometry, as well as the physical variety of galaxies involved in the Toomre Sequence. In subsequent papers we will combine our optical imaging with NICMOS imaging and STIS spectroscopy of the Toomre nuclei to give a detailed picture of the physical conditions in interacting and merging galaxies.
![[Uncaptioned image]](/html/astro-ph/0309377/assets/x22.png)
Ratio of the integrated H+[N II] luminosity inside 100 pc to the integrated H+[N II] luminosity inside 1 kpc, as a function of the merger stage. Uncertainties in the fluxes are no better than 50%.
References
- Arp (1966) Arp, H. 1966, Atlas of Peculiar Galaxies, (Pasadena: California Institute of Technology)
- Awaki et al. (2002) Awaki, H., Matsumoto, H., & Tomida, H. 2002, ApJ, 567, 892
- Bahcall et al. (1995) Bahcall, J. N., Kirhakos, S., & Schneider, D. P. 1995, ApJ, 450, 486
- Barnes (1988) Barnes, J. E. 1988, ApJ, 331, 699
- Barnes (1998) Barnes, J. E. 1998, in Saas-Fee Advanced Course No. 26, “Galaxies: Interactions and Induced Star Formation”, ed. D. Friedli, L. Martinet & D. Pfenniger (Berlin: Springer–Verlag), 275
- Barnes (2002) Barnes, J. E., 2002, MNRAS, 333, 481
- Barnes & Hernquist (1991) Barnes, J. E., & Hernquist, L. 1991, ApJ, 370, L65
- Barnes & Hernquist (1992) Barnes, J. E., & Hernquist, L. 1992, Nature, 360, 715
- Barnes & Hernquist (1996) Barnes, J. E., & Hernquist, L. 1996, ApJ, 471, 115
- Bekki & Couch (2001) Bekki, K., & Couch, W. J. 2001, ApJ, 557, L19
- Bernlöhr (1993) Bernlöhr, K. 1993, A&A, 270, 20
- Biretta et al. (2000) Biretta, J. A., et al. 2000, WFPC2 Instrument Handbook, Version 5.0, (Baltimore: STScI)
- Borne et al. (2000) Borne, K. D., Bushouse, H., Lucas, R. A., & Colina, L. 2000, ApJ, 529, 77
- Bryant & Scoville (1999) Bryant, P. M., & Scoville, N. Z. 1999, AJ, 117, 2632
- Bushouse & Stanford (1992) Bushouse, H. A., & Stanford, S. A. 1992, ApJS, 79, 213
- Bushouse & Werner (1990) Bushouse, H. A., & Werner, M. W. 1990, ApJ, 359, 72
- Carollo et al. (1997) Carollo, C. M., Franx, M., Illingworth, G. D., & Forbes, D. A. 1997, ApJ, 481, 710
- Carral et al. (1990) Carral, P., Turner, J. L., & Ho, P. T. P. 1990, ApJ, 362, 434
- Dahari (1985) Dahari, O. 1985, ApJS, 57, 643
- Dubinski et al. (1996) Dubinski, J., Mihos, J. C., & Hernquist, L. 1996, ApJ, 462, 576
- Duc & Brinks (2001) Duc, P. A., & Brinks, E. 2001, in ASP Conf. Proc. 240, Gas and Galaxy Evolution, ed. J. E. Hibbard, M. Rupen, & J. H. van Gorkom (San Francisco: ASP), 181
- Elmegreen et al. (1993) Elmegreen, B. G., Kaufman, M., & Thomasson, M. 1993, ApJ, 412, 90
- English et al. (2003) English, J., Norris, R. P., Freeman, K. C., & Booth, R. S. 2003, AJ, 125, 1134
- Fabbiano et al. (1997) Fabbiano, G., Schweizer, F., & Mackie, G. 1997, ApJ, 478, 542
- Ford et al. (2002) Ford, H. C., Illingworth, G. D., Clampin, M., Hartig, G., the ACS Science Team and ESA 2002, preprint (STScI-PRC02-11d)
- Georgakakis et al. (2000) Georgakakis, A., Forbes, D.A., & Norris, R.P. 2000, MNRAS, 318, 124
- Hattori et al. (2002) Hattori, T., Yoshida, M., Ohtani, H., Ishigaki, T., Sugai, H., Hayashi, T., Ozaki, S., & Ishii, M. 2002, PASJ, 54, 393
- Hernquist (1992) Hernquist, L. 1992, ApJ, 400, 460
- Hernquist & Mihos (1995) Hernquist, L., & Mihos, J. C. 1995, ApJ, 448, 41
- Hibbard & Mihos (1995) Hibbard, J. E., & Mihos, J. C. 1995, AJ, 110, 140
- Hibbard & van Gorkom (1996) Hibbard, J. E., & van Gorkom, J. H. 1996, AJ, 111, 655
- Hibbard et al. (1994) Hibbard, J. E., Guhathakurta, P., van Gorkom, J. H, & Schweizer, F. 1994, AJ, 107, 67
- Hibbard et al. (2001) Hibbard, J. E., van der Hulst, J. M., Barnes, J. E., & Rich, R. M. 2001, AJ, 122, 2969
- Hibbard & Yun (1999) Hibbard, J. E., & Yun, M. S. 1999, ApJ, 522, L93
- Holtzman et al. (1995) Holtzman, J. A., Burrows, C. J., Casertano, S., Hester, J. J., Trauger, J. T., Watson, A. M., & Worthey, G. 1995, PASP, 107, 1065
- Hutchings & Neff (1992) Hutchings, J. B., & Neff, S. G. 1992, AJ, 104, 11
- Joseph & Wright (1985) Joseph, R. D., & Wright, G. S. 1985, MNRAS, 214, 87
- Joy & Harvey (1987) Joy, M., & Harvey, P.M. 1987, ApJ, 315, 480
- Keel et al. (1985) Keel, W. C., Kennicutt, R. C., Jr., Hummel, E., & van der Hulst, J. M. 1985, AJ, 90, 708
- Kewley et al. (2001) Kewley, L. J., Heisler, C. A., Dopita, M. A., & Lumsden, S. 2001, ApJS, 132, 37
- Kotilainen et al. (1996) Kotilainen, J. K., Moorwood, A. F. M., Ward, M. J., & Forbes, D. A. 1996, A&A, 305, 107
- Kotilainen et al. (2001) Kotilainen, J. K., Reunanen, J., Laine, S., & Ryder, S. D. 2001, A&A, 366, 439
- Landini et al. (1984) Landini, M., Natta, A., Oliva, E., Salinari, P., & Moorwood, A. F. M. 1984, A&A, 134, 284
- Lipari et al. (2000) Lipari, S., Díaz, R., Taniguchi, Y., Terlevich, R., Dottori, H., & Carranza, G. 2000, AJ, 120, 645
- Lira et al. (2002) Lira, P., Ward, M. J., Zezas, A., Alonso-Herrero, A., & Ueno, S. 2002, MNRAS, 330, 259
- Lonsdale et al. (1984) Lonsdale, C. J., Persson, S. E., & Matthews, K. 1984, ApJ, 287, 95
- Mengel et al. (2001) Mengel, S., Lehnert, M. D., Thatte, N., Tacconi-Garman, L. E., & Genzel, R. 2001, ApJ, 550, 280
- Mihos & Hernquist (1994a) Mihos, J. C., & Hernquist, L. 1994a, ApJ, 431, L9
- Mihos & Hernquist (1994b) Mihos, J. C., & Hernquist, L. 1994b, ApJ, 438, L47
- Mihos & Hernquist (1996) Mihos, J. C., & Hernquist, L. 1996, ApJ, 464, 641
- Mihos et al. (1993) Mihos, J. C., Bothun, G. D., & Richstone, D. O. 1993, ApJ, 418, 82
- Mihos et al. (1997) Mihos, J. C., McGaugh S. S., & de Blok, W. J. G. 1997, ApJ, 477, L49
- Mihos et al. (1998) Mihos, J. C., Dubinski, J., & Hernquist, L. 1998, ApJ, 494, 183
- Miller et al. (1997) Miller, B. W., Whitmore, B. C., Schweizer, F., & Fall, S. M. 1997, AJ, 114, 2381
- Milosavljević & Merritt (2001) Milosavljević, M., & Merritt, D. 2001, ApJ, 563, 34
- Neff & Ulvestad (2000) Neff, S. G., & Ulvestad, J. S. 2000, AJ, 120, 670
- Noguchi (1988) Noguchi, M. 1988, A&A, 201, 37
- Norris & Forbes (1995) Norris, R. P., & Forbes, D. A. 1995, ApJ, 446, 594
- Quinlan et al. (1995) Quinlan, G. D., Hernquist, L., & Sigurdsson, S. 1995, ApJ, 440, 554
- Quinlan & Hernquist (1997) Quinlan, G. D., & Hernquist, L. 1997, New Astron., 2, 533
- Rafanelli & Marziani (1992) Rafanelli, P., & Marziani, P. 1992, AJ, 103, 743
- Read & Ponman (1998) Read, A. M., & Ponman, T. J. 1998, MNRAS, 297, 143
- Ridgway et al. (1994) Ridgway, S. G., Wynn-Williams, C. G., & Becklin, E. E. 1994, ApJ, 428, 609
- Sanders et al. (1988a) Sanders, D. B., Soifer, B. T., Elias, J. H., Madore, B. F., Matthews, K., Neugebauer, G., & Scoville, N. Z. 1988a, ApJ, 325, 74
- Sanders et al. (1988b) Sanders, D. B., Scoville, N. Z., Sargent, A. I., & Soifer, B. T. 1988b, ApJ, 324, L55
- Schweizer (1982) Schweizer, F. 1982, ApJ, 252, 455
- Schweizer (1990) Schweizer, F. 1990, in “Dynamics and Interactions of Galaxies”, ed. R. Wielen (Heidelberg: Springer), 60
- Schweizer (1996) Schweizer, F. 1996, AJ, 111, 109
- Schweizer (1998) Schweizer, F. 1998, in “Galaxies: Interactions and Induced Star Formation”, Saas-Fee Advanced Course 26, ed. D. Friedli, L. Martinet, & D. Pfenniger, (Berlin: Springer–Verlag), 105
- Schweizer et al. (1996) Schweizer, F., Miller, B. W., Whitmore, B. C., & Fall, S. M. 1996, AJ, 112, 1839
- Scoville et al. (2000) Scoville, N. Z., et al. 2000, AJ, 119, 991
- Springel & White (1999) Springel, V., & White, S. D. M. 1999, MNRAS, 307, 162
- Stanford & Balcells (1990) Stanford, S. A., & Balcells, M. 1990, ApJ, 355, 59
- Stanford & Balcells (1991) Stanford, S. A., & Balcells, M. 1991, ApJ, 370, 118
- Stanford & Bushouse (1991) Stanford, S. A., & Bushouse, H. A. 1991, ApJ, 371, 92
- Stauffer (1982a) Stauffer, J. R. 1982a, ApJ, 262, 66
- Stauffer (1982b) Stauffer, J. R. 1982b, ApJS, 50, 517
- Surace et al. (2001) Surace, J. A., Sanders, D. B., & Evans, A. S. 2001, AJ, 122, 2791
- Toomre (1977) Toomre, A. 1977, in “The Evolution of Galaxies and Stellar Populations,” ed. B. M. Tinsley & R. B. Larson (New Haven: Yale Univ.), 401
- Toomre & Toomre (1972) Toomre, A., & Toomre, J. 1972, ApJ, 178, 623
- Vacci et al. (1998) Vacci, L., Alonso-Herrero, A., & Rieke, G. H. 1998, ApJ, 504, 93
- van der Marel & Zurek (2000) van der Marel, R. P., & Zurek, D. 2000, in ASP Conf. Ser. 197, “Dynamics of Galaxies: from the Early Universe to the Present”, Ed. F. Combes, G. A. Mamon, & V. Charmandaris, 323
- Veilleux et al. (1995) Veilleux, S., Kim, D.-C., Sanders, D. B., Mazzarella, J. M., & Soifer, B. T. 1995, ApJS, 98, 171
- Verdoes Kleijn et al. (1999) Verdoes Kleijn, G. A., Baum, S. A., de Zeeuw, P. T., & O’Dea, C. P. 1999, AJ, 118, 2592
- Véron–Cetty & Véron (1986) Véron–Cetty, M.–P., & Véron, P. 1986, A&A, 66, 335
- Wang et al. (1992) Wang, Z., Schweizer, F., & Scoville, N. Z. 1992, ApJ, 396, 510
- Weedman (1983) Weedman, D. 1983, ApJ, 243, 756
- Whitmore & Schweizer (1995) Whitmore, B. C., & Schweizer, F. 1995, AJ, 109, 960
- Whitmore et al. (1997) Whitmore, B. C., Miller, B. W., Schweizer, F., & Fall, S. M. 1997, AJ, 114, 1797
- Whitmore et al. (1999) Whitmore, B. C., Zhang, Q., Leitherer, C., Fall, S. M., Schweizer, F., & Miller, B. W. 1999, AJ, 118, 1551
- Young (1980) Young, P. J. 1980, ApJ, 242, 1232
- Yun & Hibbard (2001) Yun, M. S., & Hibbard, J. E. 2001, ApJ, 550, 104
- Zepf et al. (1999) Zepf, S. E., Ashman, K. M., English, J., Freeman, K. C., & Sharples, R. M. 1999, AJ, 118, 752
- Zezas et al. (2002a) Zezas, A., Fabbiano, G., Rots, A. H., & Murray, S. S. 2002a, ApJ, 577, 710
- Zezas et al. (2002b) Zezas, A., Fabbiano, G., Rots, A. H., & Murray, S. S. 2002b, ApJS, 142, 239
- Zhang et al. (2001) Zhang, Q., Fall, S. M., & Whitmore, B. C. 2001, ApJ, 561, 727
- Zwicky (1950) Zwicky, F. 1950, Experentia, 6, 441
- Zwicky (1956) Zwicky, F. 1956, Ergebnisse der Exacten Naturwissenschaften, 29, 344
- Zwicky (1964) Zwicky, F. 1964, ApJ, 140, 1467