Low Luminosity Type II Supernovae:
Spectroscopic and Photometric Evolution ††thanks: Based on observations collected at
ESO - La Silla (Chile), ESO VLT - Cerro Paranal (Chile), CTIO (Chile), TNG, WHT and JKT (La Palma, Canary
Islands, Spain) and Asiago (Italy)
Abstract
In this paper we present spectroscopic and photometric observations for four core collapse supernovae (SNe), namely SNe 1994N, 1999br, 1999eu and 2001dc. Together with SN 1997D, we show that they form a group of exceptionally low–luminosity events. These SNe have narrow spectral lines (indicating low expansion velocities) and low luminosities at every phase (significantly lower than those of typical core–collapse supernovae). The very low luminosity during the 56Co radioactive decay tail indicates that the mass of 56Ni ejected during the explosion is much smaller (M 2–8 10-3 M⊙) than the average (M 6–10 10-2 M⊙). Two supernovae of this group (SN 1999br and SN 2001dc) were discovered very close to the explosion epoch, allowing us to determine the lengths of their plateaux ( 100 days) as well as establishing the explosion epochs of the other, less–completely observed SNe. It is likely that this group of SNe represent the extreme low–luminosity tail of a single continuous distribution of SN II–P events. Their kinetic energy is also exceptionally low. Although an origin from low mass progenitors has also been proposed for low–luminosity core–collapse SNe, recent work provides evidence in favour of the high mass progenitor scenario. The incidence of these low–luminosity SNe could be as high as 4–5 of all type II SNe.
keywords:
supernovae: general - supernovae: individual: SN 1994N, SN 1997D, SN 1999br, SN 1999eu, SN 2001dc, SN 2000em, SN 2003Z, SN 1978A, SN 1994W - galaxies: individual: UGC 5695, NGC 4900, NGC 1097, NGC 57771 Introduction
It is widely known that the early spectro–photometric evolution of
core–collapse supernovae (CC–SNe) is very heterogeneous (see
e.g. Patat et al., 1994). The radius of the progenitor is
believed to play a key role in shaping the early light curve.
H–rich red giant progenitors
with large initial radii are thought to produce type II plateau supernovae
(SNe II–P). Their luminosity remains nearly constant for a relatively
long period (plateau phase, lasting 110–130 days),
during which the hydrogen envelope (in free expansion) starts to recombine,
releasing its internal energy.
The observed length of the plateau phase depends on the mass of the
hydrogen envelope [Arnett [Arnett, 1980], Popov [Popov, 1992]].
On the other hand, the unusual early light curve of SN 1987A with a broad
maximum about 3 months after the explosion is largely attributable to
its compact progenitor [Woosley et al. [Woosley et al., 1987], Arnett
[Arnett, 1987]]. The luminosity at early time is dimmer than expected
for a “typical” SN II–P. Then, with expansion, most of trapped
energy from radioactive decay of Ni is released and the luminosity rises
producing a broad maximum in the light curve.
After the plateau phase is finished, all SNe II–P (including SN 1987A)
have a steep drop in luminosity, marking the passage from the
photospheric phase to the nebular one.
The spectroscopic evolution of all SNe II–P is rather homogeneous, showing hydrogen and metal lines with P–Cygni profiles having typical widths ranging from about 15000 to 3000 km s-1 during the photospheric phase.
A common feature of most light curves of type II SNe is the linear tail, produced by the radioactive decay of 56Co into 56Fe (0.98 mag/100d). While in some cases condensation of dust grains in the ejecta and ejecta–CSM interaction phenomena may affect the late–time evolution, there is nevertheless general agreement that the radioactive tail of a “typical” CC–SN is powered by 0.06–0.10 of 56Ni [e.g. Turatto et al. [Turatto et al., 1990]; Sollerman [Sollerman, 2002]].
However, in recent years, systematic observations of non–interacting SNe in the nebular phase have shown that CC–SNe are also heterogeneous at late stages and a more complex picture has emerged as follows:
-
•
a few CC–SNe, sometimes called hypernovae [Iwamoto et al., 1998], show evidence of exceptionally large Ni masses, 0.3–0.9 [Sollerman et al. [Sollerman et al., 2000], Patat et al. [Patat et al., 2001]; see however Höflich er al. [Höflich et al., 1999] who find 0.2 of ejected 56Ni assuming asymmetric explosions]. In addition, some otherwise “normal” type II–P SNe have produced unusually bright radioactive tails, again implying large amounts of 56Ni [e.g. SN 1992am ( 0.3 ), Schmidt et al. [Schmidt et al., 1994]].
-
•
In most CC–SNe the late–time luminosity is produced by 0.06–0.10 of 56Ni, e.g. SN 1987A [II pec; Menzies et al. (1987); Catchpole et al. (1987); Catchpole et al. (1988); Whitelock et al. (1988), Catchpole et al. (1989); Whitelock et al. (1989)], SN 1988A [II–P; Ruiz–Lapuente et al. (1990); Benetti et al. (1991); Turatto et al. (1993)], SN 1993J [IIb; see e.g. Barbon et al. (1995)], and SN 1994I [Ic; Young, Baron & Branch (1995); Richmond et al. (1996) and references therein].
-
•
A few events exhibit a somewhat lower late–time luminosity, such as SN 1991G [Blanton et al., 1995], SN 1992ba [Hamuy, 2003] and SN 1999gi [Leonard et al. [Leonard et al., 2002b]; Hamuy [Hamuy, 2003]]. This may be attributable to the ejection of reduced amounts of 56Ni (0.015–0.04 ). Conversely, it could be that the luminosity of these SNe is greater, but the distances andor the effects of interstellar absorption have been underestimated. This might be the case of SN 1999em [Baron et al. (2000); Leonard et al. (2002a); Pooley et al. (2002); Hamuy et al. (2001); Elmhamdi et al. (2003)] for which recent Cepheid distance measurements [Leonard et al., 2003] suggest that the host galaxy distance was previously underestimated and, consequently, the SN luminosity probably higher. The type II–P SN 1994W [Sollerman et al., 1998], while having an exceptionally high luminosity during the photospheric era, was also particularly faint at late times with an ejected 56Ni mass below 0.015 M⊙, depending inversely on the assumed contribution to the luminosity of an ejecta–CSM interaction.
-
•
Finally, there is a small group of events having very low late–time luminosities. The prototype is SN 1997D (Turatto et al., 1998). As demonstrated in this paper, the SNe of this group are also exceptionally faint at early–times. The other SNe in this category which we study here are SN 1994N (Turatto, 1994), SN 1999br (King, 1999), SN 1999eu (Nakano Aoki, 1999) and SN 2001dc (Armstrong, 2001). As we shall see, the late–time light curves of this group require very small amounts of 56Ni, at least one order of magnitude smaller than in SN 1987A.
In a companion paper [Zampieri et al., 2003] we performed an analysis of the data of SN 1997D and SN 1999br, deriving information about the nature of the progenitor stars and the explosion energies. The early observations of SN 1999br allowed us to constrain the models discussed in previous papers [Turatto et al. [Turatto et al., 1998]; Chugai Utrobin [Chugai & Utrobin, 2000]]. We found that these explosions are under–energetic with respect to a typical type II SN and that the inferred mass of the ejecta is large (M 14–20 M⊙).
In this paper we present the spectroscopic and photometric observations of the very low luminosity SNe 1999br, 1999eu, 1994N and 2001dc. Together with the SN 1997D data [Turatto et al. [Turatto et al., 1998]; Benetti et al. [Benetti et al., 2001]] these make up almost all that is available for this group of SNe. The plan of the paper is as follows: in Sect. 2 we describe the SNe and their parent galaxies. In particular, we estimate distances, crucial for the derivation of the luminosity and, in turn, of the 56Ni mass. The observations are summarised in Sect. 3. In Sect. 4 we present photometric data and in Sect. 5 we analyze light and colour curves, focusing on the common properties of this group of SNe and making comparisons with the prototype SN 1997D. In Sect. 6 spectroscopic observations are presented. In Sect. 7 we discuss the data with particular focus on the progenitors nature. Sect. 8 is devoted to an estimate of the frequency of these low–luminosity events. A short summary follows in Sect. 9.
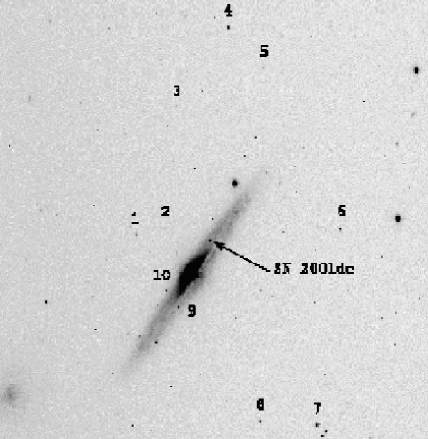
Throughout this paper we adopt H0 = 65 km s-1 Mpc-1. In all the images, North is up, East is to the left and the numbers label stars of the local calibration sequence.
2 The SNe and their host Galaxies.
In Tab. 1 we summarize the main observational data for our sample of SNe and their host galaxies. For completeness, we show also the parameters for SN 1997D in this table.
| SNe Data | 1997D | 1999br | 1999eu | 1994N | 2001dc | |||||
| (J2000.0) | 04h11m0100 | 13h00m4180 | 02h46m2079 | 10h29m468 | 14h51m1615 | |||||
| (J2000.0) | ||||||||||
| Offset SN-Gal.Nucleus | 11′′E, 43′′S | 40′′E, 19′′S | 23′′E, 157′′S | 1E, 9N | 26′′W, 28′′N | |||||
| Discovery Date (UT) | 1997 Jan 14.15 | 1999 Apr 12.4 | 1999 Nov 5 | 1994 May 10.0 | 2001 May 30.96 | |||||
| Discovery Julian Date | 2450462.65 | 2451280.9 | 2451487.5 | 2449482.5 | 2452060.46 | |||||
| Explosion Epoch (JD) | 2450361 | 2451278 | 2451394 | 2449451 | 2452047 | |||||
| Discovery Magnitude | 16.3 (Jan 15.05) | m=17.5 | m=17.3 | R=17.5 | m=18.5 | |||||
| V(max) | 19.8 | 16.8 | 17.5 | 17.3 | 18.5 | |||||
| Total Extinction | 0.089 | 0.102 | 0.113 | 0.169 | 1.7 | |||||
| Host Galaxies Data | NGC 1536 | NGC 4900 | NGC 1097 | UGC 5695 | NGC 5777 | |||||
| (J2000.0) | 04h10m5986 | 13h00m3913 | 02h46m1906 | 10h29m468 | 14h51m1855 | |||||
| (J2000.0) | ||||||||||
| Morph. Type | SB(s)c pec | SB(rs)c | SBbSy1 | S? | Sbc | |||||
| B Magnitude | 13.15 | 11.90 | 10.23 | 14.66 | 14.11 | |||||
| Galactic Extinction | 0.092 | 0.102 | 0.113 | 0.169 | 0.046 | |||||
| Diameters | 2’.0 x 1’.4 | 2’.2 x 2’.1 | 9’.3 x 6’.3 | 1’.3 x 0’.5 | 3’.38 x 0’.45 | |||||
| (km s-1) | 1461 | 968 | 1273 | 2940 | 2140 | |||||
| (=65 km s-1 Mpc-1) | 31.29 | 31.19 | 31.08 | 33.34 | 32.85 |
LEDA 111http://leda.univ-lyon1.fr/search.html;
NED 222http://nedwww.ipac.caltech.edu/index.html;
[King, 1999];
[Schlegel et al., 1998];
[Nakano & Aoki, 1999];
[Turatto et al., 1994];
[Hurst et al., 2001];
[Giuricin et al., 2000];
[de Mello & Benetti, 1997];
[Benetti et al., 2001];
this paper.
-
1.
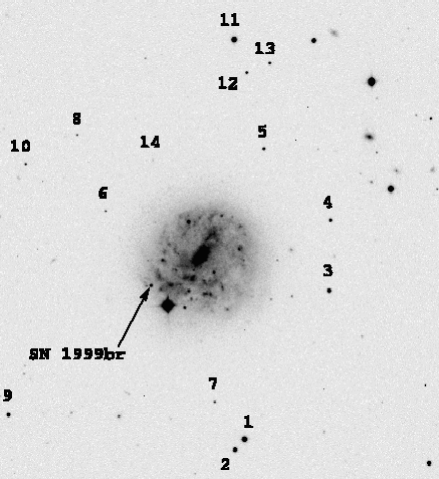
SN 1999br was discovered by King [King, 1999] in the course of the Lick Observatory Supernova Search on 1999 April 12.4 UT, and confirmed the following day, when its magnitude was about 17.5. It was located at = 13h00m41, = (equinox 2000.0), about 40′′ East and 19′′ South from the nucleus of NGC 4900 and near a bright foreground star (12 West and 15 South) of eleventh magnitude (see Fig. 1). SN 1999br is the first 1997D–like event discovered a few days after the explosion. There was no evidence of the SN on frames taken on 1999 March 27.4 UT (limiting magnitude 18.5) and on 1999 April 4.4 (limiting magnitude 17; Li, IAUC 7143). The SN was classified as a peculiar, faint type II event [Garnavich et al. [Garnavich et al., 1999a], Filippenko et al. [Filippenko et al., 1999]]. Patat et al. [Patat et al., 1999] pointed out the similarity with SN 1994N at a comparable phase and suggested that SN 1999br had produced a very low amount of 56Ni.
The host galaxy (Fig. 1) of SN 1999br, NGC 4900, is a well studied SB(rs)c galaxy lying in the direction of the Virgo Cluster. Different estimates of the distance have been published for this galaxy [Bottinelli et al. [Bottinelli et al., 1985], Kraan–Korteveg [Kraan-korteweg, 1986], Fouquè et al. [Fouquè et al. 2000], Ekholm et al. [Ekholm et al., 2000], Freedman et al. [Freedman et al., 2001]]. The recession velocity of NGC 4900 corrected for the Local Group infall onto the Virgo Cluster (from the LEDA cataloue) is km s-1. This is close to the average value for the group, dominated by NGC 4517, to which NGC 4900 belongs [ = 1125 km s-1, Giuricin et al. [Giuricin et al., 2000]], resulting in a distance modulus of . This is the final value adopted for SN 1999br (see Tab. 1).
For the galactic extinction we adopt AB = 0.102 [Schlegel et al., 1998]; no sign of internal extinction (e.g. lack of narrow interstellar Na ID lines) is present in the spectra of SN 1999br, which is not unexpected given the peripheral location of the SN in NGC 4900.
-
2.
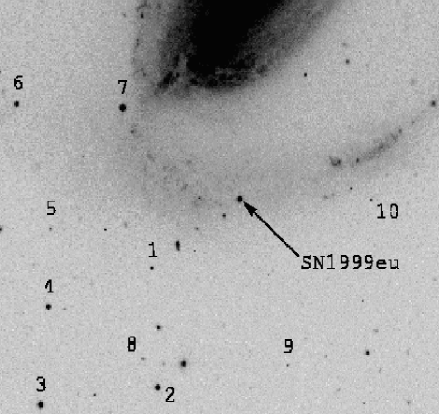
SN 1999eu was discovered by Nakano and Aoki [Nakano & Aoki, 1999] with a 0.40m reflector on 1999 November 5 and confirmed the following day. The SN was located at = 02h46m2079, = °19′061 (equinox 2000.0), 23′′ East, 157′′ South from the nucleus of NGC 1097, lying on an arm with a relatively flat background structure (see Fig. 4). Garnavich et al. (1999b) classified SN 1999eu as a peculiar SN II, with a spectrum characterized by several narrow P–Cygni lines and a typical velocity of 1500 km s-1 (from the minimum of Ba II 6142 A). Garnavich et al. concluded that SN 1999eu was an under–luminous type II event powered by the ejection of an extremely small amount of 56Ni.
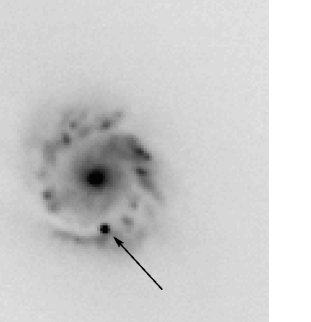
The host galaxy, NGC 1097, is a peculiar barred spiral listed in Arp’s Catalogue (1966). Sersic (1973) noted that the galaxy nucleus was morphologically peculiar with a central condensation, surrounded by an annulus of hot spots, almost uniformly and symmetrically distributed (Fig. 4). Wolstencroft et al. (1984) found that this structure was composed of H II regions emitting at radio wavelengths. The observations suggest that a burst of star formation is taking place in the ring. This is supported also by the discovery of the core–collapse SN 1992bd [Smith et al., 1992] in this region (Fig. 4). The nucleus of the galaxy is a compact radio source and shows the emission line spectrum of a Seyfert 1 (Storchi–Bergmann et al., 1997). We also note that the type II SN 2003B was discovered in a peripheral region of the galaxy, close to the nearby small elliptical companion NGC 1097A [Evans & Quirk, 2003].
Contrary to what is sometimes claimed, NGC 1097 membership of the Fornax cluster is uncertain (Giovanelli et al., 1997). The galaxy velocity is close to the average value of the group NOG 179, to which NGC 1097 belongs [Giuricin et al., 2000]. The recession velocity corrected for Virgo infall was derived from the LEDA catalogue, which yields km s-1. The resulting distance modulus is (Tab. 1).
For the galactic extinction, we adopt AB = 0.113 [Schlegel et al., 1998]. There is no spectroscopic evidence for strong extinction in the host galaxy. -
3.
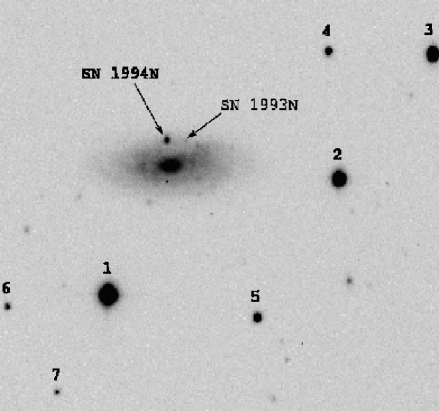
SN 1994N was serendipitously discovered by Turatto (1994) with the ESO 3.6m telescope during an observation of the type IIn SN 1993N, which exploded the year before in the same galaxy [Mueller et al., 1993]. The new SN was located at = 10h29m468, = (equinox 2000.0), 1 East and 9 North from the nucleus of the spiral galaxy UGC 5695, not far (8 East) from SN 1993N (Fig. 6).
Little information on UGC 5695 is available. It is a member of a small group of galaxies, LGG 207, which has a mean heliocentric velocity of 2856 km s-1 (Garcia, 1993), slightly larger than that of the galaxy itself. Taking LEDA’s heliocentric velocity of UGC 5695 corrected for Virgo infall and for the peculiar motion inside the group (+48 km s-1), we derive a distance modulus = 33.34.
Because evidence of strong internal extinction is missing from our spectra, we have applied only the galactic extinction correction AB=0.169 [Schlegel et al., 1998]. -
4.
M. Armstrong [Hurst et al., 2001] discovered SN 2001dc at = 14h51m1615 and = +5859028 (equinox 2000.0), 26′′ West and 28′′ North of the center of NGC 5777 (see Fig. 8). A prediscovery upper limit indicates that SN 2001dc was discovered only a few days after explosion. From early photometric monitoring, Meikle and Fassia (2001, IAU Circ. 7662) noted that this event could be classified as a SN II–P and concluded that the event was unusually under–energetic, with an absolute magnitude very low compared with normal SNe II–P.
The host galaxy NGC 5777 is an edge-on Sbc galaxy, crossed by a spectacular equatorial dust lane [Bottinelli et al., 1990]. From LEDA we derive a heliocentric velocity of 2140 km s-1 and, after correcting for Virgo infall, v 2419 km s-1, = 32.85 (see Tab. 1).
The galactic extinction is = 0.046 [Schlegel et al., 1998]. The position of the SN, not far from the nucleus and projected onto a background rich in gas and dust, leads us to suspect the presence of some internal extinction. We shall discuss this point in Sect. 5.
| Date | JD | Phase | Instrument | Range (A) | Res. (A) |
| SN 1994N | |||||
| 10/05/94 | 49482.54 | 31.5 | 3.6m+EFOSC1 | 3700–9850 | 13,17 |
| 14/05/94 | 49486.56 | 35.6 | 2.2m+EFOSC2 | 4500–7150 | 11 |
| 05/06/94 | 49508.53 | 57.5 | 3.6m+EFOSC1 | 3700–6900 | 18 |
| 30/01/95 | 49747.80 | 296.8 | NTT+EMMI | 3850–8950 | 9 |
| SN 1999br | |||||
| 23/04/99 333Hamuy Phillips, private communication | 51291.73 | 13.7 | LCO100 | 3700–9300 | 5 |
| 26/04/99 333Hamuy Phillips, private communication | 51294.64 | 16.6 | 1.54m+DFOSC | 3500–9800 | 14,19 |
| 29/04/99 333Hamuy Phillips, private communication | 51297.68 | 19.7 | NTT+EMMI | 3350–10250 | 7,6 |
| 03/05/99 333Hamuy Phillips, private communication | 51301.64 | 23.6 | NTT+EMMI | 3300–10100 | 7,6 |
| 11/05/99 333Hamuy Phillips, private communication | 51309.69 | 31.7 | 1.54m+DFOSC | 3700–10100 | 14,19 |
| 19/05/99 333Hamuy Phillips, private communication | 51317.68 | 39.7 | NTT+EMMI | 3400–10100 | 7,6 |
| 21/05/99 | 51320.02 | 42.0 | 3.6m+EFOSC2 | 3350–10250 | 14,17 |
| 20/07/99 | 51380.45 | 102.5 | 1.54m+DFOSC | 3400–9050 | 12 |
| SN 1999eu | |||||
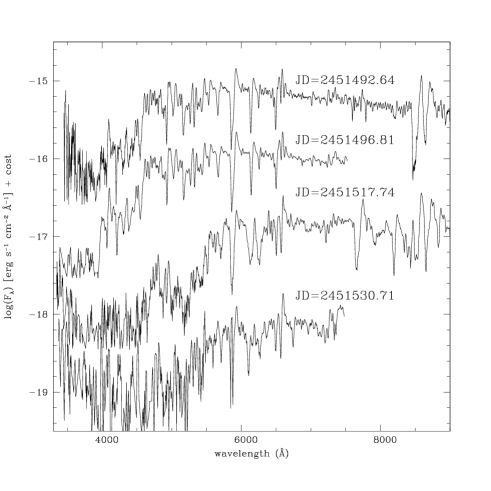
| 10/11/99 | 51492.64 | 98.6 | 1.54m+DFOSC | 3450–9050 | 11 |
| 14/11/99 | 51496.81 | 102.8 | 3.6m+EFOSC2 | 3400–7500 | 17 |
| 05/12/99 | 51517.74 | 123.7 | 3.6m+EFOSC2 | 3350–10250 | 14,17 |
| 18/12/99 | 51530.71 | 136.7 | 3.6m+EFOSC2 | 3400–7450 | 17 |
| SN 2001dc | |||||
| 10/07/01 | 52101.48 | 54.5 | INT+IDS | 4850-9600 | 17 |
| 16/08/01 | 52138.44 | 91.4 | TNG+DOLORES | 3300-8000 | 15 |
| 24/08/01 | 52146.43 | 99.4 | WHT+ISIS | 3750-9950 | 14 |
3 Summary of the Observations
Our observations of SNe 1999br, 1999eu, 1994N and 2001dc
were obtained with the ESO, CTIO, ING, TNG and Asiago telescopes.
Images and spectra were reduced using standard IRAF or FIGARO
procedures. The photometric data are presented in Sect. 4. The
magnitudes of the SNe were obtained using either PSF fitting and
template subtraction techniques, depending on the background
complexity and the availability of suitable template images.
The
journal of spectroscopic observations is reported in
Tab. 2. The spectra of SNe 1999eu, 1994N and 2001dc are
presented here for the first time. All the spectra were flux
calibrated using standard stars [selected from Hamuy et al. (1992),
Hamuy et al. (1994), Stone (1977), Stone Baldwin (1983), Baldwin
Stone (1984)] observed during the same nights.
The photometric and spectroscopic observations of SN 1999br provide good coverage of the plateau phase, but only sparse data are available in the nebular phase. In particular no post–plateau spectra are available. The discovery epoch of SN 1999eu was probably long after the explosion, at the end of the plateau, although it was well observed both photometrically and spectroscopically at late epochs. The data for SN 1994N are sparse, although they do span a period of about 22 months. The photometric coverage of SN 2001dc began about one month after discovery. Because of its faintness, it was not possible to observe it long after the end of the plateau. Three spectra were also obtained, all during the plateau phase. Clearly, the temporal coverage of individual low–luminosity SNe is incomplete and erratic. However, we shall argue that these events form a fairly homogeneous group and so, taken together, they provide a reasonably complete picture of the photometric and spectroscopic evolution of this type of supernova.

4 Light Curves
4.1 SN 1999br
| Date | JD | U | B | V | R | I | Instrument |
|---|---|---|---|---|---|---|---|
| 21/05/99 | 51319.65 | – | – | – | 17.14 (.04) | – | 1 |
| 07/06/99 | 51337.50 | 20.49 (0.29) | 18.92 (0.01) | 17.63 (0.01) | 17.02 (0.01) | 16.72 (0.01) | 2 |
| 06/07/99 | 51366.47 | 20.82 (0.37) | 19.17 (0.09) | 17.68 (0.01) | 17.04 (0.01) | 16.62 (0.01) | 3 |
| 07/07/99 | 51367.45 | 21.46 (0.55) | 19.18 (0.03) | 17.69 (0.04) | 16.98 (0.02) | 16.66 (0.01) | 2 |
| 20/07/99 | 51380.48 | 21.01 (0.31) | 19.20 (0.03) | 17.69 (0.01) | 17.04 (0.02) | 16.62 (0.01) | 3 |
| 02/04/00 | 51636.59 | – | – | 22.60 (0.15) | – | 21.18 (0.24) | 4 33footnotemark: 3 |
| 09/04/00 | 51643.69 | – | – | 22.68 (0.08) | – | – | 4 33footnotemark: 3 |
| 02/05/00 | 51666.67 | – | – | – | 21.98 (0.05) | – | 4 33footnotemark: 3 |
| 01/02/01 | 51941.87 | – | – | 24.4 | 24.6 | – | 1 |
| 26/07/01 | 52117.50 | – | – | 25.2 | 24.8 | – | 5 |
1 = ESO 3.6m + EFOSC2; 2 = TNG + OIG
3 = Danish 1.54m + DFOSC; 4 = NTT + EMMI; 5 = ESO VLT + FORS1
The Tololo Group
performed an intensive follow–up of SN 1999br during the plateau
phase with the CTIO and ESO telescopes (Hamuy, 2003; Hamuy et al.,
in prep.). This SN was also observed by us using the ESO telescopes and
TNG. Our optical photometry in the UBVRI bands is shown in
Tab. 3. The SN magnitudes were calibrated by mean of a
local sequence (Hamuy et al., in prep.) after comparison with Landolt standard
stars [Landolt, 1992].
The photometric measurements of SN 1999br were performed using the
template subtraction technique. The template images were obtained on
2000 April 2 (NTT + EMMI) and 2001 February 1 (ESO 3.6m + EFOSC2).
The errors were computed by placing some
artificial stars (having the same magnitude as the SN) at positions
close to the SN, and hence estimated the deviations in the measured
magnitudes.
The first season UBVRI light curves are shown in Fig. 2, which also includes the data from Hamuy et al. (in prep.). A prediscovery limit from IAU Circ. 7143 allows us to fix the explosion epoch between JD = 2451264.9 and 2451280.9. Another limit obtained on JD = 2451272.9 is less stringent. Hereafter we adopt as the explosion epoch JD = 2451278 3, which is compatible with the assumptions of Zampieri et al. [Zampieri et al., 2003]. While the U and B band light curves decline monotonically after discovery (the slope of the B band light curve is 3.66 mag/100d during the first 40 days and 0.61 mag/100d later), the V band light curve shows a plateau of duration at least 100 days. Between about days 30 and 100, the slope is 0.20 mag/100d. The R and I band magnitudes increase with time up to the last data point at 100 days. During the era 30–100 days, the slopes are respectively 0.18 and 0.25 mag/100d. This evolution is typical of a SN II during the plateau phase [Popov, 1992]. Unfortunately, no measurements are available between 1999 July 20, and 2001 February 1, and so the precise length of the plateau phase is undetermined. Only a few measurements or upper limits (see e.g. Fig. 12) are available during the radioactive decay epoch, but they are of special interest due to their role in the determination of the 56Ni mass.

4.2 SN 1999eu
Our photometry, covering a period of 950 days, is shown in Tab. 4. Lacking a reference image, the SN magnitudes were obtained using a PSF–fitting technique. The errors were estimated using artificial stars, as described above. In Tab.5 we give the magnitudes of the local sequence stars (see Fig. 4). SN 1999eu was observed twice in the IR with NTT + SOFI. The JHKs magnitudes are also reported in Tab. 4. From these observations alone it is impossible to reach a definitive conclusion on the evolution of the light curve in the IR bands, but they can help in evaluating the bolometric correction at selected epochs. Comparison with the IR light curves of CC–SNe compiled by Mattila & Meikle (2001) places the earlier JHK photometry of SN 1999eu about 1.2 magnitudes fainter than the average values for “ordinary” CC–SNe for this phase (100 days), and similar in magnitude to SN 1982R. We stress that the last very faint detection could also be due to IR background emission.
About 1 week after discovery, the light curves underwent an abrupt fall in brightness (especially at shorter wavelength bands). About 3 weeks post–discovery, a slower decline took over. This was observed to continue until the SN was lost behind the Sun about 9 weeks post–discovery. When the SN was recovered 7 months later, it was only marginally fainter. The second season light curves (especially the bolometric curve, cfr. Sect. 5) follow roughly the 56Co decay exponential decline rate. The slopes in the B, V, R and I passbands are given in Tab. 6. The last two very faint detections possibly indicate a flattening in the light curve, but we cannot exclude strong background contamination. By analogy with the other faint SNe (see Sect. 6) we believe that SN 1999eu was discovered near the end of the plateau phase, about 3 months after the explosion. Unfortunately, useful constraints on the length of the plateau phase are not available since the latest prediscovery image was taken about 1 year before discovery (Nakano and Aoki, 1999).
| Date | JD | U | B | V | R | I | J | H | Ks | Ins. |
|---|---|---|---|---|---|---|---|---|---|---|
| 10/11/99 | 51492.64 | 20.73 (.08) | 18.84 (.01) | 17.29 (.01) | 16.65 (.01) | 16.16 (.01) | – | – | – | 1 |
| 12/11/99 | 51494.69 | – | – | – | – | – | 15.81 (.01) | 15.61 (.01) | 15.50 (.02) | 7 |
| 13/11/99 | 51496.79 | 21.23 (.06) | 18.87 (.01) | 17.34 (.01) | 16.67 (.01) | 16.21 (.01) | – | – | – | 2 |
| 02/12/99 | 51515.66 | – | 23.06 (.13) | 20.50 (.13) | 19.01 (.04) | – | – | – | – | 4 |
| 02/12/99 | 51515.66 | – | 23.09 (.23) | – | – | – | – | – | – | 4 |
| 04/12/99 | 51517.76 | – | 23.13 (.33) | 20.56 (.05) | 19.16 (.05) | 18.41 (.18) | – | – | – | 2 |
| 10/12/99 | 51523.48 | – | 23.21 (.19) | 20.98 (.07) | 19.52 (.02) | 18.78 (.12) | – | – | – | 5 |
| 11/12/99 | 51523.64 | – | 23.17 (.17) | 21.05 (.09) | 19.63 (.02) | – | – | – | – | 4 |
| 15/12/99 | 51527.50 | – | 23.29 (.23) | 21.27 (.06) | 19.92 (.02) | – | – | – | – | 5 |
| 18/12/99 | 51530.73 | – | 23.30 (.39) | 21.28 (.12) | 20.08 (.04) | 19.04 (.03) | – | – | – | 2 |
| 18/12/99 | 51530.73 | – | – | 21.31 (.13) | – | – | – | – | – | 2 |
| 28/12/99 | 51540.65 | – | – | 21.80 (.61) | 20.59 (.21) | – | – | – | – | 4 |
| 28/12/99 | 51540.65 | – | 22.68 (.28) | – | – | – | – | – | – | 4 |
| 29/12/99 | 51541.53 | – | 23.53 (.17) | 21.81 (.12) | 20.59 (.02) | 19.36 (.01) | – | – | – | 1 |
| 04/01/00 | 51548.39 | – | 23.58 (.18) | 22.05 (.08) | 20.93 (.03) | 19.45 (.19) | – | – | – | 5 |
| 27/07/00 | 51753.92 | – | 23.78 (.17) | 22.20 (.10) | 21.23 (.08) | 20.68 (.03) | – | – | – | 3 |
| 31/08/00 | 51788.85 | – | 24.00 (.40) | 22.54 (.25) | 21.74 (.16) | 21.28 (.11) | – | – | – | 2 |
| 10/11/00 | 51858.73 | – | – | – | – | – | 21.93 (.43) | 20.62 (.34) | 20.50 (.30) | 7 |
| 19/11/00 | 51866.71 | – | – | 23.04 (.10) | – | – | – | – | – | 1 |
| 01/02/01 | 51941.54 | – | – | 23.46 (.13) | 23.46 (.10) | – | – | – | – | 2 |
| 27/07/01 | 52117.87 | – | – | 24.0 | – | – | – | – | – | 6 |
| 20/12/01 | 52263.68 | – | – | – | 23.88 (.17) | – | – | – | – | 6 |
| 23/06/02 | 52441.87 | – | – | 24.15 (.40) | – | – | – | – | – | 6 |
1 = ESO Dan1.54 + DFOSC; 2 = ESO 3.6m + EFOSC2; 3 = ESO NTT + EMMI;
4 = ESO 2.2m + WFI + chip7, 5 = TNG + OIG; 6 = VLT + FORS1 ; 7 = NTT + SOFI
| Star | U | B | V | R | I | J | H | Ks |
|---|---|---|---|---|---|---|---|---|
| 1 | 21.78 (–) | 21.13 (0.01) | 19.95 (0.02) | 19.20 (0.01) | 18.44 (0.01) | 17.31 (0.10) | 16.97 (0.01) | 16.94 (0.01) |
| 2 | 18.14 (0.01) | 17.68 (0.02) | 16.77 (0.01) | 16.19 (0.03) | 15.72 (0.02) | 15.16 (0.02) | 14.63 (0.02) | 14.67 (0.02) |
| 3 | 19.13 (–) | 18.41 (0.01) | 16.64 (0.01) | 15.56 (0.03) | 14.01 (0.06) | – | – | – |
| 4 | 20.24 (–) | 19.26 (0.02) | 18.00 (0.01) | 17.14 (0.01) | 16.41 (0.01) | 15.55 (0.10) | 14.91 (0.04) | 14.84 (0.03) |
| 5 | – | 23.31 (0.01) | 21.43 (0.01) | 20.41 (0.02) | 19.40 (0.02) | 18.12 (0.06) | 17.35 (0.12) | 16.93 (0.05) |
| 6 | 19.45 (0.01) | 18.49 (0.02) | 17.58 (0.02) | 16.94 (0.03) | 16.38 (0.01) | – | – | – |
| 7 | 17.23 (0.03) | 16.95 (0.03) | 16.23 (0.01) | 15.77 (0.03) | 15.38 (0.01) | 14.90 (0.01) | 14.51 (0.02) | 14.51 (0.06) |
| 8 | 22.85: (–) | 23.04 (0.05) | 21.22 (0.06) | 20.45 (0.04) | 20.08 (0.01) | 18.86 (0.09) | 18.03 (0.02) | 17.78 (0.11) |
| 9 | 21.06 (–) | 21.26 (0.02) | 20.63 (0.01) | 20.23 (0.02) | 19.80 (0.03) | 19.34 (0.02) | – | – |
| 10 | 22.29 (–) | 21.57 (0.02) | 20.59 (0.03) | 19.97 (0.02) | 19.52 (0.06) | 18.61 (0.11) | – | 17.99 (0.03) |
| band | 95–125 | 120–160 | 150–365 | 355–550 | 540–1050 |
|---|---|---|---|---|---|
| 19.77 | 1.60 | 0.11 | 0.61 | – | |
| 14.31 | 4.78 | 0.07 | 0.66 | 0.14 | |
| 10.05 | 5.68 | 0.14 | 1.17 | 0.13 | |
| 9.48 | 3.30 | 0.60 | 1.74 | – |
4.3 SN 1994N

| Date | JD | U | B | V | R | I | Instrument |
|---|---|---|---|---|---|---|---|
| 17/03/94 | 49428.5 | – | – | 22.50 | 21.20 | – | 1 |
| 09/05/94 | 49482.48 | – | 19.44 (0.04) | 18.50 (0.02) | 18.12 (0.02) | – | 2 |
| 13/05/94 | 49486.48 | 20.44 (0.25) | 19.48 (0.01) | 18.55 (0.01) | 18.14 (0.01) | 17.95 (0.02) | 3 |
| 05/06/94 | 49508.52 | – | – | 18.52 (0.05) | 18.05 (0.04) | – | 2 |
| 31/12/94 | 49717.76 | – | – | – | 21.90 (0.15) | – | 3 |
| 10/01/95 | 49727.80 | – | – | 22.77 (0.03) | 22.03 (0.04) | – | 4 |
| 30/01/95 | 49747.74 | – | – | – | 22.22 (0.08) | – | 1 |
| 16/03/96 | 50158.5 | – | 22.23 | 22.95 | 22.07 | – | 2 |
1 = NTT + EMMI; 2 ESO 3.6m + EFOSC1; 3 = ESO 2.2m + EFOSC2; 4 = NTT + SUSI
| Star | U | B | V | R | I |
|---|---|---|---|---|---|
| 2 | – | – | 14.54 (0.01) | 14.16 (0.01) | – |
| 3 | – | – | 14.93 (0.03) | 14.49 (0.01) | – |
| 4 | 18.19 (–) | 18.21 (0.02) | 17.47 (0.01) | 17.04 (0.02) | 16.77 (–) |
| 5 | 17.33 (–) | 17.60 (0.02) | 16.98 (0.01) | 16.67 (0.01) | 16.40 (–) |
| 6 | – | 20.06 (0.02) | 18.85 (0.01) | 18.21 (0.01) | 17.74 (–) |
| 7 | – | – | 20.24 (0.01) | 18.91 (0.04) | 17.32 (–) |
The photometry of SN 1994N is sparse (see Tab. 7). It was obtained using ESO–La Silla telescopes, often under poor weather conditions. The late–time photometry was performed using the template subtraction technique. Again, the errors were estimated using artificial stars. As standard stars we adopted the local sequence in the field of UGC 5695 calibrated during some photometric nights in 1993 (during the follow–up of SN 1993N). The magnitudes of the sequence stars are given in Tab. 8. The light curve shows that this SN was discovered during the plateau phase. The prediscovery upper limits constrain the explosion epoch to no earlier than 7 weeks before discovery (see Fig. 7). We measure the slope during the plateau and find respectively 0 and 0.3 mag/100d, although, given that there are only a few points in the V and R band light curves, we regard this measurement as tentative. At late times, the observations indicate 1 mag/100d, although the photometric errors are sometimes quite large.
4.4 SN 2001dc

| Date | JD | U | B | V | R | I | Instrument |
|---|---|---|---|---|---|---|---|
| 22/06/01 | 52083.43 | – | 21.27 (0.06) | 19.84 (0.03) | 19.08 (0.01) | 18.49 (0.01) | 1 |
| 04/07/01 | 52095.42 | – | 21.22 (0.09) | 19.78 (0.03) | 19.06 (0.02) | 18.42 (0.02) | 1 |
| 13/07/01 | 52104.46 | – | 21.61 (0.08) | 19.78 (0.04) | 19.00 (0.03) | 18.37 (0.02) | 1 |
| 20/07/01 | 52111.44 | 23.65 (0.44) | 21.75 (0.04) | 19.86 (0.04) | 19.02 (0.02) | 18.33 (0.02) | 2 |
| 17/08/01 | 52139.42 | – | 22.20 (0.26) | 20.00 (0.10) | 19.20 (0.07) | 18.52 (0.04) | 3 |
| 18/08/01 | 52140.39 | – | – | 20.08 (0.06) | 19.20 (0.05) | 18.49 (0.03) | 4 |
| 19/08/01 | 52141.36 | – | 22.40 (0.34) | – | – | – | 4 |
| 27/08/01 | 52149.32 | – | – | 20.38 (0.19) | 19.44 (0.15) | 18.72 (0.05) | 4 |
| 13/09/01 | 52166.36 | – | 23.95 | – | – | – | 3 |
| 13/09/01 | 52166.36 | – | – | 22.16 (0.30) | 21.07 (0.13) | 20.15 (0.08) | 3 |
| 08/10/01 | 52191.26 | – | – | – | 21.24 (0.27) | 21.23 (0.37) | 4 |
| 09/10/01 | 52192.33 | – | – | – | – | 20.20 (0.50) | 4 |
| 12/10/01 | 52195.33 | – | – | – | 21.34 (0.30) | 20.55 (0.30) | 4 |
| 13/10/01 | 52196.26 | – | – | – | – | 20.63 (0.15) | 4 |
| 18/10/01 | 52201.33 | – | – | 22.27 (0.65) | 21.69 (0.30) | 20.70 (0.27) | 3 |
| 18/10/01 | 52201.35 | – | – | – | – | 20.72 (0.27) | 3 |
| 19/12/01 | 52262.76 | – | – | 22.89 (0.30) | 22.02 (0.32) | – | 3 |
1 = JKT + JAG; 2 = TNG + OIG; 3 = TNG + Dolores; 4 = Asi1.82m + AFOSC
| Star | U | B | V | R | I |
|---|---|---|---|---|---|
| 1 | 19.72 (–) | 19.68 (0.01) | 18.88 (0.01) | 18.40 (0.01) | 17.94 (0.02) |
| 2 | 20.45 (–) | 20.97 (0.02) | 20.56 (0.01) | 20.28 (0.01) | 20.06 (0.01) |
| 3 | – | 20.35 (0.01) | 19.92 (0.01) | 19.64 (0.01) | 19.28 (0.01) |
| 4 | – | 19.24 (0.01) | 18.70 (0.01) | 18.37 (0.01) | 18.04 (0.01) |
| 5 | – | 20.87 (0.02) | 20.42 (0.02) | 20.09 (0.01) | 19.88 (0.02) |
| 6 | 21.60 (–) | 20.77 (0.01) | 19.26 (0.01) | 18.33 (0.01) | 17.38 (0.01) |
| 7 | 20.51 (–) | 19.71 (0.03) | 18.51 (0.01) | 17.79 (0.01) | 17.10 (0.02) |
| 8 | 19.22 (–) | 19.21 (0.01) | 18.33 (0.02) | 17.85 (0.01) | 17.40 (0.01) |
| 9 | 19.75 (–) | 19.43 (0.01) | 18.57 (0.01) | 18.02 (0.01) | 17.56 (0.02) |
| 10 | – | 22.16 (0.02) | 20.75 (0.02) | 19.83 (0.03) | 18.87 (0.04) |
Our photometry measurements of SN 2001dc, lacking template images,
were obtained using the PSF fitting technique. The magnitudes are
reported in Tab. 9, while the light curves are shown in
Fig. 9. The large errors at late times (estimated with
the artificial stars method) are caused by the complex background upon
which the SN is projected. Tab. 10 gives the magnitudes
of the local sequence stars (Fig. 8). In the
following, we adopt 2001 May 17 (JD = 2452047 5) as the explosion
epoch, this being
intermediate between the upper limit of May 12 and the first (prediscovery)
detection on May 21.98.
The light curve shows a plateau persisting to 90–100 days
post–explosion. The slope of the light curves for three
representative epochs are reported in Tab. 11. Despite
the large errors due to the faintness of the SN and its position, the
slopes in V and R during 115–220 days are rather close to the
luminosity decline rate of 56Co.
| band | 35–70 | 90-120 | 115–220 |
|---|---|---|---|
| 1.88 | – | – | |
| 0.02 | 7.97 | 0.79 | |
| -0.27 | 8.00 | 0.90 | |
| -0.57 | 6.17 | 1.59 |
5 COLOR EVOLUTION, ABSOLUTE LUMINOSITY AND BOLOMETRIC LIGHT CURVES
In order to establish the intrinsic luminosity of our sample of
supernovae, it is essential to establish their distances, phases and
the extent to which they are subject to extinction. We have already
estimated the distance moduli (Section 2) and these are listed in
Tab. 1.
As explained in Section 4, prediscovery limits for SNe 1999br and
2001dc allow us to pin down their explosion epochs to within a few
days and hence establish clearly the phase of these events at any
given date. In addition, below we shall show that the similarity of
the spectrum of SN 1999br at a phase of 100 days to the earliest
available spectra of SNe 1997D and 1999eu allows us to fix the phases
of these two events. Likewise, we determined the phase of SN 1994N
through the similarity of its earliest spectrum to a spectrum of
SN 1999br at 30 days. Thus, we deduce that the phases of our
five CC–SNe at discovery were: SN 1994N: 31.5 days, SN 1997D: 101.7 days,
SN 1999br: 2.9 days, SN 1999eu: 93.5 days, SN 2001dc: 4.5 days.
For extinction, we have argued that for SNe 1994N, 1997D, 1999br and 1999eu we
need only to consider the effect of the Milky Way ISM.
However, to estimate the extinction towards SN 2001dc, we must first
consider the colours and colour evolution of the five CC–SNe. This
is also valuable as an additional mean of testing the degree of
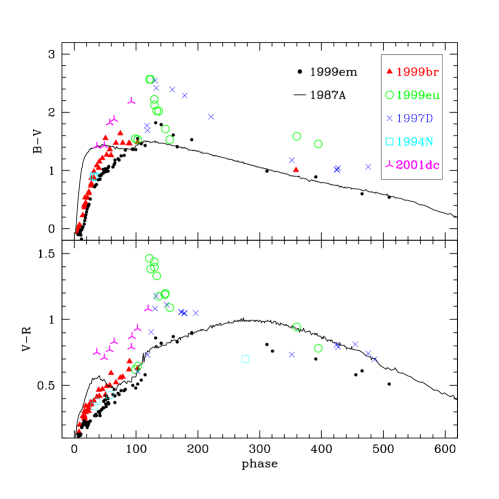
homogeneity of the sample. The (B–V) and (V–R) colours are shown as a
function of phase and compared with those of the peculiar SN 1987A and
the “normal” type II–P SN 1999em in
Fig. 11. Corrections for galactic extinction only have been
applied to the sample CC–SNe. The SN 1987A and SN 1999em
colours have been corrected for the total extinction to these events,
using respectively AV = 0.6 [West et al., 1987] and AV = 0.31 [Baron et al., 2000].
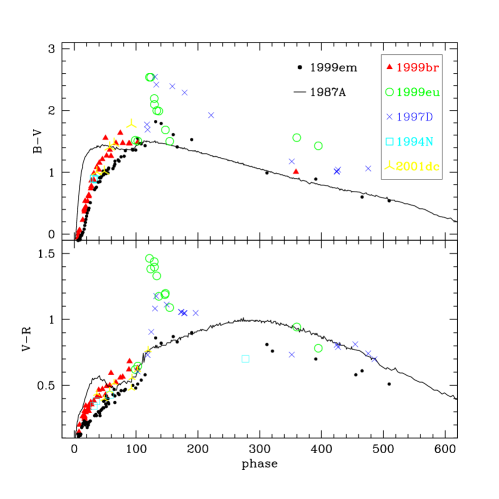
For SN 2001dc, the similarity of its colour evolution and its spectra to those of SN 1999br at similar epochs
during the plateau phase, plus its location close to a dusty region in
NGC 5777, leads us to argue that its redder colours (relative to
SN 1999br) are due to strong extinction in the host galaxy (see
Fig. 8) as well as in the Milky Way. Therefore, in
Fig. 11, we show the same data, but with the SN 2001dc
colours dereddened to match those of SN 1999br. From this, we deduce
the total reddening to SN 2001dc to be E(B-V) = 0.42 and
E(V-R) = 0.33, corresponding to AB = 1.7. The adopted
extinction values for all the SNe are shown in Table 1.
Inspection of Fig. 11 shows that, during the first 100 days,
the data are consistent with there being a similar colour evolution
for the 5 sample SNe. During the plateau phase the (B–V) colour reddens
for the first 60 days reaching (B–V) 1.5. It then remains
at about this value for the next 60 days. Beyond 100 days, good
photometric coverage is available for only 2 of the 5 sample SNe
viz. for SNe 1997D and 1999eu. At 120 days, the (B–V) colour of
these two events suddenly reddens further to (B–V) 2.5. This
coincides with the epoch of the steep post–plateau decline
(cf. Figs. 5 and 12). After this, the (B–V) colour of these two SNe
become bluer, with SN 1999eu showing a particularly rapid change. The
plot of (V–R) versus time shows a rather similar behaviour.
SNe 1987A and 1999em show a somewhat different behaviour, and in particular
does not show a rapid change at 120–160 days.
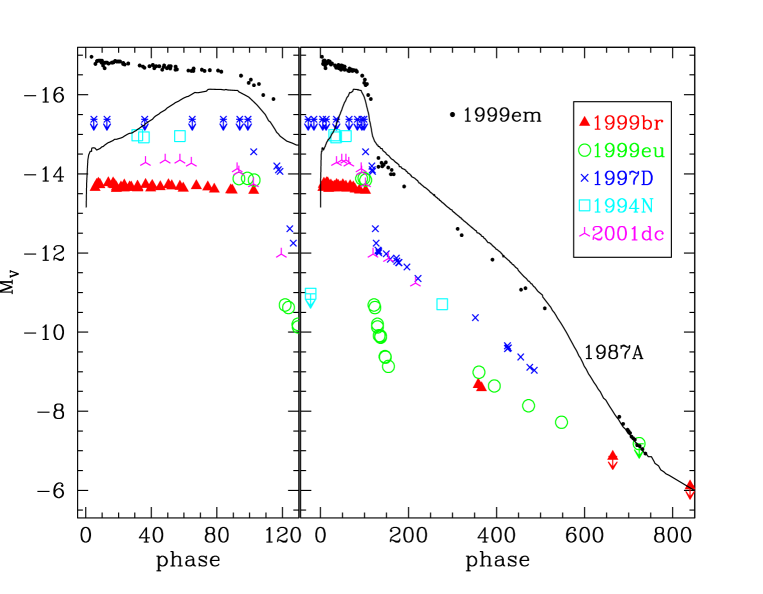
Having established the distances, phases and extinctions for the five CC–SNe, we derived MV light curves for these events. These light curves are plotted in Fig. 12 and compared with that of SNe 1987A and 1999em. It can be immediately seen that for all epochs at which photometry is available, i.e. during both the plateau and nebular phases, the 5 sample SNe are fainter than both SNe 1987A and 1999em. In the case of SN 1999br, this includes epochs as early as just 1 week after explosion. Given that SN 1987A itself was unusually under–luminous, we conclude that our CC–SNe, at least when observed, were all exceptionally faint. For example, during the plateau phase, SN 1999br had a magnitude of just M13.76, while for SN 2001dc M14.29. We conclude that, in spite of the incomplete coverage of individual light curves, it is likely that the five CC–SNe considered here were all exceptionally subluminous throughout both the plateau phase and the later radioactive tail.
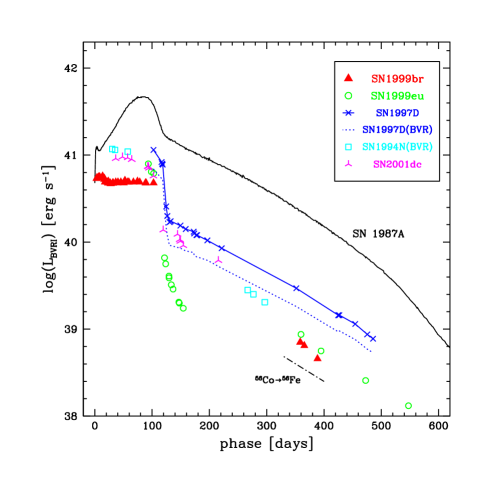
The pseudo–bolometric “OIR” light curves (shown in Fig. 13) were computed integrating the emitted fluxes in the B, V, R and I passbands at the epochs for which measurements were available, and interpolating between points adjacent in time when a measurement was missing. In the case of SN 1994N only a single point was available in the I band and the integration had to be restricted to the BVR bands. To illustrate the effect of this limitation, we show also the equivalent BVR light curve of SN 1997D as a dotted line. The 5 SNe are fainter than SN 1987A at any epoch: i.e. the plateau luminosity of SN 1999br (the best monitored event) is LBVRI 5 1040 erg s-1, a factor of 10 times lower than luminosity of SN 1987A at the epoch of the broad maximum. The earlier light curves of SNe 1994N and 2001dc show similar magnitudes and evolution, while SN 1999br is about a factor 2 times fainter. Between 100 and 200 days, SNe 1997D, 1999eu and 2001dc show somewhat different magnitudes and/or evolution. SN 1999eu shows a particularly dramatic drop in luminosity during this time. Between days 270 and 550, the magnitudes and decline rates of SNe 1999br and 1999eu are roughly consistent with their being powered at this time by a small amount of 56Ni (see also Sect. 7).
6 Spectroscopy
The SNe discussed in this paper have also been observed spectroscopically, and despite their faintness, later coverage extends into the nebular phase for some events. In this section we present spectra for SNe 1994N, 1999br, 1999eu and 2001dc. We discuss these spectra together with those of SN 1997D (Benetti et al., 2001). In particular, we shall illustrate the use of spectral similarities to determine the phases of some of the CC–SNe.
6.1 Individual Properties


-
1.
SN 1999br, the supernova for which we have the best coverage at early times, shows the typical features of a type II event (Fig. 14).
The earliest spectrum indicates a phase of about +10 days post-explosion, viz. a blue continuum, with relatively broad P–Cygni lines of H I and Fe II. This is consistent with the phase derived previously from the light curve. The narrow lines arise from poor subtraction of an underlying H II region. During the first month, the spectra exhibit P–Cygni lines profiles of H I, Fe II (main lines are identified as: multiplets 27, 28, 37, 38 between 4100 and 4700 A; multiplet 42 at 4924 A, 5018 A and 5169 A; multiplets 48 and 49 at between 5200 and 5500 A; multiplets 40, 74, 162, 163 between 6100 and 6500 A), Ca II (HK and the IR triplet), Na I ( 5890–5896 A), Ti II (many multiplets below 5400 A), Ba II (multiplet 1 at 4554 A, 4934 A; multiplet 2 at 5854 A, 6142 A, 6497 A) and Sc II (e.g. multiplets 23, 24, 28 with the strong line at 6246 A, 29 with a strong blend at 5660 A, 31 with line at 5527 A). With age the continuum becomes redder, and the absorption lines become deeper and less blue–shifted. After a gap of 60 days, the final spectrum was taken at about 100 days after explosion, and this shows that a significant evolution had taken place in the intervening interval. Numerous P–Cygni profiles dominate the spectrum, and their narrow width indicates very low expansion velocities ( 1000 km s-1). The most prominent ones are identified as Ca II, Ba II and Sc II (see Section 6.3). The spectrum at this stage closely resembles that of SN 1997D at discovery (see Fig. 18). The line identifications at phase 100 days will be discussed in detail in Sect. 6.3.
-
2.
Four spectra are available for SN 1999eu (Fig. 15). The first two, taken just after discovery, are strikingly similar to those of SN 1999br at about 100 days post–explosion (Fig. 18), i.e. the continuum is very red and the lines show expansion velocities of only 1000 km s-1. The remaining two spectra, taken during the fast post–plateau drop, show even redder continua in agreement with the colour evolution discussed above.
-
3.
The earliest two spectra of SN 1994N (Fig. 16) show the typical appearance of SNe II during the photospheric phase [Turatto et al., 1994]. The expansion velocity deduced from the H minimum (4500 km s-1) is substantially lower than that measured in “normal” SNe II (see e.g. 20), but is similar to those of SN 1999br 3–4 weeks post–explosion. The latest spectrum was taken when the supernova was well into its nebular phase, and is reminiscent of the spectrum of SN 1997D at about 11 months post–explosion [Benetti et al., 2001]. Besides H (FWHM 1200 km s-1), the main spectral features are the [Ca II] 7291–7323 A doublet, the Ca II IR triplet, and the strong emission lines of [O I] 6300–6364 A. We also tentatively identify Mg I] 4571 A, H, Na ID and [Fe II] 7155 A.
-
4.
Only three spectra of SN 2001dc are available (Fig. 17), taken during the plateau phase, at 54, 91 and 99 days post–explosion. The continuum is red and there is little evolution in the spectral features during this time interval. The last 2 spectra of SN 2001dc resemble those of 1999br and SN 1999eu at 100 days post–explosion, especially the strong and narrow P–Cygni lines of Ba II and Sc II. These spectra correspond to the beginning of the departure from the plateau phase. A strong P–Cygni line is present in the last spectrum with its emission peak at 9245 A. We tentatively identify this with Sc II 9234 A.
In Fig. 18, we compare the spectra of SN 1997D (1997 January 15), SN 1999br (1999 July 20) and SN 1999eu (1999 November 14). It can be seen that these are strikingly similar both with respect to the continua and line components. We suggest, therefore, that these spectra were acquired at similar phases (see also Zampieri et al., 2003). The light curves of these SNe indicate that this phase was probably about the end of the plateau phase, with the SN 1999br light curve indicating that this was 100 days post–explosion. For SN 1994N, in spite of the paucity of observations, comparison of the first spectrum taken on 1994 May 10 with a spectrum of SN 1999br obtained on 1999 May 11, suggests that SN 1994N was discovered about 1 month after the explosion. Indeed the two spectra show the same features and similar expansion velocities ( 2500 km s-1, deduced from the minimum of Fe II 5018 A line). The adopted epochs of explosion for all five CC–SNe are given in Tab. 1. These were used in the analysis of colour and light curves in Sect. 5.
6.2 The Common Spectro–photometric Evolution of the Low Luminosity SNe II

We have used similarities in the spectra of the low-luminosity SNe to date the explosions. In order to better illustrate the properties of this group of SNe, we now use all the available data to describe the general spectro–photometric evolution of this class. In Fig. 19 we show the temporal evolution of selected spectral windows.
The first 40 days of evolution (spectra 1–8) are covered mainly by the SN 1999br spectra (cfr. also Fig. 14). The spectra evolve from a continuum dominated by Balmer lines to a more complex appearance with strong lines of Na I, Ba II and the Ca II IR triplet. The expansion velocities are relatively low compared with “normal” SNe II, slowing from 5000 to 3000 km s-1 during this early era. The spectra of SN 1994N (No. 5) and SN 2001dc (No. 8) fit well into the evolutionary sequence of SN 1999br. During this phase, the absorption trough velocities exhibit rapid movement towards lower velocities (see Fig. 19 and below).
The next spectrum (No. 9) takes us well into the second half of the plateau phase. Clearly the spectroscopic form has changed significantly in the intervening 37 days. The remainder of the plateau era (spectra 9–12 in Fig. 19) is represented by a single spectrum each from SNe 1997D, 1999br, 1999eu and 2001dc. As described earlier, we used the relative similarity of these spectra at about this epoch to pin down the phases of SNe 1997D and 1999eu. By this time (phase 80–100 days), the absorption troughs of the more prominent lines indicate relatively low velocities at the photosphere, e.g. H and Sc II 6246 A give velocities of 1000–1500 km/s (Fig. 20). In addition, new narrow lines of low excitation elements like Ba II, Sc II, Fe II, Sr II, Ti II have appeared (see also Figs. 23–26) and the continuum becomes redder (see e.g. Fig. 14). In particular the Ba II lines become the strongest features in the spectra. Note that the contribution of Sr II at short wavelengths is also supported by the detection of strong lines of multiplet 2 (at 10037 A, 10327 A and 10915 A) in the IR spectrum of SN 1997D presented by Clocchiatti et al. (2001).
The evolution up to 1 month after the plateau (spectra from
about 13 to 16) is characterized by the transition to a nebular
spectral form, with the gradual fading of permitted metallic lines and
P–Cygni profiles. In this phase, narrow forbidden lines have steadily
strengthened (in particular [O I] 6300–6364 A and
[Ca II] 7291–7323 A, but also some multiplets of [Fe
I], [Fe II] and Mg I]), as reported also in Fig. 5 of Benetti et
al. [Benetti et al., 2001].
The spectra of the latest phase (Nos. 17–20) resemble those of normal SNe II, with the usual (though narrower) emission features attributed to forbidden transitions [Turatto et al., 1993]. Nevertheless, the most prominent line is H, and Na ID is still visible as a faint emission line after almost 1.5 years.
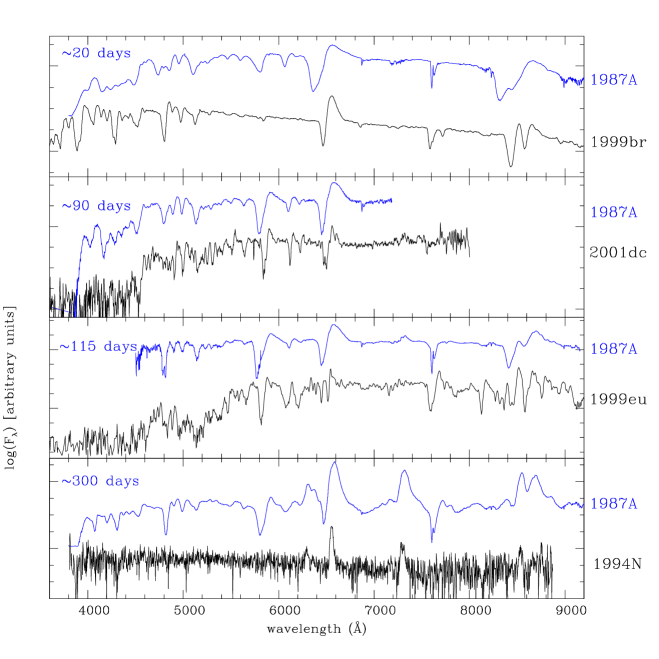
A comparison between the spectra of the faint SNe II with those of SN 1987A at comparable phases is shown in Fig. 22. At the 20 day and 90 day epochs, the main spectral lines are the same, but the lines of our subluminous CC–SNe have narrower widths implying lower ejecta expansion velocities. In addition, at 90 days the subluminous SNe show stronger absorption components of Ba II. As noted by Turatto et al. (1998) for SN 1997D, this is probably not an effect of overabundance, but is simply a consequence of a lower ejecta temperature.
We conclude that a characteristic property of subluminous CC–SNe is the
very low expansion velocity of the ejecta.
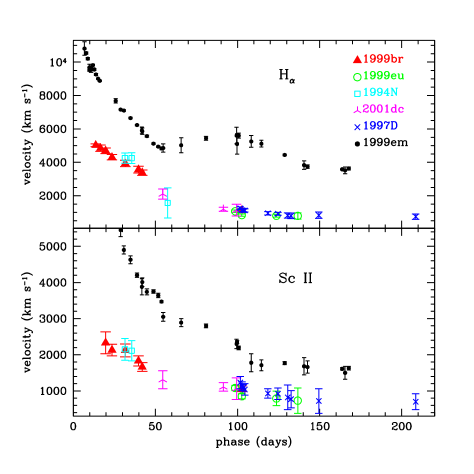
Indeed the photospheric velocities inferred from the absorption minima
of H and Sc II 6246 A show a common evolutionary path
(Fig. 20). During the first 50 days the line
velocities decrease monotonically from 5000 to 1000–1500 km
s-1. Somewhere towards the end of the plateau the velocities
level off at a value 1000 km s-1.
At all epochs line velocities are lower than those of the “typical” SN II–P
1999em (cf. Fig. 20).
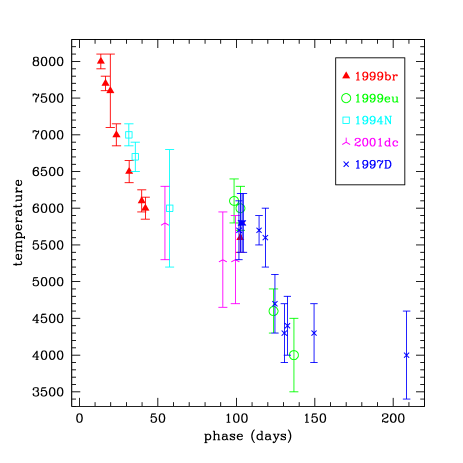
We have also analyzed the continuum temperature from the spectra of the SNe by performing a Planckian fit in regions not affected by line blanketing (e.g. between about 6000 and 8000 A). The results, shown in Fig. 21, are fairly consistent with a common evolution. Starting from a 8000 K at phase 13 days, the temperature falls reaching a value of 5000–6000 K after 30–40 days. During the remainder of the plateau the temperature remains almost constant at 5500 K. Presumably this corresponds to the recombination temperature of the hydrogen as the photophere recedes through the H–envelope. The end of the plateau phase is marked by the onset of a steep temperature decline, settling at T 4000 K as the supernova enters its nebular phase.
6.3 Identification of the Spectral Lines
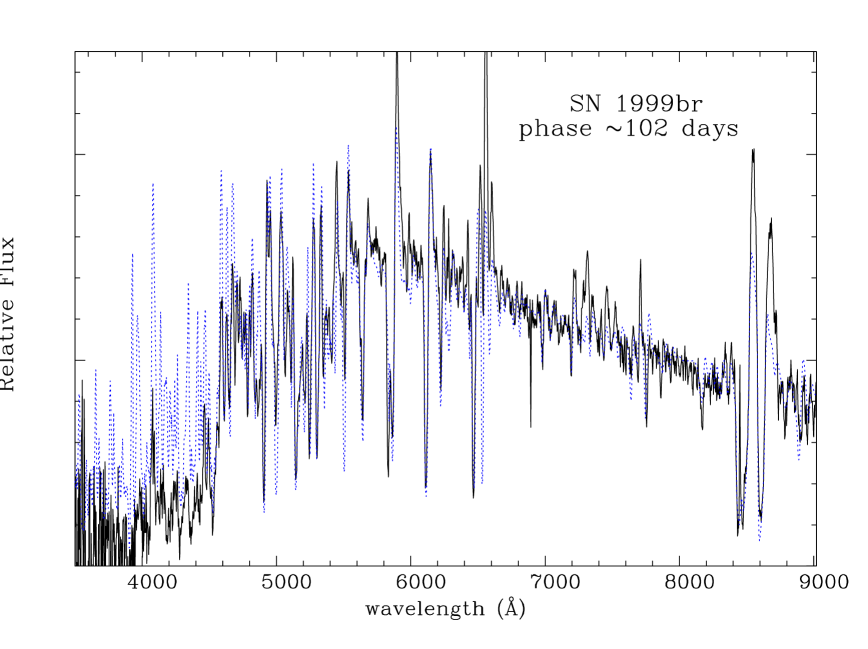
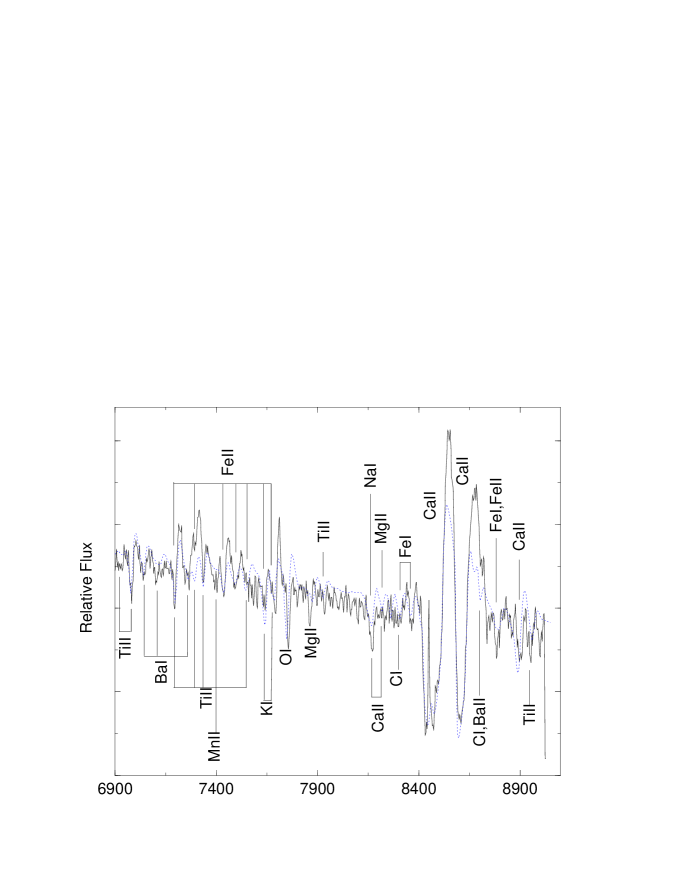
The multiplicity of narrow P–Cygni features in the late photospheric spectra of the faint SNe II can help us to identify unambiguously the species responsible. To exploit this opportunity we have modelled the spectra of SN 1999br at phase 102.5 days.
We used the parameterized code, SYNOW [Fisher, 2000], to construct
synthetic photospheric spectra which were then compared with the
observations. The code works in the Sobolev approximation and
includes a number of simplifying assumptions. The line–forming
envelope surrounding the continuum–emitting region expands
homologously and with spherical symmetry. The line source function is
taken to be that of resonance scattering. The optical depth of
the strongest optical line of each ion is a free parameter. For all
the other lines of a given ion, is found assuming Boltzmann
excitation [Jeffery & Branch, 1990].
Other free parameters are the velocity
at the photosphere (vph), the continuum blackbody temperature
(Tbb), the excitation temperature (Texc) of each ion
and the radial
dependency of the optical depths. We adjusted these parameters to
produce a plausible spectral match to the 102 day spectrum of SN
1999br. In the final model we adopted a power–law radial dependency
of index = 4 with Tbb = 5600 K and vph = 970 km
s-1; Texc varies among the ions, but it is about 4000–5000
K for neutral ions and 8000–10000 K for ionized species.
The resulting spectral model, obtained including 22 different ions,
is compared with the whole observed
spectrum in Fig. 23, and with expanded sections shown in
Figs. 24–26.
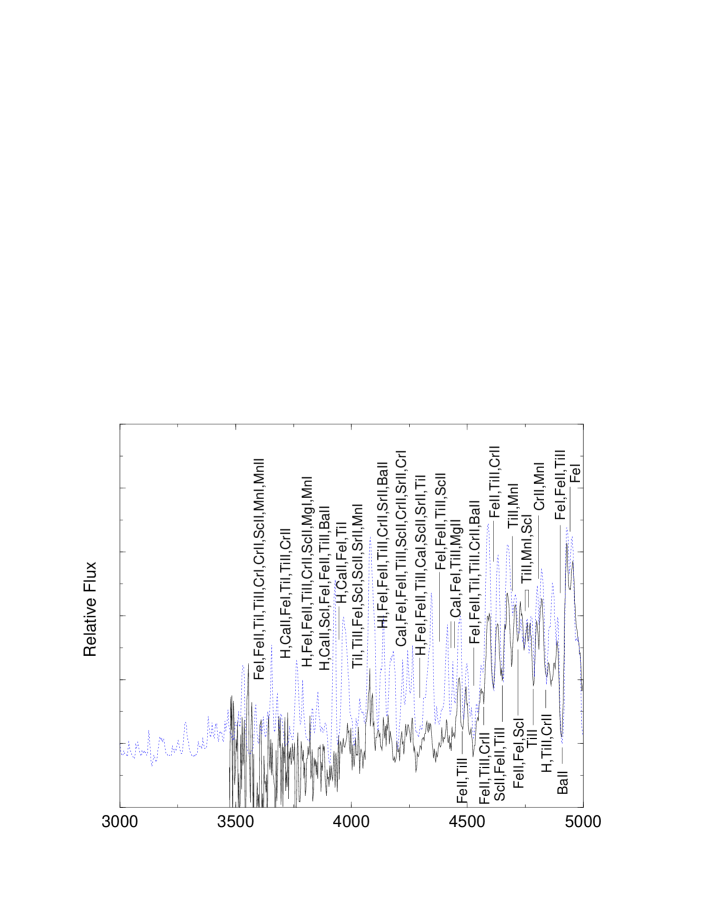
The main spectral features are generally quite well reproduced. In
addition the strong line–blanketing behaviour in the blue ( 4600 A) is, at least qualitatively, also seen in the model
(Fig. 24).
The line–blanketing is due to the presence of many strong metallic
lines, including contributions from neutral and singly–ionized ions of
Fe, Ti, Cr, Sc, Mn, Ca and Sr. The Sr II lines are particularly deep,
while the Balmer lines are fainter than is observed in normal SNe
II.
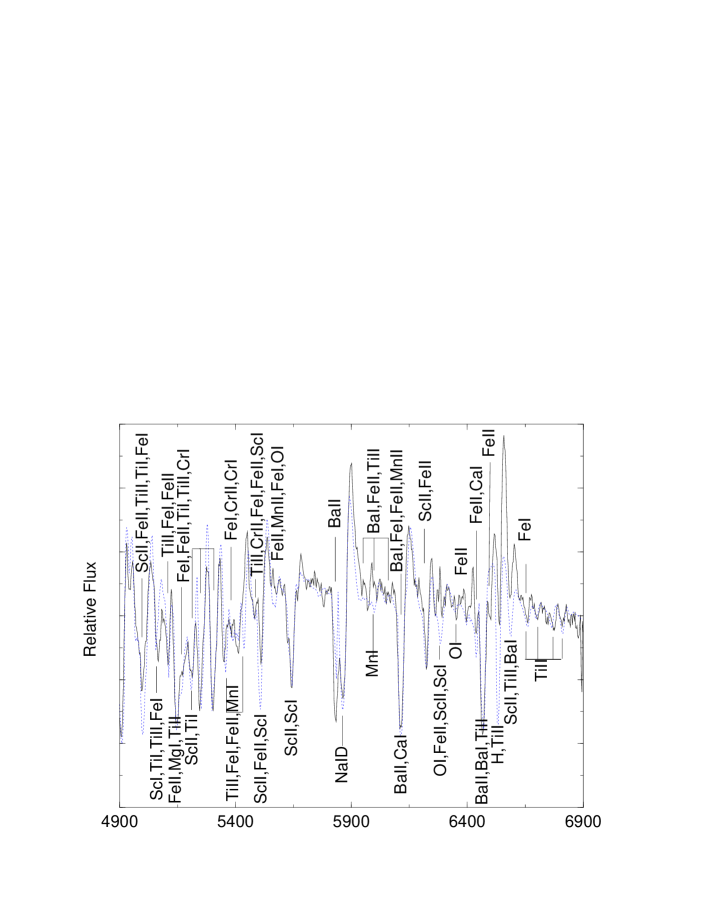
The region between 4600 and 6500 A (Fig. 25) is dominated by
lines of Fe II, Ti II, Sc II and Ba II, although contributions from
lines of neutral ions cannot be excluded. At this phase the
absorption lines of Ba II are exceptionally strong, exceeding in depth
the Na ID and H lines. The reproduction of the spectrum in
the H region is poor due to the inadequacy of the pure
resonance–scattering assumption for the H line.
Nevertheless, to reproduce the complex profile in this region, we
require the simultaneous presence of Ba II, H and Sc II.
On the red tail of H up to 7700 A (Fig. 25
and Fig. 26) many narrow, faint Ti II and Fe II lines are
superimposed on a strong continuum. However, also present may be
growing contributions from nebular emission lines, in particular [Fe
II] and [Ca II] 7291, 7324 A. As we move still further
to the red, the spectrum becomes dominated by the Ca II IR
features. Other tentatively identified lines include: K I, O I, Mg II,
Na I, C I, Fe I, Fe II, Ba II and Ti II (Fig. 26).
7 Discussion
Following our determination of the explosion epochs, we can conclude
that our observations are consistent with low–luminosity SNe having
plateaux of duration 100 days, similar to that seen in more
normal SN II–P events. This may constitute evidence for the presence of
massive envelopes around low–luminosity SNe [Zampieri et al., 2003].
We attribute a 100 day plateau to SN 1997D. This is
significantly longer than that estimated by Turatto et
al. [Turatto et al., 1998] and Benetti et al. [Benetti et al., 2001].
In general, the plateau luminosities of the faint CC–SNe are unusually low, and show a range
of values between the different events spanning more than 1 magnitude
(see Sect. 5, Fig. 12 and Fig. 13). Although
spectroscopic coverage is incomplete for individual events, the data
are consistent with the low–luminosity SNe having a similar
spectroscopic evolution, characterised by unusually narrow line
widths.
At the end of the plateau the light curves show a steep decline,
typically 3 magnitudes in 30–50 days. This effect has also been
observed in other type II–P SNe [e.g. SN 1994W, Sollerman et al. (1998);
SN 1999em, Elmhamdi et al. (2003)]. Thereafter, for 3 of the 4 SNe for
which we have post–plateau light curves, the decline rate is consistent
with the power source being the radioactive decay of 56Co. The
exception is SN 1999eu, discussed below.
Assuming complete trapping of the –rays, we compare the
“OIR” pseudo–bolometric luminosities (Fig. 13)
with those of SN 1987A at similar epochs and, using the relation
MSN(Ni) = 0.075 M⊙, we obtain the
following useful lower limits for the ejected 56Ni masses:
0.008M⊙ for SN 1997D, 0.002 M⊙ for
SN 1999br, 0.006 M⊙ for SN 1994N (using only the BVR bands), 0.006 M⊙ for SN 2001dc (with a large
uncertainty due to the poor late time photometry). We note that the
value for SN 1997D is a factor 4 higher than the value estimated by
Turatto et al., 1998, due to differences in estimated explosion epoch
and distance (see Tab. 1 for new estimates).
By analogy with SN 1987A, we can deduce that
no more than 50 of the luminosity was lost in unobserved
bands. Consequently we may conclude that a common feature of these
events is ejection of a very low 56Ni mass.
As mentioned above, SN 1999eu is noticeably different from either
SN 1997D or SN 2001dc in that it exhibits a particularly large
post–plateau decline of about 5 magnitudes.
The large decline refers to the entire duration of the observations prior
to the disappearance of SN 1999eu behind the sun.
It’s remarkable that a similar behaviour was already observed in SN 1994W
[Sollerman et al., 1998].
Moreover, its luminosity
drops to a level which is about 3 times lower than would be expected
from a simple backward extrapolation of the later 56Co
radioactively–driven tail.
Two possible explanations present
themselves. One is the early condensation of dust in the ejecta,
causing much of the luminosity to be shifted into the unobserved mid–
and far–infrared. Then as the ejecta expanded, the dust became
optically transparent to the optical luminosity and so the light curve
increasingly followed the radioactive decline rate, with a luminosity
corresponding to 0.003 M⊙ of 56Ni. A similar phenomenon
was seen in SN 1987A but at a later epoch. Difficulties with the dust
hypothesis are: (a) the rather early epoch of the condensation, while
the temperature is still rather high in at least some of the ejecta;
(b) its rather “convenient” coincidence with the decline at the
end of the plateau. Unfortunately, nebular spectra of SN 1999eu are
not available and so we cannot check for the occurrence of a red–wing
truncation that dust condensation might be expected to produce
(cf. SN 1987A and SN 1999em). The second possibility is that the
late–time tail is, in fact, powered mostly by ejecta–CSM interaction
and not by radioactive decay. This would imply an extremely low
ejected mass of 56Ni (0.001 M⊙). A possible
difficulty is that if the light curve is being mostly driven by such
an interaction, then there is no obvious reason why it should be close to
the decay rate of 56Co between 350 and 550 days.
In summary, the group of five CC–SNe considered here are similar to
more typical CC–SNe in that a clear plateau phase occurs lasting for
100 days, followed by a late–time decline driven by the decay of
56Co. A similar temperature behaviour is seen
(Fig. 21), and the identities of the spectral lines at
all phases are also typical. However, these SNe differ in that (a)
during the plateau phase the luminosity is at least a factor
10 times less than found in typical CC–SNe, (b) the expansion
velocity is unusually slow (Fig. 20), both during the
photospheric and nebular phases, and (c) the mass of 56Co which
drives the late–time tail is at least a factor 10 lower than
normal.
A key issue to address is whether or not the five low–luminosity
CC–SNe are members of a separate class of CC–SNe arising from a
distinctly different progenitor type and/or explosion process, or are
they simply samples from the extreme low–luminosity tail of a
continuous distribution of otherwise normal explosions.
We are currently investigating this problem through
the study of SNe II having luminosities intermediate between normal
objects (like SN 1988A or SN 1969L) and the faint events discussed
here. Hamuy [Hamuy, 2003] has already considered 24
type II plateau SNe, deriving a wide range of plateau luminosities
(5 magnitudes), expansion velocities (5) and ejected
56Ni masses (150). His sample includes two of our
low–luminosity events viz. SNe 1999br and 1997D. He found that both
the mid–plateau MV and ejecta velocity correlate with the mass of
56Ni ejected as deduced from the exponential tail. For a subset
of 16 SNe II–P the explosion energy and total ejected mass
also correlate with the observed properties of plateau luminosity and
velocity. Hamuy asserts that the physical properties of SNe II–P
exhibit a continuous range of values, and concludes that SNe II–P
form a one–parameter family. We note that the four low–luminosity
SNe for which we have a fair estimate of MV follow the trend of
MV at 50 days versus M(Ni56) shown in Hamuy’s Fig. 3. It
therefore seems reasonable to incline towards the single continuous
distribution scenario. Given Hamuy’s correlation between ejecta
kinetic energy and mass of 56Ni ejected, this implies that
low–luminosity CC–SNe are also low–energy events.
Similar results for a large sample of SNe II–P support Hamuy’s conclusion
that a continuous trend of physical parameters in SNe II–P exists,
also including extremely low and moderately
low luminosity events (Zampieri et al., in prep.).
To account for the low–luminosity CC–SNe, a natural approach is to
examine the extreme ends of the mass spectrum of progenitors from
which SNe II–P are believed to arise. The high–mass scenario has been
proposed by Turatto et al. (1998), Benetti et al. (2001) and
Zampieri et al. (2003). Turatto et al. (1998) found that the observed
behaviour of SN 1997D could be reproduced by the explosion of a
progenitor with , radius and
explosion energy erg. They also suggested
that the central remnant was a black hole (BH) and that significant
fallback of stellar material onto the collapsed remnant may have taken
place. Zampieri et al. [Zampieri et al., 2003] studied the behaviour of
both SN 1997D and SN 1999br. They
found that the light curves and the evolution of the continuum
temperature and expansion velocity are well reproduced by a
comprehensive semi–analytical model in which the envelope is
1013 cm (140 R⊙), the ejecta masses are 14–20
M⊙ and explosion energy is erg. They deduced
somewhat lower progenitor masses than did by Turatto et al., estimating
a progenitor with mass 19 M⊙ for SN 1997D
and 16 M⊙ for SN 1999br.
From the large ejected masses and low explosion energy, Zampieri et al.
conclude that SN 1997D and SN 1999br are intermediate mass, BH–forming CC–SNe.
A contrary conclusion was reached by Chugai Utrobin (2000). In
their analysis of the early– and late–time spectra of SN 1997D, they
found that model spectra for a supernova resulting from a 24 M⊙
progenitor were incompatible with the observed nebular spectra. They
considered also a low–mass progenitor model in which the observed
behaviour of SN 1997D is reproduced by the low energy explosion
( erg) of a low–metallicity progenitor. The star
has a radius R 85 R⊙ and a total main sequence mass of
M = 8–12 M⊙ (of which 6 M⊙ becomes H rich ejecta).
In this case, the remnant is expected to be a neutron star. They found
that this model gave more successful reproduction of the spectra at
both early and late times.
However, in their analysis Chugai Utrobin assumed a plateau duration of
60 days. The new observational evidence provided here and
in Zampieri et al. (2003) indicates that the plateau of low–luminosity SNe
is 100 days. Therefore, it is not clear if the low mass model may
still be able to reproduce the observations with such a long plateau duration.
Incidentally, Cappellaro (in prep.) find that roughly 50 of low–luminosity SNe II–P occur in late type (Sc) galaxies where recent star formation has occurred, whereas the fraction for normal SNe II is only 15 . This favours a high–mass progenitor for the low–luminosity events.
Ultimately, it may be possible to devise new observational tests for the high–mass scenarios. Woosley & Weaver (1995) have shown, for a low energy explosion occurring in a massive progenitor, a considerable fraction of 56Ni and other heavy elements may indeed remain gravitationally bound to the compact core and fall back onto it. If the fallback is too large it can lead to problems in reproducing the observed Barium and other -process elements (Qian & Wasserburg, 2001). However, hydrodynamic calculations show that 1 of stellar material can easily remain bound and accrete onto the core, forming a BH. In principle one might detect such a BH via the late–time light curve when accretion luminosity induced by the fallback overcomes the radioactive decay luminosity (Zampieri, Shapiro & Colpi, 1998). For spherical symmetry, the accretion luminosity is predicted to decay as [Zampieri et al., 1998b], but it is also not expected to dominate the radioactive luminosity until 3 years post–explosion (Balberg et al., 2000). Consequently this effect is currently at the sensitivity limit of the largest ground–based telescopes.
8 Are low–luminosity SNe rare?
A significant fraction of all types of SNe may be underluminous, but their faintness may produce a statistical bias against the discovery of such events [Schaefer, 1996]. Richardson et al. [Richardson et al., 2002] found that for SNe in our Galaxy and in nearby galaxies ( 30), possibly more than 20 have an intrinsic MB fainter than –15. The majority of these events are of type II–P (both 1997D–like and 1987A–like events). Chugai Utrobin (2000) speculate that the Galactic supernovae of 1054 and 1181 might have been sub–luminous events similar to SN 1997D. They estimate that such faint SNe make up 20 of all SNe II–P.
The analysis of archival data and published material suggests that several other 1997D–like events have been observed in the past. For example, SN 1973R (Ciatti Rosino, 1977) exhibited low plateau luminosity, relatively narrow P–Cygni lines and a light and colour curve behaviour similar to that of SN 1997D, suggesting that it belongs to this group of sub–luminous SNe. Other candidates might be SN 1923A [Patat et al., 1994], SN 1978A [Elliott et al., 1978], SN 1999gn (VSNET data; Dimai Li, 1999; Ayani Yamaoka, 1999), SN 2000em [Strolger et al., 2000], SN 2001R (Weisz et al., 2001; Matheson et al., 2001) and the recent SN 2003Z (Qiu Hu, 2003; Matheson et al. 2003). We note, in particular, that the spectrum of SN 2000em444http://www.ctio.noao.edu/∼ngss/ngss4/ngss4.html taken by the NGSS Team shows many features that are reminiscent of those observed in SN 1997D. The H emission dominates with respect to the Ba II 6497 A line, thus resembling e.g. spectra (8) and (9) in Fig. 19.
SN 1978A [Elliott et al., 1978] exhibited narrow P–Cygni spectral features
resembling those of SN 1997D. A complex sequence of narrow absorption
and emission lines are visible in a rather noisy spectrum
(resolution 10 A).
SN 1978A is also peculiar in that while its late–time luminosity was
similar to that of 1997D–like events, at discovery its absolute
magnitude was much higher: –18.6 [Gilmore [Gilmore, 1978];
Zealey Tritton [Zealey & Tritton, 1978]].
A possible explanation could be an early
interaction with a thin circumstellar shell ejected just before the SN
explosion, powering the luminosity at very early phases. However, in
this scenario it is difficult to explain the observed low expansion
velocities at just 2–3 weeks post–explosion. SN 1994W [Sollerman et al., 1998]
is also a case where the luminosity at maximum was high, but where a
low (M 0.015 M⊙) or very low (M 0.0026 M⊙)
mass of radioactive 56Ni was
ejected, depending on the contribution to the luminosity of an
ejecta–CSM interaction.
The discovery in the past few years of a few SNe spectroscopically classified as 1997D–like events, suggests that the rate of such events is significant. Among type II SNe discovered during 1992–2001 in a volume–limited sample (recession velocities 4000 km s-1) [Barbon et al., 1999, and recent updates], at least 5 are spectroscopically similar to SN 1997D. This suggests that the incidence of such very low–luminosity events is about 4–5 of all type II SNe.
9 CONCLUSIONS
In this paper we have presented photometric and spectroscopic observations of 4 new SNe II, viz. SNe 1999br, 1999eu, 1994N and 2001dc. Together with SN 1997D, we have shown that they form a group of exceptionally low–luminosity events. The discovery of these faint SNe is difficult and their monitoring requires in general large telescopes and long integration times. Partly in consequence of this, the temporal coverage of individual supernovae was erratic and incomplete. However, taken together, they suggest a fairly homogeneous set of properties, and provide a reasonably complete picture of the photometric and spectroscopic evolution of this type of supernova. Establishment of the phase of these events was important, and the best–observed SN 1999br was particularly valuable in this regard (see also Zampieri et al., 2003).
We find that the group of five CC–SNe considered here are similar to more typical CC–SNe in that a clear plateau phase occurs lasting for 100 days, followed by a late–time decline driven by the decay of 56Co. A similar temperature behaviour is also seen. The spectrum evolves from a relatively normal SN II photospheric spectrum to one characterized by narrow lines (v 1000 km s-1), a red continuum and strong Ba II lines. These SNe are unusual in that during the plateau phase the luminosity (both V–band and bolometric) is at least a factor 10 times less than found in typical CC–SNe. In addition, the expansion velocity is unusually slow both during the photospheric and nebular phases. At the earliest epochs, the photosphere is located at layers expanding at 5000 km s-1, but within two months it recedes to v 1000 km s-1. The mass of 56Co which drives the late-time tail is at least a factor 10 lower than normal, indicating ejected masses of 56Ni in the range 2–8 10-3 M⊙.
Comparison with a sequence of more normal SNe II (Hamuy, 2003; Zampieri et al., in preparation) suggests that this group of SNe represent the extreme low–luminosity tail of a single continuous distribution. This indicates that the low–luminosity CC–SNe are also low–energy events. Although evidence for a low–mass progenitor of low–luminosity CC–SNe may not be completely ruled out yet, recent work seems to support a high mass progenitor scenario (Zampieri et al., 2003).
Finally, we note that selection effects probably limit the rate of discovery of low–luminosity SNe, and that their true incidence may be as high as 4–5 of all type II SNe.
Acknowledgments
We acknowledge support from the MIUR grant Cofin 2001021149,
and partial support from NSG grants AST–9986965 and AST–0204771, and
NASA grant NAG5–12127.
We are grateful to M. Hamuy & M. M. Phillips for providing their data
for SN 1999br before publication and to the referee D. C. Leonard for helpful
comments which have improved the paper.
We thank D. Bramich, L. Contri, R. Corradi, S. Desidera, P. Erwin,
B. Garcia, E. Giro, D. Lennon, L. Lessio, N. O’Mahoney, J. Rey and
A. Zurita for technical support and assistance in the observations of
SN 2001dc.
A. P. thanks the University of Oklahoma for generous hospitality.
We are grateful to the VSNET observers, in particular for the useful
information about SN 1999eu.
This research has made use of the LEDA database
and of the NASA/IPAC Extragalactic
Database (NED) which is operated by the Jet Propulsion Laboratory,
California Institute of Technology, under contract with the National
Aeronautics and Space Administration.
References
- [Arnett, 1980] Arnett, W. D., ApJ, 1980, 237, 541
- [Arnett, 1987] Arnett, W. D., ApJ, 1987, 319, 136
- [Arp, 1966] Arp, H., 1966, ApJS, 14, 1
- [Ayani & Yamaoka, 1999] Ayani, K., Yamaoka, H., 1999, IAU Circ, 7336
- [Balberg et al., 2000] Balberg, S., Zampieri, L., Shapiro, S. L., 2000, ApJ, 541, 860
- [Baldwin & Stone, 1984] Baldwin, J. A., Stone, R. P. S., 1984, MNRAS, 206, 241
- [Barbon et al., 1995] Barbon, R., Benetti, S., Cappellaro, E., Patat, F., Turatto, M., Iijima, T., 1995, A&AS, 110, 513
- [Barbon et al., 1999] Barbon, R., Buondí, V., Cappellaro, E., Turatto, M., 1999, A&AS, 139, 531
- [Baron et al., 2000] Baron, E. et al., 2000, ApJ, 545, 444
- [Benetti et al., 1991] Benetti, S., Cappellaro, E., Turatto, M., 1991, A&A, 247, 410
- [Benetti et al., 2001] Benetti, S. et al., 2001, MNRAS, 322, 361
- [Blanton et al., 1995] Blanton, E. L., Schmidt, B. P., Kirshner, R. P., Ford, C. H., Chromey, F. R., Herbst, W., 1995, AJ, 110, 2868
- [Boles et al., 2003] Boles, T., Beutler, B., Li, W., Qiu, Y. L., Hu, J, Y., IAU Circ. 8062
- [Bottinelli et al., 1985] Bottinelli, L., Gouguenheim, L., Paturel, G., de Vaucouleurs, G., 1985, A&AS, 59, 43
- [Bottinelli et al., 1990] Bottinelli, L., Gouguenheim, L., Fouque, P., Paturel, G., 1990, A&AS, 82, 391
- [Cappellaro, 2003] Cappellaro, E., 2003, in preparation
- [Catchpole et al., 1987] Catchpole, R. M. et al., 1987, MNRAS, 229, P15
- [Catchpole et al., 1988] Catchpole, R. M. et al, 1988, MNRAS, 231, P75
- [Catchpole et al., 1989] Catchpole, R. M. et al., 1989, MNRAS, 237, P55
- [Chugai & Utrobin, 2000] Chugai, N. N., Utrobin, V. P., 2000, A&A, 354, 122
- [Clocchiatti et al., 2001] Clocchiatti, A., Phillips, M. M., Spyromilio, J., Leibundgut, B., 2001, in N. B. Suntzeff, M. M. Phillips eds., SN 1987A: Ten Years After, Astron. Soc. Pac., San Francisco
- [Ciatti & Rosino, 1977] Ciatti, F., Rosino, L., 1977, A&A, 56, 59
- [de Mello & Benetti, 1997] de Mello, D., Benetti, S., 1997, IAU Circ., 6537
- [Dimai & Li, 1999] Dimai, A., Li, W., 1999, IAU Circ., 7335
- [Ekholm et al., 2000] Ekholm, T., Lanoix, P., Teerikorpi, P., Fouquè, P., Paturel, G., 2000, A&A 355, 835.
- [Elliott et al., 1978] Elliott, K. H., Blades, J. C., Zealey, W. J., Tritton, S., 1978, Nature, 275, 198
- [Elmhamdi et al., 2003] Elmhamdi, A. et al., 2003, MNRAS, 338, 939
- [Evans & Quirk, 2003] Evans, R., Quirk., S., 2003, IAU Circ., 8042
- [Filippenko et al., 1999] Filippenko, A. V., Stern, D., Reuland, M., 1999, IAU Circ., 7043
- [Fisher, 2000] Fisher, A., 2000, Ph.D. Thesis, Univ. of Oklahoma
- [Fouquè et al. 2000] Fouquè, P., Solanes, J. P., Sanchis, T., Balkowski, C., 2000, A&A, 375, 770
- [Freedman et al., 2001] Freedman, W. L. et al., 2001, ApJ, 553, 47
- [Garcia, 1993] Garcia, A., M., 1993, A&AS, 100, 47
- [Garnavich et al., 1999a] Garnavich, P. et al., 1999, IAU Circ., 7143
- [Garnavich et al., 1999b] Garnavich, P., Jha, S., Kirshner, R., Challis, P., Schmidt, B., 1999, IAU Circ., 7304
- [Gilmore, 1978] Gilmore, G., 1978, IAU Circ. 3221
- [Giovanelli et al., 1997] Giovanelli, R., Haynes, M. P., Herter, T., Vogt, N. P., Wegner, G., Salzer, J. J., da Costa, L. N., Freudling, W., 1997, AJ, 113, 22
- [Giuricin et al., 2000] Giuricin,G., Marinoni,C., Ceriani,L., Pisani,A., 2000, ApJ, 543, 178
- [Hamuy et al., 1992] Hamuy, M., Walker, A. R., Suntzeff, N. B., Gigoux, P., Heathcote, S. R., Phillips, M. M., 1992, PASP, 104, 533
- [Hamuy et al., 1994] Hamuy, M., Suntzeff, N. B., Heathcote, S. R., Walker, A. R., Gigoux, P., Phillips, M. M., 1994, PASP, 106, 566
- [Hamuy et al., 2001] Hamuy, M. et al., 2001, ApJ, 553, 886
- [Hamuy, 2003] Hamuy, M., 2003, ApJ, 582, 905
- [Hamuy et al., 2003b] Hamuy, M. et al., 2003b, in preparation
- [Höflich et al., 1999] Höflich, P., Wheeler J. C., Wang L., 1999, ApJ, 521, 179
- [Hurst et al., 2001] Hurst, G. M. et al., 2001, IAU Circ. 7662
- [Iwamoto et al., 1998] Iwamoto, K, Mazzali, P. A., Nomoto, K. et al., 1998, Nature, 295, 672
- [Jeffery & Branch, 1990] Jeffery, D. J., Branch, D., 1990, in Jerusalem Winter School for Theoretical Physics, Vol. 6, Supernovae, ed. J. C. Wheeler, T. Piran & S. Weinberg (Singapore: World Scientific), 90
- [King, 1999] King, J. Y., 1999, IAU Circ., 7141
- [Kraan-korteweg, 1986] Kraan–Korteweg, R.C., 1986, A&AS, 66, 255
- [Landolt, 1992] Landolt, A. U., 1992, AJ, 104, 340
- [Leonard et al., 2002a] Leonard, D. C. et al., 2002, PASP, 114, 35
- [Leonard et al., 2002b] Leonard, D. C. et al., 2002, AJ, 124, 2490
- [Leonard et al., 2003] Leonard, D. C., Kanbur, S. M., Ngeow C. C., Tanvir, N. R., 2003, ApJ, 594, 247
- [Matheson et al., 2001] Matheson, T., Jha, S., Challis, P., Kirshner, R., Calkins, M., 2001, IAU Circ., 7583
- [Matheson et al., 2003] Matheson, T., Challis, P., Kirshner, R., Calkins, M., 2003, IAU Circ., 8063
- [Mattila & Meikle, 2001] Mattila, S., Meikle, W.P.S., 2001, MNRAS, 324, 325.
- [Menzies et al., 1987] Menzies, J. W. et al., 1987, MNRAS, 227, 39
- [Mueller et al., 1993] Mueller, J., Brewer, C., Cappellaro, E., della Valle, M., 1993, IAU Circ. 5784
- [Nakano & Aoki, 1999] Nakano, S., Aoki, M., 1999, IAU Circ., 7304
- [Patat et al., 1994] Patat, F., Barbon, R., Cappellaro, E., Turatto, M., 1994, A&A, 282, 731
- [Patat et al., 1999] Patat, F., Benetti, S., Cappellaro, E., Rizzi, L., Turatto, M., 1999, IAU Circ., 7183
- [Patat et al., 2001] Patat et al., 2001, ApJ, 555, 900
- [Pooley et al., 2001] Pooley, D. et al., 2002, ApJ, 572, 932
- [Popov, 1992] Popov, D. V., 1992, SvAL, 18, 59
- [Qian et al., 2002] Qian, Y.-Z., Wasserburg, G. J., 2002, ApJ, 123, 678
- [Richardson et al., 2002] Richardson, D., Branch, D., Cesebeer, D., Millard, J., Thomas, R. C., Baron, E., 2002, AJ, 123, 745
- [Richmond et al., 1996] Richmond, M. W. et al., 1996, AJ, 111, 327
- [Ruiz-Lapuente et al., 1990] Ruiz-Lapuente, P., Canal, R., Kidger, M., Lopez, R., 1990, AJ, 100, 782
- [Schaefer, 1996] Schaefer, B. E., 1996, ApJ, 464, 404
- [Schlegel et al., 1998] Schlegel, D. J., Finkbeiner, D. P., Davis, M., 1998, ApJ, 500, 525
- [Schmidt et al., 1994] Schmidt, B. P. et al., 1994, AJ, 107, 1444
- [Sersic, 1973] Sersic, J. L., 1973 PASP, 85, 103
- [Smith et al., 1992] Smith, R. C., Wells, L., della Valle, M., Bouchet, P., 1992, IAU Circ., 5638
- [Sollerman et al., 1998] Sollerman, J., Cumming, R. J., Lundqvist, P., 1998, ApJ, 493, 933
- [Sollerman et al., 2000] Sollerman, J., Kozma, C., Fransson, C., Leibundgut, B., Lundqvist, P., Ryde, F., Woudt, P, 2000, ApJ, 537, 127
- [Sollerman, 2002] Sollerman, J., 2002, NewAR, 46, 493
- [Stone1977] Stone, R. P. S., 1977, ApJ, 218, 767
- [Stone & Baldwin, 1983] Stone, R. P. S., Baldwin, J. A., 1983, MNRAS, 204, 237
- [Storchi-Bergmann et al., 1997] Storchi-Bergmann, T., Eracleous, M., Ruiz, M. T., Livio, M., Wilson, A. S., Filippenko, A. V., 1997, ApJ, 489, 87
- [Strolger et al., 2000] Strolger, L.-G., Seguel, J. C., Krick, J., Block, A., Candia, P., Smith, R. C., Suntzeff, N. B., Phillips, M. M., 2000, IAU Circ., 7524
- [Szabo, 1999] Szabo, R., 1999, IAU Circ., 7193
- [Turatto et al., 1990] Turatto, M., Cappellaro, E., Barbon,R., Della Valle,M., Ortolani,S., Rosino,L., 1990, AJ 100, 771
- [Turatto et al., 1993] Turatto, M., Cappellaro, E., Benetti, S., Danziger, I. J., 1993, MNRAS, 265, 471
- [Turatto et al., 1994] Turatto, M., Gouiffes, C., Leibundgut, B., 1994, IAU Circ., 5987
- [Turatto et al., 1998] Turatto, M. et al., 1998, ApJ, 498, 129
- [Weisz et al., 2001] Weisz, D., Modjaz, M., Li, W. D., 2001, IAU Circ., 7579
- [West et al., 1987] West, R. M., Lauberts, A., Jorgensen, H. E., Schuster, H. E., 1987, AA, 177, 1
- [Whitelock et al., 1988] Whitelock, P. A. et al., 1988, MNRAS, 234, 5
- [Whitelock et al., 1989] Whitelock, P. A. et al., 1989, MNRAS, 230, 7
- [Wolstencroft et al., 1984] Wolstencroft, R. D., Tully, R. B., Perley, R. A., 1984, MNRAS, 207, 889
- [Woosley et al., 1987] Woosley, S. E., Pinto, P. A., Martin, P. G., Weaver, T. A., 1987, ApJ, 318, 664
- [Woosley & Weaver, 1995] Woosley, S. E., Weaver, T. A., 1995, ApJS, 101, 181
- [Young, Baron & Branch, 1995] Young, T. R., Baron, E., Branch, D., 1995, ApJ, 449, 51
- [Zampieri et al., 1998a] Zampieri, L, Shapiro, S. L., Colpi, M., 1998, ApJ, 502, 149
- [Zampieri et al., 1998b] Zampieri, L, Colpi, M., Shapiro, S. L., Wasserman, I., 1998b, ApJ, 505, 876
- [Zampieri et al., 2003] Zampieri, L., Pastorello, A., Turatto, M., Cappellaro, E., Benetti, S., Altavilla, G., Mazzali, P., Hamuy, M., 2003, MNRAS, 338, 711
- [Zampieri et al., 2003b] Zampieri, L. et al., 2003b, in prep.
- [Zealey & Tritton, 1978] Zealey, W., Tritton, S., 1978, IAU Circ., 3224