Detection of the evolutionary stages of variables in M3
Abstract
The large number of variables in M3 provides a unique opportunity to study an extensive sample of variables with the same apparent distance modulus. Recent, high accuracy CCD time series of the variables show that according to their mean magnitudes and light curve shapes, the variables belong to four separate groups. Comparing the properties of these groups (magnitudes and periods) with horizontal branch evolutionary models, we conclude that these samples can be unambiguously identified with different stages of the horizontal branch stellar evolution. Stars close to the zero age horizontal branch (ZAHB) show Oosterhoff I type properties, while the brightest stars have Oosterhoff II type statistics regarding their mean periods and RRab/RRc number ratios. This finding strengthens the earlier suggestion of Lee et al., (1990) connecting the Oosterhoff dichotomy to evolutionary effects, however, it is unexpected to find large samples of both of the Oosterhoff type within a single cluster, which is, moreover, the prototype of the Oosterhoff I class globular clusters. The very slight difference between the Fourier parameters of the stars (at a given period) in the three fainter samples spanning over about 0.15 mag range in points to the limitations of any empirical methods which aim to determine accurate absolute magnitudes of RR Lyrae stars solely from the Fourier parameters of the light curves.
1 Introduction
Variable stars in globular clusters are very important objects in understanding horizontal branch (HB) stellar evolution. They are of the same age, and the spread in their metallicity, if present at all, is supposed to be rather small. Their global properties are well known, but there are still significant uncertainties in tying the basic parameters of the globular clusters (distance, age and metallicity) to absolute scales. The so called “second parameter” which defines the structure of the HB besides metallicity is still a matter of debate (see e.g. Bellazzini et al.,, 2001; Catelan,, 2000; Buonanno at al.,, 1997). The systematic differences in the mean periods of RRab stars and in the percentage of the overtone variables (Oosterhoff (Oo) dichotomy) cannot be simply connected to the HB type or the metallicity of the clusters. Lee et al., (1990) suggested an evolutionary explanation of the Oo dichotomy and the Sandage period shift, arguing that evolution away from the ZAHB can explain the observed properties of Oo II clusters. Lee & Carney, 1999b draw a similar conclusion from the comparison of M2 (Oo II) and M3 (Oo I) but they found a 2 Gyr age difference between these clusters, also. The comparison the HB luminosities of different clusters, which is crucial both in the explanation of the Oo dichotomy and the period shift, bears, however, significant uncertainties. Thus, studying stars of different evolutionary stages in a single cluster may have crucial impact on these studies.
M3 is one of the most prominent globular clusters with a very extensive population of RR Lyrae stars (both of RRab and RRc) making the cluster an ideal target for the investigation of the HB within the instability strip. The properties of RR Lyrae stars classify M3 as an Oo I type cluster with a larger population of RRab stars than the overtones, and with a 0.561 d mean period of the RRab stars (Corwin & Carney,, 2001, hereafter CC01). The majority of the RR Lyrae stars have mean magnitudes within a mag range. The accuracy of photometric data indicates that the spread is intrinsic and may be understood in terms of HB evolution. Kaluzny et al., (1998) mentioned that the three brightest RRab stars might already be in an evolved phase of their HB evolution. Clement & Shelton, (1999) have drawn attention that these stars fit the period - amplitude (P-A) relation of Oo II clusters. This led them also to conclude that the Oo dichotomy is due to evolution and the previously assumed period-amplitude-metallicity relation was just an artifact of different selection effects. Based on their magnitudes and positions on the P-A plot, CC01 separated a group of RRab stars in M3 being probably already in the late stage of the HB evolution.
In this Letter we present details on the fine structure of the HB of M3 inside the instability strip which strengthen the results of CC01 and Clement & Shelton, (1999). The properties of the variables are explained in the context of the HB stellar evolution.
2 Data
Using all the available photometric V observations of M3 variables (Kaluzny et al.,, 1998; Carretta et al.,, 1998; Corwin & Carney,, 2001; Benkő et al.,, 2003, hereafter BJ03) we constructed complete, accurate light curves of about 100 RRab and 50 RRc type variables. As our aim was to investigate the differences in the shapes of the light curves, and the magnitude distribution of the variables, only those stars were used which were not affected seriously by any type of modulation (Blazhko, nonradial, double mode). Constructing the light curves by using all the available measurements can help to eliminate any defect (distortion) which might be present in any of the observations.
A comparison of the light curves from different observations and reduction processes (Jurcsik,, 2003) showed that the light curves of the inner variables in CC01 have considerably larger scatter and much less reliable mean magnitudes than the BJ03 data. For the outer variables, the scatter in the V light curves of CC01 is a bit larger than in the BJ03 and Kaluzny et al., (1998) data. Consequently, we rely on the correctness of the BJ03 data and to reach the most accurate light curve shapes we do not simply merge the different data, but if necessary, magnitude offsets of the order of 0.01 mag to the different measurements are added to match the data of the individual variables to the BJ03 light curves. The error of the intensity mean magnitudes of the variables used in the this work is typically less than 0.02 mag in BJ03, thus this is the typical accuracy of the data the present study is based on.
The accuracy of the mean magnitudes makes it possible to map the light curve shapes and periods (Fourier parameters) in the two dimensional period - magnitude plane. Assuming homogeneous composition, this plane is analogous to the color-magnitude diagram, as variables with the same magnitudes have nearly equal masses within the instability strip, thus differences in their periods are only due to their different temperatures (colors).
3 Results
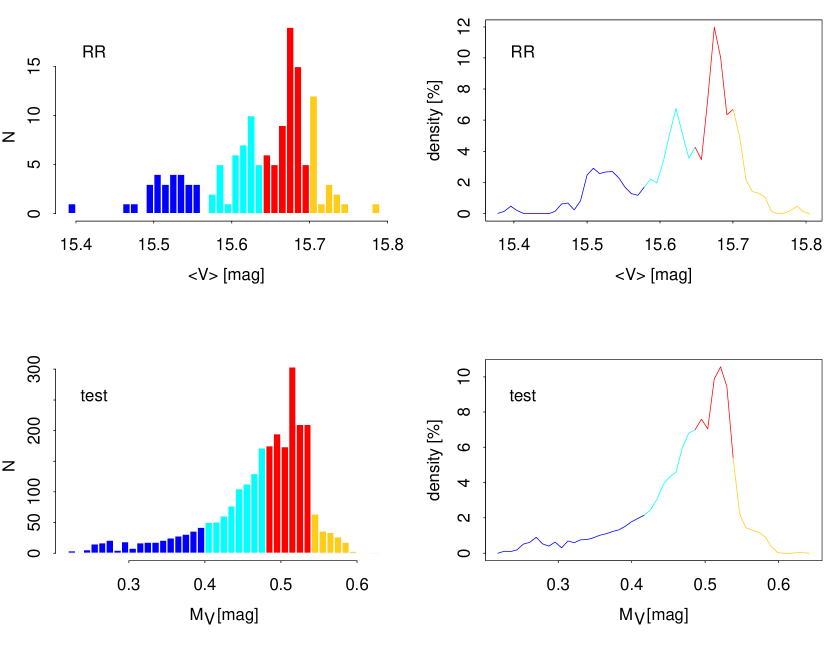
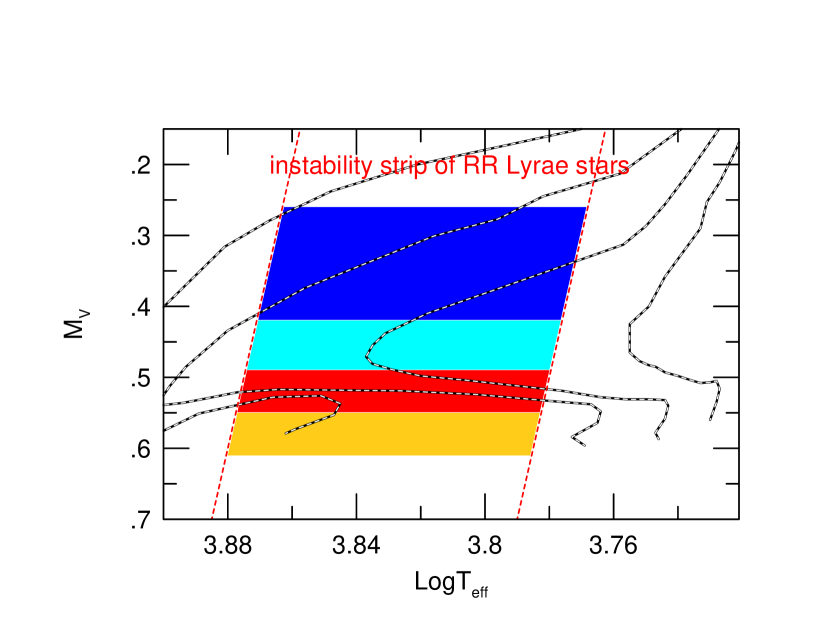
Both the RRab and the RRc stars show a relatively wide magnitude distribution with two central peaks at around 15.67 and 15.63 mag, a flat wide range of brighter stars and a faint tail going down to 15.75 mag. The magnitude distribution of the RR Lyrae stars are shown in the top panels of Fig. 1. A comparison with HB synthesis results using the evolutionary models of Dorman, (1992) are shown in the bottom panel of Fig. 1. Uniform mass and age distributions of the HB stars in the 0.70 and and Myear intervals are assumed, and the instability strip of RR Lyrae stars are defined as shown in Fig. 4. Synthetic HB simulations gave and mean mass and mass dispersion values in M3 (Catelan et al.,, 2001). However, as different models have different mass distributions on the HB, when using Dorman, (1992) models to synthetize the HB population of M3, other values of the mean mass and mass dispersion may be obtained. Therefore, we tested the synthetic magnitude distribution within the instability strip using mean mass and mass dispersion values within the and ranges. These simulations led to similar results as for uniform mass distribution, with a bit more narrow density peak when smaller mass and mass dispersion values were assumed.
The observed magnitude distributions of RR Lyrae stars and synthetic HB results are in good agreement, taking into account the uncertainties of both the observations and the models. This global agreement helps in identifying the different magnitude groups of RR Lyrae stars with different stages of the HB evolution.
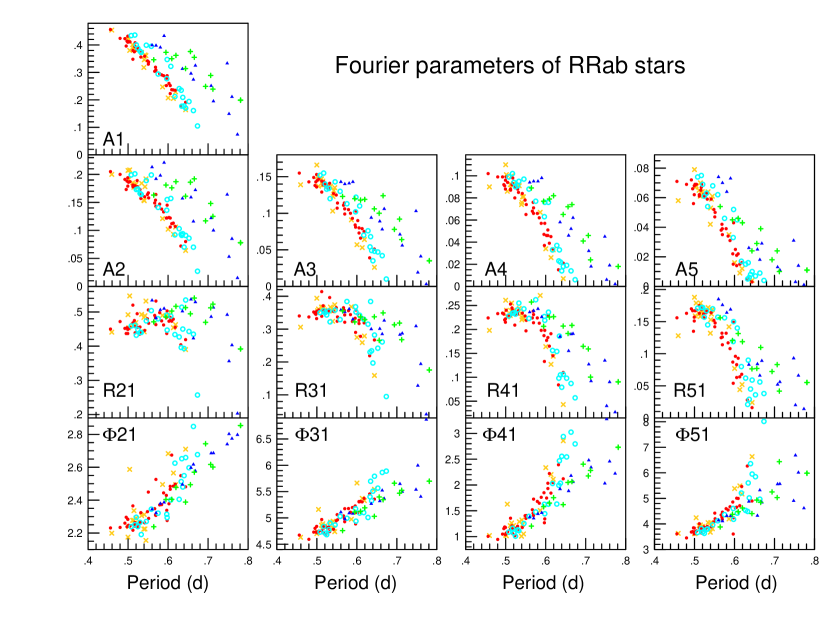
As there is no clear cut between the magnitudes of the different magnitude groups identified in Fig. 1, the light curve shapes help in deciding which group a given star belongs to. In order to check the possible systematic differences between the shapes of the light curves at different mean magnitudes, we compared the progressions of their Fourier parameters as a function of their periods as shown in Fig. 2. These plots can be interpreted as changes in the light curve shapes with decreasing temperature for the four samples which have the same luminosity, composition, and there should be just a very slight () dispersion in their masses. The most dramatic differences can be seen in the Fourier parameters of the brightest sample, but the other brighter group is also slightly shifted, especially in the higher Fourier components from the fainter stars. The two faint samples seem to follow the same tracks. The larger scatter of the Fourier parameters of the faintest sample may be due to observational inaccuracies but it cannot be excluded that it reflects intrinsic differences in the light curve shapes of these stars. The observed main tracks in Fig. 2 are very similar to the predicted behaviour of the Fourier parameters of constant luminosity, mass and composition models shown by Dorfi & Feuchtinger, (1999). This result strengthens the reality that the three brighter groups represent indeed different luminosity samples.
The period - Fourier amplitude plots shown in Fig. 2 are the analogs of the P-A diagram discussed in many papers as a diagnostic tool of the Oo type. CC01 separated a sample of 13 RRab stars in M3 which defined a long period sequence on the P-A diagram. According to their observations, 11 of these stars were brighter than the average magnitude of the RR Lyrae stars. Our measurements confirm this finding, moreover in our data all these stars belong to the brightest sample including an additional member of this group; V139.
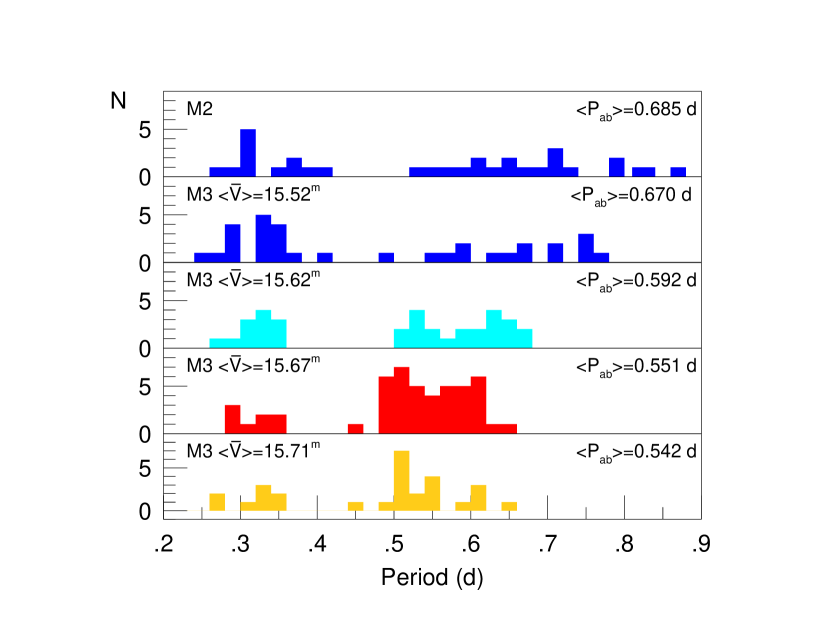
Fig. 3 shows the period distributions in the four different brightness groups, and for comparison, the period distribution in M2 as well. The period distributions of RRab stars in the four groups show definite shifts with magnitude. Both the shortest and longest periods and also the distribution of the periods in the third group are very similar to that of the two fainter groups, but are shifted by d. The mean period of the brightest stars is 0.12 d longer than in the main group.
Jurcsik, (1998) explained the Sandage period shift (an increase of the mean period of RRab stars in globular clusters with decreasing metallicity) with the inclination of the RRab instability strip. The variables in M3 also indicate an inclination of the instability strip (CC01(Fig. 9) and Bakos & Jurcsik, (2000)). The increased luminosities of the two brighter samples account for and d longer periods, respectively, according to the linear pulsation equation. To explain the observed 0.05 and 0.12 d longer periods in these samples, cooler temperatures and/or smaller masses of these stars has to be also assumed.
The period distribution of the faintest stars is the same as that of the most populous group. For the smaller sample of the RRc stars, a similar investigation of their period distribution is not possible, however, it is worth to note that all the six longest period RRc stars belong to the brightest group.
4 Conclusions
Based on the comparison of our data with HB evolutionary models, the four groups at different mean brightness can be identified with different stages of the HB stellar evolution as shown in Fig. 1 and Fig. 4. Table 1 summarizes the observed properties and the suggested evolutionary stages of the variables belonging to the four groups. The faintest sample (27) can be identified with variables close to their ZAHB positions. Most of the stars in our sample (50) are evolving blueward on the HB. Stars belonging to the 0.05 mag brighter sample (33) are at the hottest part of the blue loops, while the brightest stars (32) are in the late, redward phase of their HB evolution. It is interesting to note that among the overtone variables most of the stars belong to this group, which indicates that in M3, on the average, RRc stars are already in a later phase of their HB evolution than the RRab variables.
If we compare the mean periods of RRab stars and the percentage of the RRc variables of the ZAHB and the blueward evolving stars with that of the brightest, most evolved sample (0.55 and 0.67 d; 22 and 56%, respectively), an Oo I and an Oo II population emerge. The Fourier parameters of RRab stars in M2, a globular cluster with the same metallicity as M3, but with Oo II properties, are also shown in Fig. 2 using Lee & Carney, 1999a data. The 11 M2 variables and the 14 brightest RRab stars in M3 cover similar range in period and define the same sequences (V10 in M2 with 0.87 d period is not shown in Fig. 2). The large scatter of these tracks is most probably intrinsic, and is due to the larger range in the evolutionary status of the most evolved HB stars. The period distribution in M2, as shown in Fig. 3, is also similar to that of the brightest M3 sample in accordance with our conclusion that the brightest stars have Oo II characteristics. This is the first direct evidence of the Oo dichotomy in a single cluster with homogeneous metallicity.
The fact that the Oo dichotomy in M3 can be consistently explained alone by evolutionary effects is a strong constraint for its interpretation and favours to the hysteresis hypothesis originally proposed by van Albada & Baker, (1971). The hysteresis, namely, that mode switching from overtone to fundamental takes place at a lower temperature than in the opposite direction, may account for both the larger percentage of the overtones and the longer period of the fundamentals during the late redward phase of the HB. A similar conclusion has been already drawn by Clement & Shelton, (1999) from the comparison of the P-A diagrams of different metallicity clusters, and from the existence of 3 anomalously bright and large amplitude RRab stars in M3. Lee et al., (1990) and Lee & Carney, 1999b explained the Oo dichotomy and the period shift by HB stellar evolution but their interpretation was drawn from the comparison of the properties of different clusters with order of Gyr age differences, while the age difference between the Oo I and Oo II populations in M3 is smaller than 100 Myear.
As a summary, we succeeded in discriminating the different stages of HB stellar evolution using accurate light curves and mean magnitudes of the variables in M3. A comparison with HB evolutionary models does not reveal any significant discrepancy between observations and model predictions. This result helps in studying the “fine structure” of the HB and can be the base of a more precise distance estimate of RR Lyrae variables. However, the similarity of the light curves (Fourier parameters) of variables in a mag magnitude range imposes strong limits on the accuracy of any empirical method (e.g. Kovács & Walker,, 2001) which derives the magnitudes of the stars solely form the Fourier parameters of their light curves.
References
- Bakos & Jurcsik, (2000) Bakos, G. Á., and Jurcsik, J. 2000, in ASP Conf. Ser. Vol 203. p.255
- Bellazzini et al., (2001) Bellazzini, M., Fusi Pecci, F., Ferraro, F.R., Galleti, S., Catelan, M., and Landsman, W. B., 2001, AJ, 122, 2569
- Benkő et al., (2003) Benkő, J., Jurcsik, J. Bakos, G. et al. 2003, in preparation
- Buonanno at al., (1997) Buonanno, R., Corsi, C., Bellazzini, M., Ferraro, F.R., and Fusi Pecci, F. 1997, AJ, 113, 706
- Carretta et al., (1998) Carretta, E., Cacciari, C., Ferraro, F.R., Fusi Pecci, F., and Tessicini, G. 1998, MNRAS, 298, 1005
- Catelan, (2000) Catelan, M. 2000, ApJ, 532, 308
- Catelan et al., (2001) Catelan, M., Ferraro, F. R., and Rood, R. T. 2001, ApJ, 560, 970
- Clement & Shelton, (1999) Clement, C., and Shelton, I. 1999, ApJ, 515, L85
- Corwin & Carney, (2001) Corwin, T. M., and Carney, B. W. 2001, AJ, 122, 3183
- Dorfi & Feuchtinger, (1999) Dorfi, E. A., and Feuchtinger, M., 1999, A&A, 348, 815
- Dorman, (1992) Dorman, B. 1992, ApJS, 81, 221
- Harris, (1996) Harris, W. E. 1996, AJ, 112, 1487
- Jurcsik, (1998) Jurcsik, J. 1998, A&A, 333, 571
- Jurcsik, (2003) Jurcsik, J. 2003, to appear in ’Variable Stars in the Local Group’ IAU Coll. 193
- Kaluzny et al., (1998) Kaluzny, J., Hilditch, R. W., Clement, C., and Rucinski, S. M. 1998, MNRAS, 296, 347
- Kovács & Walker, (2001) Kovács, G., and Walker, A. 2001, A&A, 371, 579
- (17) Lee, Y-W., and Carney, B. W. 1999a, AJ, 117, 2868
- (18) Lee, Y-W., and Carney, B. W. 1999b, AJ, 118, 1373
- Lee et al., (1990) Lee, Y-W., Demarque, P., and Zinn, R. 1990, ApJ, 350, 155
- van Albada & Baker, (1971) van Albada A. R., and Baker, 1971, ApJ, 169, 311
| Mean period / Period range (d) | mag s. d. | No. of stars | HB evolutionary phase | |||
|---|---|---|---|---|---|---|
| RRab | RRc | RRab | RRc | RRab | RRc | |
| 0.685 / | 0.333 / | 18 | 12 | M2 | ||
| 0.670 / | 0.336 / | 15.533 0.034 | 15.522 0.043 | 14 | 18 | late redward evolution |
| 0.592 / | 0.323 / | 15.618 0.018 | 15.620 0.010 | 22 | 11 | bluest part of the blue loop |
| 0.551 / | 0.316 / | 15.671 0.013 | 15.677 0.008 | 41 | 9 | reddest stage and blueward evolution |
| 0.542 / | 0.319 / | 15.707 0.014 | 15.723 0.029 | 19 | 8 | ZAHB |