SN 1994W: evidence of explosive mass ejection a few years before explosion
Abstract
We present and analyse spectra of the Type IIn supernova 1994W obtained between 18 and 202 days after explosion. During the first 100 days the line profiles are composed of three major components: (i) narrow P Cygni lines with absorption minima at km s-1; (ii) broad emission lines with blue velocity at zero intensity km s-1; (iii) broad, smooth, extended wings most apparent in H. These components are identified with the expanding circumstellar (CS) envelope (Sollerman, Cumming & Lundqvist 1998), shocked cool gas in the forward postshock region, and multiple Thomson scattering in the CS envelope, respectively. The absence of broad P Cygni lines from the supernova (SN) is the result of the formation of an optically thick, cool, dense shell at the interface of the ejecta and the CS envelope. Models of the SN deceleration and Thomson scattering wings are used to recover the Thomson optical depth of the CS envelope, during first month, its density ( cm-3) and radial extent, cm. The plateau-like SN light curve, which we reproduce by a hydrodynamical model, is powered by a combination of internal energy leakage after the explosion of an extended presupernova ( cm) and subsequent luminosity from circumstellar interaction. We recover the pre-explosion kinematics of the CS envelope and find it to be close to homologous expansion with outmost velocity km s-1 and a kinematic age of yr. The high mass () and kinetic energy ( erg) of the CS envelope combined with small age strongly suggest that the CS envelope was explosively ejected only a few years before the SN explosion.

1 Introduction
Type IIn supernovae are believed to arise from massive stars exploding into a dense circumstellar environment. Often highly luminous, they offer us an intriguing new window on the final stages of the progenitor’s evolution.
SN 1994W, discovered on 1994 July 29 in NGC 4041, was a luminous Type IIn supernova whose light curve dropped dramatically at 110 days. The low luminosity after this point has been used to derive a very low mass of nickel in the ejecta (0.003 M⊙; SCL98 ). In a forthcoming paper C03 , we present and analyse all the SN 1994W spectra and model the circumstellar interaction.
2 Observations
The spectra were taken between 1994 July and 1995 February using BFOSC on the BAO 1.5-m telescope, the IDS on the Isaac Newton Telescope, ISIS on the William Herschel Telescope (La Palma), the Kast spectrograph at Lick Observatory’s Shane 3-m reflector, and the LDS at the Nordic Optical Telescope on La Palma.
3 Spectral evolution
No broad ejecta absorption lines are seen (Figure 1). Together with high luminosity at maximum, this suggests an extended progenitor interacting with a circumstellar (CS) envelope, and the presence of a cool dense shell (CDS), which should form in SN II with extended envelopes FA77 ; G71 .
The spectra show persistent narrow P Cygni lines of H i with broad bases (Figure 2). Triangular profiles with km s-1 are seen in He i and Mg ii. Black body fits to the continuum show that the temperature declines from 15000 K on day 31 to 7200 K on day 89. From day 121 onward, only narrow emission lines are clearly seen.


We see broad lines with maximum velocity 4000 km s-1, which we take to be the expansion velocity of the CDS. We think the broad lines come from Rayleigh-Taylor fingers from the interface of the radiative forward shock and the CS envelope (Figure 3). The persistent, narrow P Cygni lines with maximum blue velocity 1100 km s-1 indicate the maximum velocity of the circumstellar envelope, which is overrun by the ejecta at 110 days. Broad wings on H i, and nearly inverse Balmer decrement on day 31 point to a high optical depth for Thomson scattering, from which we estimate that the density in the CS envelope is as high as cm-3.
4 Light curve models confirm energetics
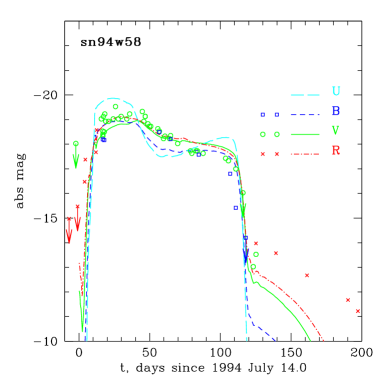
We model the broad band light curves using the multi-energy group radiation hydrodynamic code STELLA. The best fit model is for a erg explosion, 0.015 M⊙ and M⊙ ejecta, with circumstellar envelope extending out to cm (Figure 4). A similar model, with the same bulk mass but no CS envelope, fails to reproduce the bright plateau up to 110 days.
5 H profile model reveals kinematics
We have also modelled the evolution of the H line profile. The CS envelope is ionized by radiation from the forward shock, leading to line emission from recombination and collisional excitation. Our best fit is for a model with free expansion in the CS envelope and a boundary velocity of 1100 km s-1. This suggests a mass ejection 1.5 yr before explosion.
References
- (1) J. Sollerman, R. J. Cumming, P. Lundqvist: ApJ 493, 933 (1998)
- (2) N. N. Chugai, S. I. Blinnikov, R. J. Cumming, P. Lundqvist, et al.: in preparation
- (3) S. W. Falk, W. D. Arnett: ApJS 33, 515 (1977)
- (4) E. K. Grasberg, V. S. Imshennik, D. K. Nadyozhin: ApSS 10, 28 (1971)
- (5) N. N. Chugai, I. J. Danziger: Astron. Lett., in press (astro-ph/0306330)
- (6) S. E. Woosley, T. A. Weaver: ARA&A 24, 205 (1986)