Population and dynamical state of the Chamaeleontis sparse young open cluster
Abstract
We report new results in our continuing study of the unique compact (1 pc extent), nearby ( pc), young ( Myr) stellar cluster dominated by the B9 star Chamaeleontis. An optical photometric survey spanning pc adds two M5 – M5.5 weak-lined T Tauri (WTT) stars to the cluster inventory which is likely to be significantly complete for primaries with masses M⊙. The cluster now consists of 17 primaries and secondaries lying within 100 AU of their primaries. The apparent distribution of 9:7:1 single:binary:triple systems shows higher multiplicity than in the field main sequence stars, and is comparable to that seen in other pre-main sequence (PMS) populations. The initial mass function (IMF) is consistent with that of rich young clusters and field stars. By extending the cluster IMF to lower masses, we predict additional low mass stars with M⊙ and brown dwarfs with M⊙ remain to be discovered. The Cha cluster extends the established stellar density and richness relationship for young open clusters. The radial distribution of stars is consistent with an isothermal sphere, but mass segregation is present with percent of the stellar mass residing in the inner 6 arcmin (0.17 pc). Considering that the Cha cluster is sparse, diffuse and young, the cluster may be an ideal laboratory for distinguishing between mass segregation that is primordial in nature, or arising from dynamical interaction processes.
keywords:
stars: pre-main-sequence — stars: luminosity function, mass function — open clusters and associations: individual: Chamaeleontis1 Introduction
Most stars form in clustered environments, and it is now believed that a significant fraction are born in sparse groups and clusters with stars (Adams & Myers, 2001; Elmegreen, 2002). Study of the stellar and brown dwarf populations of sparse groups is therefore important for all star formation and stellar evolution issues, e.g. the nature of the IMF, issues of dynamics and dispersal of young groups into the Galactic field, binarity, and the evolution of proto-planetary discs.
Our laboratory to study such issues is the Cha star cluster — a recently-discovered sparse, young and nearby stellar group that is kinematically linked with the rich Sco-Cen (Sco OB2) Association (Mamajek, Lawson & Feigelson 1999, 2000). Owing to its proximity to the Sun, compactness in the sky, and distance from obscuring clouds, the cluster provides an excellent laboratory for study of the properties of Myr-old ‘intermediate-aged’ PMS stars.
Mamajek et al. (1999) discovered the Cha cluster from a deep ROSAT High Resolution Imager observation. X-ray, proper motion, photometric and spectroscopic study of the cluster had resulted in the discovery of 15 primaries prior to this work (see also Lawson et al. 2001, 2002). In Sections 2 and 3, we update the cluster membership with the addition of two new M5 WTT stars, and we estimate the fraction of multiple systems in the cluster. With a largely complete census for stars earlier than M6, we study the cluster IMF and its implications for the undiscovered low-mass star and brown dwarf population (Section 4). The spatial distribution of members provides evidence for mass segregation which has hithertofore been noted only in much richer clusters (Section 5).
2 Observations and Data Reduction
2.1 Photometric selection of candidate members
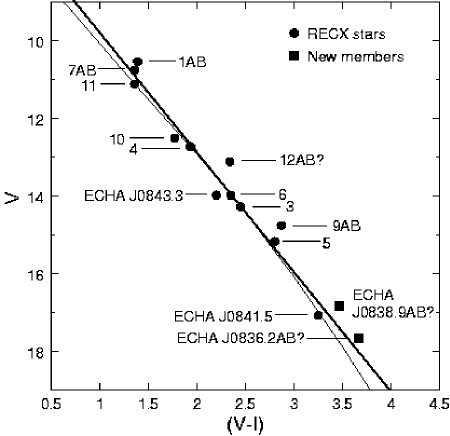
Optical colour-magnitude diagrams are a powerful tool aiding the discovery and characterisation of PMS stellar populations (Walter et al., 2000; Lawson et al., 2001). For nearby compact, coeval and codistant groups, PMS populations form a natural isochrone in the colour-magnitude diagram that is elevated in brightness above the location of a majority of field stars owing to a combination of stellar youth, proximity and, for PMS populations now distant from their parent molecular cloud, the absence of significant interstellar reddening. For PMS groups discovered via others means, e.g. X-ray study or objective prism surveys, optical photometric study also permits an independent evaluation of completeness within the survey field. For example, Lawson et al. (2002) used the () versus colour-magnitude diagram to locate X-ray faint PMS stars in the Cha cluster that had similar photometric properties to the X-ray selected RECX stars (Mamajek et al., 1999). In a limited area search of arcmin2 mostly near known members, two new cluster members were discovered including ECHA J0843.3–7905, a rare example of a classical T Tauri (CTT) star in an older PMS cluster or association.
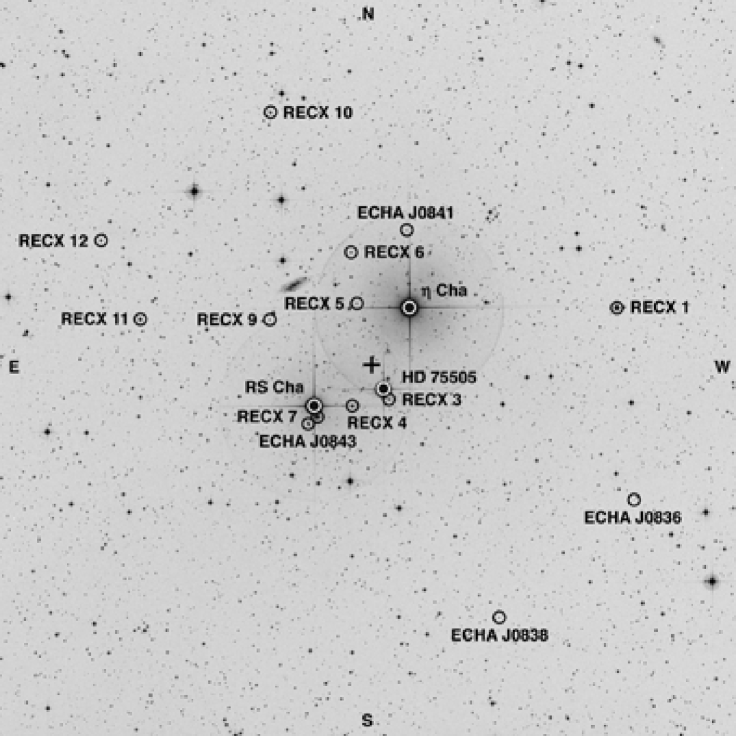
In this paper we report the results of a photometric search of the sky surrounding the Cha cluster, unbiased with respect to location, spanning arcmin ( arcmin2, or pc at pc) and centred on , (2000) = 8h 42m 06s, d 01m 38s; the spatial centre of the three early-type systems in the cluster (Mamajek et al., 2000). The extent of the survey field is shown in Figure 1, where cluster members are identified.
We used the 1-m telescope and 1k 1k SITe charge-coupled device (CCD) at the Sutherland site of the South African Astronomical Observatory (SAAO) in 2002 January to map the field in the Cousins and bands. The data were obtained under photometric conditions in arcsec seeing, with the raw aperture-extracted observations of stars in each CCD field then transformed to the standard system using observations of southern photometric standard stars and extinction values measured for the Sutherland site. Exposure times in the and bands of 90 s and 30 s, respectively, permitted detection (for Myr-old PMS stars located at pc) of stars of spectral type M6 with and () at a photometric precision better than 3 percent. Following Lawson et al. (2002), we investigated stars with properties approximate to known members, choosing objects with magnitudes in the range of mag of the sequence of RECX stars in the () versus colour-magnitude diagram. This criterion is intended to account for the possibility of a greater spread of ages within the cluster than is apparent in the RECX stars, highly reddened stars or binary stars with elevated magnitudes, and the likelihood of non-linearities in the colour-magnitude relationship for the cluster (Lawson & Feigelson, 2001). With the exception of the three bright early-type stars and the two brightest K-type members which saturated the CCD, the late-type clusters members were recovered in the survey along with several of the photometrically-similar non-members discussed by Lawson et al. (2002). Figure 2 shows the photometric sequence for known and candidate late-type members of the cluster. The bold line in this diagram is the extrapolated linear sequence of the RECX stars (Lawson et al., 2001). This line likely represents a first-order approximation of the real shape of the cluster isochrone in the () versus colour-magnitude plane, but has proven useful for identifying candidate cluster members. Other details of this diagram are discussed below.
The survey resulted in the identification of two new candidate members, and we detail their spectroscopic characterisation in the following sections.
2.2 Spectroscopic confirmation
Medium-resolution optical spectroscopy of the two new candidates was obtained during 2002 March using the 2.3-m telescope and dual-beam spectrograph (DBS) at Mount Stromlo and Siding Spring Observatories (MSSSO). In the red beam, the 1200R (1200 line mm-1) grating gave a 2-pixel resolution of 1.1 Å with coverage from Å. Exposure times of s for these stars yielded continuum signal-to-noise (S/N) ratios of near H. The spectra were calibrated using dome-flats, bias frames and Ne-Ar arc frames, making use of standard library routines such as ccdproc within IRAF.
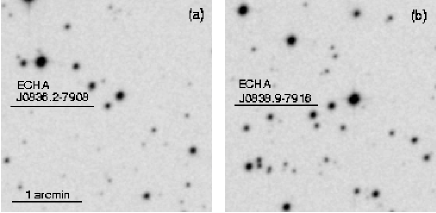
Analysis of the spectra showed that both of these stars were active, lithium-rich late-type objects. These two stars (henceforth ECHA J0838.9–7916 and ECHA J0836.2–7908, respectively) are assigned an Cha cluster designation making use of J2000 coordinates. Identification fields, derived from the Second Palomar Observatory Sky Survey (POSS-II), are shown in Figure 3. Both stars reside outside the ROSAT HRI discovery observation of Mamajek et al. (1999) and are located arcmin SW of the cluster centre.
To accurately spectral type the two new cluster members, we also obtained low-resolution 2.3-m/DBS spectra (2 Å-resolution in the blue arm, and 4 Å-resolution in the red arm) using the 300B (300 line mm-1) and 158R (158 line mm-1) gratings during 2002 March. The blue and red spectra were obtained simultaneously in a pseudo-spectrophotometric mode; with the slit width set to maximise the spectral resolution, and oriented vertically to eliminate differential refraction. The spectra were calibrated using flat-spectrum sources and flux calibrators, and when combined had continuous coverage from Å. These data were compared to spectra of M-type dwarfs from the LHS catalogue obtained with the same instrumentation; see Bessell (1990, 1991) for a list of late-M LHS stars, and Bessell (1999) for a description of the spectroscopic reduction techniques used here. Spectra obtained in this manner permit comparative spectral typing and extraction of synthetic colours, but not the measurement of fluxes.
3 Cluster membership
The stellar population of the Cha cluster has been progressively defined via several methods; X-ray detection and astrometric study (Mamajek et al., 1999, 2000) and photometric selection (Lawson et al., 2002), with subsequent spectroscopic study confirming stellar youth in late-type members. Mamajek et al. (1999) characterised twelve X-ray active stars detected using ROSAT HRI; Cha, RS Cha and ten late-type members ranging from spectral types K4 – M5, and added the X-ray quiet HD 75505 with Tycho astrometry consistent with the Hipparcos distances and proper motions of Cha and RS Cha. From optical photometric selection, Lawson et al. (2002) added two X-ray faint stars residing within the ROSAT HRI field, including the CTT star ECHA J0843.3-7905. In this paper we complete an extended photometric survey with the aim of detecting all late-type cluster primaries within arcmin of the cluster centre, and announce the discovery of two new low-mass members which likely completes the inventory of cluster primaries within this region.
3.1 New members
3.1.1 ECHA J0836.2–7908
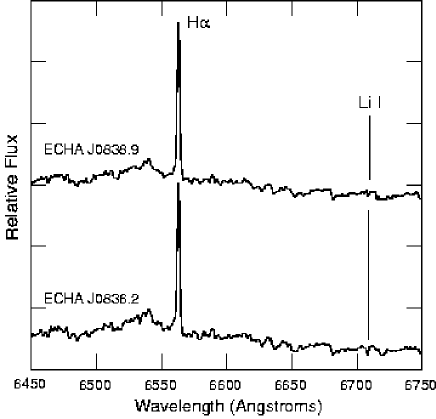
The DBS H region spectrum of ECHA J0836.2–7908 (Figure 4) shows moderate levels of H emission for a M-type PMS star (equivalent width Å) and strong Li I absorption ( Å) comparable to other Cha cluster late-type members (Mamajek et al., 1999; Lawson et al., 2002).
For ECHA J0836.2–7908 we determined a spectral type of M5.5 from the low resolution DBS spectra. The star has optical and 2MASS photometry consistent with a M5.5 spectral classification, e.g. () = 3.76 (M5.5), () = 6.71 (M5.5) and () = 2.95 (M5.5) using data presented in Table 1 and employing the spectral type-colour conversions of Bessell (1991). With and an inferred mass of M⊙ using Siess, Dufour & Forestini (2000) tracks, this star is the faintest and lowest-mass primary known in the cluster. The position of the star in the () versus colour-mag diagram (Figure 2) is suggestive of the star being binary, which we discuss in Section 3.2.1.
Multi-epoch VRI CCD photometry was obtained with the 1-m telescope at SAAO during 2002 April. 22 epochs were obtained over a 12 d interval, with exposure times of 90 s, 60 s and 30 s in the VRI bands, respectively. The reduction and analysis of the multi-epoch data followed that described by Lawson et al. (2001). Fourier analysis showed no significant periodicities were present in the light curves. The VRI data sets showed scatter at the 1- level of 0.03 mag (in ), 0.01 mag (in ) and 0.01 mag (in ); levels similar to comparably-bright field stars.
3.1.2 ECHA J0838.9–7916
H region DBS spectroscopy of ECHA J0838.9–7916 (Figure 4) shows moderate H emission ( Å) and Li I absorption ( Å) lines. Low-resolution DBS spectroscopy indicates a spectral type of M5 – M5.5, which we confirm from the measured photometric colours, e.g. () = 3.54 (M5.2), () = 6.39 (M5.2), and () = 2.85 (M5.2); see Table 1. We adopt a spectral type of M5.2 for this star. From comparison with the evolutionary tracks of Siess et al. (2000) we infer a mass of M⊙. Like ECHA J0836.2–7908, the position of ECHA J0838.9–7916 in the () versus colour-mag diagram (Figure 2) is suggestive of the star being binary; see Section 3.2.1.
Multi-epoch (21 epochs) VRI photometry obtained at SAAO during 2002 April showed no evidence for periodicity. The VRI data sets showed scatter at the 1- level of 0.01 mag in all three photometric bands; levels similar to comparably-bright field stars.
The lack of variability (see also the previous section on ECHA J0836.2–7908) is surprising when periodic behaviour due to the rotational modulation of cool starspots or accretion hotspots has been detected in all other late-type cluster members which span spectral types K5 – M4 (Lawson et al., 2001, 2002). Either the light curves of both these new M5 members are undersampled, or both stars have their rotation axes aligned pole-on, or we have detected a significant reduction in magnetic activity in these Myr-old M5 PMS stars. The photometric noise level of our observations indicates the spot coverage of both stars (strictly, the difference in coverage during the star’s rotation period) cannot exceed percent. This is a factor of lower than the light amplitudes observed in the M4 cluster members RECX 5 and ECHA J0841.5–7853.
The USNO–B1.0 catalogue lists a proper motion for ECHA J0838.9–7916 of (, ) = (, ) mas yr-1. The proper motion is consistent with the weighted mean of Tycho-2 proper motions for the brightest cluster members of (, ) = (, ) mas yr-1 (Mamajek et al., 2000).
| Li I | Spectral | ||||||||||
|---|---|---|---|---|---|---|---|---|---|---|---|
| Star | (h m s) | (d m s) | (Å) | (Å) | type | ||||||
| ECHA J0836.2–7908 | 08 36 10.6 | –79 08 18 | 17.66 | 15.94 | 13.90 | 11.85 | 11.28 | 10.95 | 0.6 | M5.5 | |
| ECHA J0838.9–7916 | 08 38 51.5 | –79 16 14 | 16.82 | 15.21 | 13.28 | 11.28 | 10.72 | 10.43 | 0.3 | M5.2 |
3.2 An improved census of the Cha cluster
With no new cluster members detected between arcmin distance from the cluster centre, and with coverage as distant as arcmin in the corners of the arcmin surveyed region (Figure 1), our X-ray, astrometric and photometric surveys has likely discovered the full extent of the cluster’s stellar primary population with spectral types earlier than M6, unless other stars have been distantly removed by evaporation or dynamical ejection.
Table 2 lists the known stellar primaries associated with the cluster. A number of these stars are in known or suspected (indicated by the ‘?’ in the column of companion masses in Table 2) multiple systems. Other than for RS Cha AB which has accurate physical masses, we infer the mass of the primary stars from comparison with the PMS evolutionary tracks of Siess et al. (2000). The presence of companions and their masses are inferred using a range of evidence that we detail in the following sub-sections. For the late-type stars our current observations are sensitive only to low mass ratio binaries, thus the frequency of systems with higher mass ratios is unknown and therefore the level of multiplicity is likely to be higher than we discuss here (see also Section 4 for discussion of the cluster IMF).
3.2.1 ECHA J0836.2–7908 and ECHA J0838.9–7916
Compared to the location of ECHA J0841.5-7853 in the () versus colour-magnitude diagram (Figure 2) both these new cluster members appear to have elevated magnitudes for their () colour. We illustrate this point in Figure 2 by fitted a second-order polynomial to those stars (see Section 3.2.7) we believe are single or high mass ratio binaries (excluding the CTT star ECHA J0843.3-7905 with photometry affected by continuum and/or line emission). This curve probably better represents the isochrone for the low-mass members than the linear fit of Lawson et al. (2001), also shown in Figure 2. If ECHA J0841.5–7853 defines the location of the cluster isochrone for late-M spectral types, then both ECHA J0836.2–7908 and ECHA J0838.9–7916 appear over-luminous by mag and are candidate near-equal mass binary systems.
3.2.2 RECX 1 and RECX 9
Both stars are elevated by mag in the () versus colour-magnitude diagram compared to other RECX stars of similar spectral type (see Figure 2) suggesting near-equal mass binary systems. Speckle -band imaging by Köhler & Petr-Gotzens (2002) using the European Southern Observatory 3.5-m NTT found both stars have companions at separations of arcsec ( AU projected separation at pc). RECX 1AB and RECX 9AB have -band brightness ratios of and 0.5, respectively. RECX 1A is a mid-K star, indicating RECX 1B is a late-K star. RECX 9A has a spectral type of M4, indicating RECX 9B is a M5 star.
3.2.3 RECX 2 = Cha
3.2.4 RECX 7
RECX 7 is a dual-lined spectroscopic binary with a mid-K spectral type primary and a binary mass-ratio of (Lyo et al., 2003). If RECX 7A is a near-solar mass star, then RECX 7B is a M⊙ early-M star.
3.2.5 RECX 8 = RS Cha AB
RS Cha AB is a A7+A8 dual-lined eclipsing system with accurate physical masses of M⊙ and M⊙ (Andersen, 1991; Mamajek et al., 2000). RS Cha was detected in X-rays by ROSAT HRI with log erg s-1 (Mamajek et al., 2000). As for Cha, we tentatively associate the X-ray emission with a low mass ( M⊙ tertiary) companion.
3.2.6 RECX 12
RECX 12 is elevated by mag in Figure 2 compared to other cluster stars of similar spectral type, suggesting the star is a near-equal mass binary. Other evidence for binarity includes the detection of dual periodicities in the light curve of the star measured in 1999 and 2000. Lawson et al. (2001) detected 1.3 d and 8.6 d periods in a multi-epoch band study in both years. Also, Köhler & Petr-Gotzens (2002) suggested RECX 12 may be a binary, but unresolved in their -band speckle observations.
3.2.7 Other cluster members
Our observations suggest ECHA J0841.5–7853, RECX 3, HD 75505, RECX 4, RECX 5, RECX 6, ECHA J0843.3–7905, RECX 10 and RECX 11 are likely single stars, or possibly high-mass ratio binary systems.
| Star | Radius | Primaries | Companions |
|---|---|---|---|
| (arcmin) | (M⊙) | (M⊙) | |
| ECHA J0836.2–7908 | 18.02 | 0.15 | 0.15? |
| RECX 1 (EG Cha) | 15.63 | 1.00 | 0.70 |
| ECHA J0838.9–7916 | 17.18 | 0.16 | 0.16? |
| RECX 2 ( Cha) | 4.43 | 3.40 | 0.50? |
| ECHA J0841.5–7853 | 8.70 | 0.19 | — |
| RECX 3 (EH Cha) | 2.33 | 0.32 | — |
| HD 75505 | 1.61 | 1.85 | — |
| RECX 4 (EI Cha) | 2.56 | 0.49 | — |
| RECX 5 (EK Cha) | 3.96 | 0.26 | — |
| RECX 6 (EL Cha) | 7.09 | 0.35 | — |
| RECX 7 (EM Cha) | 4.35 | 1.08 | 0.50 |
| RECX 8 (RS Cha) | 4.06 | 1.86 | 1.82+0.50? |
| ECHA J0843.3–7905 | 5.04 | 0.37 | — |
| RECX 9 (EN Cha) | 6.71 | 0.20 | 0.18 |
| RECX 10 (EO Cha) | 16.52 | 0.60 | — |
| RECX 11 (EP Cha) | 14.27 | 1.04 | — |
| RECX 12 (EQ Cha) | 18.16 | 0.35 | 0.35? |
4 Mass function of the Cha cluster
The stellar initial mass function (IMF) is important for studies of star formation and stellar evolution in clusters and galaxies. Surprisingly, the IMF has been shown to be essentially uniform in space and time, suggesting that the basic process of the star formation is somewhat universal (Elmegreen, 2002). However, IMF studies are usually confined to rich clusters or widespread field populations, and have rarely been examined in a sparse cluster environment.
4.1 Comparison with rich young clusters
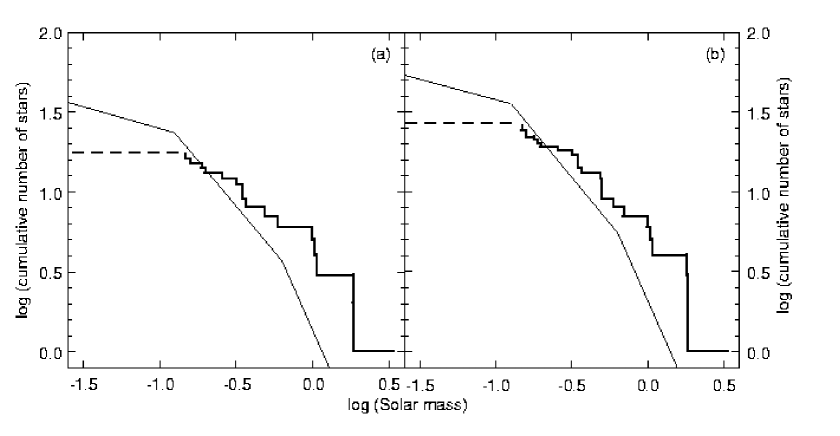
Using the membership and masses in Table 2, we compare the IMFs of the sparse Cha cluster and rich Orion Trapezium Cluster in Figure 5. For the Trapezium cluster, we adopt power-law slopes for M⊙, for M⊙, and for M⊙, where = log ( log )/ log (Muench et al., 2002).
For both the distributions of primary (Figure 5a) and member masses (Figure 5b), we scale the Trapezium IMF to the observed cumulative distributions for Cha by minimizing the Kolmogorov-Smirnov (K-S) statistic, or supremum difference between the distributions. We find the distribution of primaries/members is consistent with the Trapezium IMF at the percent confidence level according to the K-S test, although we suspect a few low mass stars may remain to be discovered in high-mass ratio multiple systems. Also, if the cluster population does significantly extend beyond the limits of the searched area, then they are likely to be low-mass members ejected by dynamical interactions. A number of recent dynamical studies (Sterzik, Durisen & Pickett, 2001; Delgado-Donate, Clarke & Bate, 2003) find small stellar groups can evolve toward evaporation and dispersal on timescales of a few Myr, with an outer halo dominated by low-mass single stars.
Extending the comparison to masses M⊙, we predict (for primaries; Figure 5a) an additional 10 stars between M⊙ and 10 brown dwarfs between M⊙. For all members (primaries and companions) the comparable numbers are 14 and 15, respectively. Thus from this calculation we expect the undiscovered low-mass population (objects with MJ) of the Cha cluster is comparable in number to the known stellar population, if this cluster follows the IMF of a rich young stellar clusters such as Trapezium.
4.2 Comparison with sparse young groups
We also consider the suggestion of Adams & Myers (2001) that young small groups and rich clusters represent different types of physical systems and hence different models of star formation. Therefore, we compare the mass function of Cha cluster with the mass function of other young small groups. In this case, we use the ratio of intermediate- to low-mass stars where = ( M⊙)/( M⊙) because the mass bins are wider than the uncertainties in stellar mass determination from PMS models and to alleviate the statistical issues raised when comparing mass functions of groups with small populations. For the Cha cluster we obtain = and for primaries and members, respectively. These values are consistent with the range of ratios found for nine small young groups/clusters containing 27 to 133 members (see Table I of Meyer et al. 2000).
4.3 Comparison with the field IMF
The observed ratios for Cha are consistent with the expected ratios (for primaries) using the IMF’s of Miller & Scalo (1979) () and Kroupa (2001) ().
Merging the above comparisons, we find no significant difference between the IMF for the Cha cluster, when compared to other small young stellar groups, rich young clusters, or field stars.
5 Population and mass distributions of the Cha cluster
5.1 Mass segregation and dynamical state
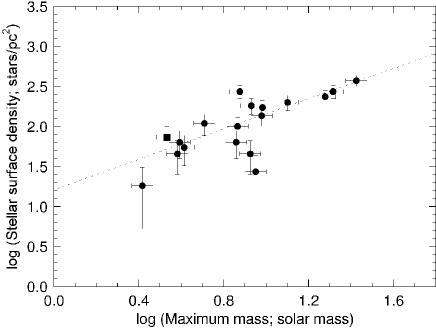
Hillenbrand (1995) shows a correlation between the stellar density of compact groups and open clusters, and the mass of the most massive cluster member; also see figure 2 of Clarke, Bonnell & Hillenbrand (2000). The Cha cluster follows the correlation seen in other clusters; see Figure 6. Following Hillenbrand (1995), we obtained the measure of cluster ‘richness’ by counting the number of primaries in the central 0.33 pc ( arcmin). For the Cha cluster, we count 8 primaries within 6 arcmin of our adopted cluster centre lead by the M⊙ B9 star Cha.
Studies have also shown that the most massive stars of rich stellar clusters are concentrated in the central core, e.g. Mon R2 (Carpenter et al., 1997), the Orion Nebula Cluster (Hillenbrand & Hartmann, 1998), NGC 6231 (Raboud & Mermilliod, 1998) and NGC 2157 in the LMC (Fischer et al., 1998). Employing -body simulations of stellar cluster populations, Bonnell & Davies (1998) suggest that mass segregation in rich clusters reflects the initial conditions of the cluster, and is not a consequence of dynamical interactions.
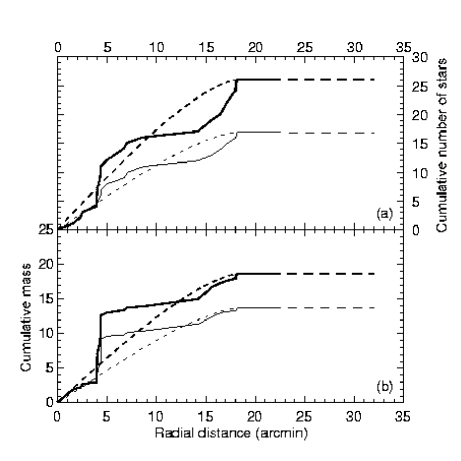
In Figure 7, we plot the cumulative radial (a) number and (b) mass distributions for primaries (thin lines) and members (bold lines) in the Cha cluster. These distribution plots are flat beyond arcmin, reflecting the absence of cluster members beyond this radius. The dotted lines are the expected distributions for isothermal spheres with core radius arcmin (0.5 pc). The radial distribution (Figure 7a) of stars is consistent with an isothermal sphere. However, the observed mass distribution (Figure 7b) appears more centrally concentrated than the isothermal model, with the difference significant at the percent confidence level for primaries ( percent for members) based on the 1-sample K-S test.
An alternative measure of mass segregation considers the radial () colour excess, where the photometric colour effectively acts as a mass surrogate. Sagar & Bhatt (1989) studied 12 open clusters via integrated UBV colours using the observations of individual cluster members and demonstrated that clusters showing pronounced mass segregation also show significant radial variations in integrated colour, where () = [() – ())] mag. For the Cha cluster stars, with no available -band photometry, we estimated the photospheric -band magnitude using the colour conversion tables of Kenyon & Hartmann (1995)111This is an appropriate technique even with the availability of - and -band fluxes, since PMS stars often show - and -excesses due to chromospheric emission.. Comparing the integrated colour for members residing within arcmin (the inner region), and those outside (the outer region) we find () (ignoring Cha itself to reduce the stochastic effects of the brightest cluster member). This colour excess for the Cha cluster exceeds all values found by Sagar & Bhatt (1989), whose highest value was () = 1.05 for NGC 6530.
From the radial mass and colour distributions, we conclude that significant mass segregation is present in the Cha cluster. This is the sparsest stellar cluster for which mass segregation has been seen. Without detailed dynamical modeling and the availability of precise space velocities for cluster members; see e.g. Delgado-Donate et al. (2003), our observations do not as-yet allow us to distinguish between mass segregation arising from the cluster formation process or from dynamical two-body or -body interactions.
A related question is whether the immediate environments of higher mass stars have unusual densities of lower mass stars, e.g. Orion Trapezium OB stars show high numbers of nearby low-mass stars (Preibisch et al., 1999) which may support models where high mass stars form from the coalescence of many lower mass stars (Testi, Palla & Natta, 1998). Two of the intermediate-mass stars, RS Cha (known double, and probable triple system) and HD 75505 (itself single), have low-mass stars residing within a few arcmin, while Cha itself (probable binary) appears isolated. We thus see no consistent excess nor deficiency of lower mass stars in the close vicinity of the higher mass stars.
5.2 Cluster geometry
There is a hint that the shape of the Cha cluster is flattened in Figure 1 with a projected axis ratio of 2:1 in a NE-SW orientation, although the flattening is not statistically significant due to the small- population. Flattened-shapes have been documented in other young clusters, e.g. the Orion Nebula Cluster, Mon R2, and NGC 2024 (Hillenbrand & Hartmann, 1998; Carpenter et al., 1997; Lada, Bally & Stark, 1991). These shapes may be the result of externally-triggered star formation, e.g. the passage of shock waves, or due to cloud-cloud collisions (Clarke et al., 2000). Possible internal triggers could involve an anisotropy of gravitational collapse due to magnetic fields, or possibly a non-spherical proto-cloud, e.g. Larson (1985).
5.3 Binary fraction
The 17 stellar systems in the Cha cluster include 4 known binaries of which one is a probable triple, and 4 probable binaries, for a multiple fraction of percent. Köhler & Petr-Gotzens (2002) surveyed the RECX stars and the CTT star ECHA J0843.3-7905 for companions with separations arcsec (800 AU) using - and -band speckle imaging. They resolved only RECX 1AB and RECX 9B with separations of AU. This indicates the other known and candidate binaries common to our studies (Köhler & Petr-Gotzens did not observe the two new low-mass candidate binaries announced in this paper) have separations AU, the diffraction limit of the 3.5-m NTT at -band. A possible constraint limiting the Köhler & Petr-Gotzens (2002) study is the mag detection limit between primaries and companions. However, with the exception of the probable low-mass companions to Cha and RS Cha AB, the other known and suspected binaries in the Cha cluster are near-equal mass (and therefore near-equal brightness) systems.
The known/probable multiple fraction in the Cha cluster is higher than the multiple fraction for solar-type main-sequence stars in the Sun’s neighborhood for separations AU (Duquennoy & Mayor, 1991). For a group of 17 systems, the binary separation distribution of Duquennoy & Mayor (1991) predicts multiple systems.
Köhler & Petr-Gotzens (2002) noted the non-detection of companions at separations arcsec or AU. We confirm this result, for separations arcsec ( AU), from our photometric survey which found no candidate cluster members located nearby known primaries. The distribution of Duquennoy & Mayor (1991) predicts systems with separations of AU. As discussed by Köhler & Petr-Gotzens (2002), this may indicate a deficiency of binaries with large separations in the Cha cluster.
In addition, pairs among the 8 known/probable multiple systems of the Cha cluster have companions of near-equal mass (mass ratio ). This result supports the notion that most binary stars form by fragmentation during the collapse of dense molecular cloud cores (Bodenheimer et al., 2000). Binaries resulting from star-disc capture (McDonald & Clarke, 1995) should show the companion mass distribution reflect almost random pairing from the IMF.
Kroupa (1995), Bouvier, Rigaut & Nadeau (1997) and Mathieu et al. (2000) suggest that the density of the star-forming region and the cloud temperature can influence the binary fraction. The high binary frequency in the Cha cluster is similar to the binary fraction in Taurus ( percent; Köhler & Leinert 1998) which is higher than that expected for field stars, and the binary fraction in Taurus-Auriga and Ophiuchus-Scorpius ( percent; Ghez et al. 1993), about higher than that for field stars. In dense star-formation regions, e.g. the Trapezium (Simon, Close & Beck, 1999) and NGC 2024, NGC 2068 and NGC 2071 (Padgett, Strom & Ghez, 1997), the binary fraction appears roughly equal to that of the field stars. Together these consistent results support a relation between the binary fraction and the stellar density of star-forming regions.
6 Conclusion Remarks
An optical photometric survey of arcmin ( pc) centered on the Cha star cluster has added two new M5 – M5.5 WTT stars to the known cluster population. With no other cluster members found at arcmin from the cluster centre, and as far as 32 arcmin in some directions, we have likely located all cluster primaries with spectral types earlier than M6 unless other stars have been more-distantly removed by evaporation or dynamical processes. These two new stars contribute to a cluster population of 17 primaries ranging from spectral type B9 – M5.5.
We characterise the binary population of the cluster using a diversity of evidence ranging from light curve analysis, radial velocity variability, speckle imaging and colour-magnitude diagram placement to identify 4 confirmed and 5 probable stellar companions, most with low mass ratios (:1). The high-mass ratio binary population of the cluster remains largely undefined, except for probable companions to two of three early-type stars. However, the known/likely multiple fraction of percent is already higher than the observed field star multiplicity.
We investigate the Cha cluster IMF by comparison to the IMF of a well-characterised rich young cluster (Trapezium), and predict undiscovered low-mass stars and brown dwarfs ( M⊙) are likely to be associated with the known stellar population of 17 primaries ( members). We also compare the cluster IMF to that of other sparse young stellar groups, and to the field IMF. We find no significant difference between the IMF of the Cha cluster and the three comparator groups. This suggests there is no diversity in the IMF across several orders of magnitude size scale of star formation in the Galaxy.
From study of the cluster’s spatial and mass distribution we find the Cha cluster has significant mass segregation, with percent of the stellar mass residing within the central 6 arcmin (0.17 pc). Since the Cha cluster is, at the same time, sparse (17 primaries), diffuse (average stellar density of stars pc-3) and young (9 Myr), the cluster may be an excellent laboratory for distinguishing between mass segregation that is primordial in nature, or due to dynamical interaction processes.
Acknowledgments
ARL acknowledges the support of a UNSW@ADFA International Postgraduate Research Scholarship. WAL’s research is supported by UNSW@ADFA Faculty Research Grants and Special Research Grants. EDF thanks the University of New South Wales and Australian Defence Force Academy for hospitality. LAC is supported by a National Research Foundation Postgraduate Scholarship. We thank the SAAO and MSSSO time allocation committees for telescope time during 2002. We also thank the referee for reminding us of the body of recent theoretical work underpinning cluster dynamics studies.
References
- Adams & Myers (2001) Adams, F. C., Myers, P. C., 2001, ApJ, 553, 744
- Andersen (1991) Andersen J., 1991, A&ARv, 3, 91
- Battinelli & Capuzzo-Dolcetta (1991) Battinelli P., Capuzzo-Dolcetta R., 1991, MNRAS, 249, 76
- Bessell (1990) Bessell M. S., 1990, A&ASS, 83, 357
- Bessell (1991) Bessell M. S., 1991, AJ, 101, 662
- Bessell (1999) Bessell M. S., 1999, PASP, 111, 1426
- Bodenheimer et al. (2000) Bodenhermer P., Burkert A., Klein R. I., Boss A. P., 2000, in Mannings V., Boss A. P., Russell S. S., eds, Protostars and Planets IV, University of Arizona, p. 675
- Bonnell & Davies (1998) Bonnell I. A., Davies M. B., 1998, MNRAS, 295, 691
- Bouvier, Rigaut & Nadeau (1997) Bouvier J., Rigaut F., Nadeau D., 1997, A&A, 323, 139
- Carpenter et al. (1997) Carpenter J. M., Meyer M. R., Dougados C., Strom S. E., Hillenbrand L. A., 1997, AJ, 114, 198
- Clarke et al. (2000) Clarke C. J., Bonnell I. A., Hillenbrand L. A., 2000, in Mannings V., Boss A. P., Russell S. S., eds, Protostars and Planets IV, University of Arizona, p. 151
- Delgado-Donate, Clarke & Bate (2003) Delgado-Donate, E. J., Clarke, C. J., Bate, M. R., 2003, MNRAS, 342, 926
- Duquennoy & Mayor (1991) Duquennoy A., Mayor M., 1991, A&A, 248, 485
- Elmegreen (2002) Elmegreen B. G., 2002, ApJ, 577, 206
- Elmegreen et al. (2000) Elmegreen B. G., Efremov Y., Pudritz R. E., Zinnecker H., 2000, in Mannings V., Boss A. P., Russell S. S., eds, Protostars and Planets IV, University of Arizona, p. 179
- Fischer et al. (1998) Fischer P., Pryor C., Murray S., Mateo M., Richtler T., 1998, AJ, 115, 592
- Feigelson et al. (2003) Feigelson, E. D., Gaffney, J. A., Garmire, G., Hillenbrand, L. A., Townsley, L., 2003, ApJ, 584, 911
- Ghez, Neugebauer & Matthews (1993) Ghez A. M., Neugebauer G., Matthews K., 1993, AJ, 106, 2005
- Hillenbrand (1995) Hillenbrand L. A., 1995, Herbig Ae/Be stars : An investigation of molecular environments and associated stellar populations, Ph.D. Thesis, University of Massachusetts
- Hillenbrand & Hartmann (1998) Hillenbrand L. A., Hartmann L. W., 1998, ApJ, 492, 540
- Kazarovets et al. (2003) Kazarovets E. V., Kireeva N. N., Samus N. N., Durlevich O. V., 2003, Inform. Bull. Var. Stars, 5422
- Kenyon & Hartmann (1995) Kenyon S. J., Hartmann L., 1995, ApJSS, 101, 117
- Köhler & Leinert (1998) Köhler R., Leinert C., 1998, A&A, 331, 977
- Köhler & Petr-Gotzens (2002) Köhler R., Petr-Gotzens M. G., 2002, AJ, 124, 2899
- Kroupa (1995) Kroupa P., 1995, MNRAS, 277, 1491
- Kroupa (2001) Kroupa P., 2001, MNRAS, 322, 231
- Lada, Bally & Stark (1991) Lada E. A., Bally J., Stark A. A., 1991, ApJ, 368, 432
- Larson (1985) Larson R.B., 1985, MNRAS, 214, 379
- Lawson et al. (2001) Lawson W. A., Crause L. A., Mamajek E. E., Feigelson E. D., 2001, MNRAS, 321, 57
- Lawson et al. (2002) Lawson W. A., Crause L. A., Mamajek E. E., Feigelson E. D., 2002, MNRAS, 329, L29
- Lawson & Feigelson (2001) Lawson W. A., Feigelson E. D., 2001, in Montmerle T., André P, eds, ASP Conf. Series Vol. 243, From Darkness To Light, Astron. Soc. Pac., San Francisco, p. 591
- Lyo et al. (2003) Lyo A-R., Lawson W. A., Mamajek E. E., Feigelson E. D., Sung E-C., Crause L. A., 2003, MNRAS, 338, 616
- Mamajek et al. (1999) Mamajek E. E., Lawson W. A., Feigelson E. D., 1999, ApJ, 516, L77
- Mamajek et al. (2000) Mamajek E. E., Lawson W. A., Feigelson E. D., 2000, ApJ, 544, 356
- Mathieu et al. (2000) Mathieu R. D., Ghez A. M., Jensen E. L. N., Simon M., 2000, in Mannings V., Boss A. P., Russell S. S., eds, Protostars and Planets IV, University of Arizona, p. 703
- McDonald & Clarke (1995) McDonald J. M., Clarke C. J., 1995, MNRAS, 275, 671
- Meyer et al. (2000) Meyer M. R., Adams F. C., Hillenbrand L. A., Carpenter J. M., Larson R. B., 2000, in Mannings V., Boss A. P., Russell S. S., eds, Protostars and Planets IV, University of Arizona, p. 121
- Miller & Scalo (1979) Miller G. E., Scalo J. M., 1979, ApJS, 41, 513
- Muench et al. (2002) Muench A. A., Lada E. A., Lada C. J., Alves J., 2002, ApJ, 573, 366
- Padgett, Strom & Ghez (1997) Padgett D. L., Strom S. E., Ghez A., 1997, ApJ, 477, 705
- Preibisch et al. (1999) Preibisch T., Balega Y., Hofmann K., Weigelt G., Zinnecker H., 1999, New Astronomy, 4, 531
- Raboud & Mermilliod (1998) Raboud D., Mermilliod J. C., 1998, A&A, 333, 897
- Sagar & Bhatt (1989) Sagar R., Bhatt H. C., 1989, Journal of Astrophysics and Astronomy, 10, 173
- Siess et al. (2000) Siess L., Dufour E., Forestini M., 2000, A&A, 358, 593
- Simon, Close & Beck (1999) Simon M., Close L. M., Beck T. L., 1999, AJ, 117, 1375
- Sterzik, Durisen & Pickett (2001) Sterzik M. F., Durisen R. H., Pickett B. K., 2001, in Jayawardhana R., Greene T. P., eds, Young Stars Near Earth: Progress and Prospects, ASP Conf. Series, 244, p. 116
- Testi, Palla & Natta (1998) Testi L., Palla F., Natta A., 1998, A&AS, 133, 81
- Walter et al. (2000) Walter F. M., Alcalá J. M., Neuhäuser R., Sterzik M., Wolk S. J., 2000, in Mannings V., Boss A. P., Russell S. S., eds, Protostars and Planets IV, University of Arizona, p. 273