Inter-cluster Filaments of Galaxies Programme: Pilot Study Survey and Results
Abstract
We present results from a pilot study of a new wide-field, multicolour (BVR) CCD imaging project, designed to examine galaxy evolution along large scale filaments that connect clusters of galaxies at intermediate redshifts (). Our pilot dataset is based on 0.56 degree2 of observations targeted on Abell 1079 and Abell 1084 using the Wide Field Imager on the Anglo-Australian Telescope. We describe our data reduction pipeline and show that our photometric error is 0.04 mags. By selecting galaxies that lie on the colour-magnitude relation of the two clusters we verify the existence of a low density (– Mpc-2) filament population conjoining them at a distance of from either cluster. By applying a simple field correction, we characterize this filament population by examining their colour distribution on a – plane. We confirm the galaxian filament detection at a level using a cut at and we discuss their broad properties.
keywords:
surveys – catalogues – galaxies: photometry – galaxies: clusters: individual: Abell 1079 – galaxies: clusters: individual: Abell 10841 Introduction
Large scale surveys of the Universe such as the 2dF Galaxy Redshift Survey (2dFGRS; e.g. Colless et al. 2001) and the Sloan Digital Sky Survey (SDSS; e.g. Stoughton et al. 2002) clearly demonstrate the filamentary organization of galaxies. These filaments of galaxies stretch between clusters and superclusters of galaxies at all redshifts (e.g. Kaldare et al. 2003; Einasto et al. 1997), forming a characteristic sponge-like structure through the Universe (Drinkwater 2000 and references therein). Reproduction of such filaments is readily achieved in modern hydrodynamical simulations of the Universe within the framework of cold dark matter (e.g. Jenkins et al. 1998).
Whilst much effort has been expended on analysing the nodes of these filaments (i.e. clusters of galaxies; e.g. De Propris et al. 2002), only a little progress has been made into the largely over-looked large scale structure beyond the core of these nodes (Pimbblet et al. 2002; Kodama et al. 2001 amongst others).
| Cluster | R.A. | Dec. | ||
|---|---|---|---|---|
| (J2000) | () | |||
| Abell 1079 | 10 43 24.90 | 07 22 45 | 0.133 | 0.45 |
| Abell 1084 | 10 44 30.72 | 07 05 02 | 0.134 | 7.42 |
The Inter-cluster Filaments of Galaxies Programme (In-FOG-Pro) is a long-term project to study a sample of large-scale structure at intermediate redshifts () in the southern hemisphere. Our broad goals are to understand evolution of filaments of galaxies and to examine the role that filaments play in the evolution of the (super-)clusters that they (intra-)connect.
For this, the pilot study, a potential filament was selected merely on the basis of observational availability during service time operations at the Anglo-Australian Telescope (AAT). The filament selection technique for the larger programme will be presented in a future publication. The simple premise is that the two target clusters of galaxies observed, Abell 1079 and Abell 1084, are close to each other in redshift (; Pimbblet et al. 2002) and have a small spatial offset ( arcmin), hence they are expected to demonstrate a filamentary connection. The global properties for the cluster targets in our pilot study are presented in Table 1. To map their connecting filament, the Wide Field Imager (WFI) instrument is used as it provides a near-unrivalled field of view of 8 k pixels2 which corresponds to at the redshift of our target filament111Throughout this work, values of km s-1 Mpc-1 and are adopted..
This article presents the details of the photometric reduction, calibration and analysis of the WFI imaging of the pilot study. The plan of the paper is as follows: In §2 we discuss the imaging observations obtained for the pilot study, the data reduction methods, catalogue construction and calibration. In §3, after examining our internal consistency, we compare the galaxy catalogue derived from our WFI imaging with that from the Las Campanas/AAT Rich Cluster Survery (LARCS; e.g. Pimbblet et al. 2001). In §4, we verify the existence of an inter-cluster filament and by employing a simple field correction technique, we make a colour-colour analysis of these filament galaxies and calculate the significane of the filament overdensity in §5. We summarize our main conclusions in §6.
2 Optical Imaging and Data Reduction
The observations for our pilot study were made and completed using WFI at the AAT in February 2003. These data are presented in Table 2. Our prime observations are the ones taken on 01 February. Since they are taken in non-photometric conditions, however, necessary calibration observations also need to be employed (02 February).
WFI is a mosaic imager that consists of 8 individual CCDs, each 2 k 4 k pixels2 in size. This gives a pixel scale of /pixel and a total mosaic field of view for each exposure of . By targetting the observations on the cluster centres, the exposures cover the filament and overlap by some 200 square arcmin (Figure 1).
| Cluster | Date | Pass- | Seeing | Phot? | |
|---|---|---|---|---|---|
| (2003) | band | (′′) | (sec) | ||
| Abell 1079 | Feb 01 | 2.3–2.5 | 600 | no | |
| Feb 01 | 2.3–2.5 | 600 | no | ||
| Feb 01 | 2.3–2.5 | 600 | no | ||
| Feb 02 | 4.3–4.5 | 300 | yes | ||
| Feb 02 | 4.3–4.5 | 300 | yes | ||
| Feb 02 | 4.3–4.5 | 300 | yes | ||
| Abell 1084 | Feb 01 | 2.3–2.5 | 600 | partial | |
| Feb 01 | 2.3–2.5 | 600 | no | ||
| Feb 01 | 2.3–2.5 | 600 | no | ||
| Feb 02 | 4.3–4.5 | 300 | yes | ||
| Feb 02 | 4.3–4.5 | 300 | yes | ||
| Feb 02 | 4.3–4.5 | 300 | yes |

These imaging data are reduced using standard packages within iraf, inparticular the mscred package. Steps undertaken initially include debiasing and preliminary flatfielding with twilight flats and creation of super-flats from independent stacks of the science observations and the application of these to the science pointings.
To test the precision of the flatfielding, the iraf task imstat is used to obtain the mean background levels at various locations on each mosaic tile. The variation in the sky background is found to be percent in all cases apart from CCD1. CCD1 shows significant fringing patterns across most ( per cent) of the chip, with the -band imaging being the worst affected. Since the observations are only two times one-shot exposures per cluster (Table 2), removal of the fringing pattern proves to be an intractable problem. Unavoidably, therefore, our analysis herein discards CCD chip 1; see Figure 1.
2.1 Catalogue Construction and Calibration
SExtractor (Bertin & Arnouts 1996) is used to automatically analyse the observations, detect sources and parametrize them. We catalogue the -band frames, detecting sources having more than 12 contiguous pixels each of the sky above the background. Since our - and -band observations are pointed in the same direction (to better than 1 pixel accuracy) and possess the same seeing quality (checked by measuring the FWHM of stars in the field using SExtractor) as the -band observation, we run SExtractor in dual mode (same apertures) to derive colour information for these sources.
The photometric observations (02 February) are calibrated to observations of standard stars selected from Landolt (1992) scattered throughout the night at various airmasses. Colour terms are fitted for by using standard star observations taken at the same airmass. Extinction is accounted for by fitting the variation in standard star photometry in one night with their measured airmass. In turn, these are used to calibrate the primary, partial- and non-photometric science observations (01 February) by comparing magnitudes in seeing-scaled apertures. Our final zeropoint error is calculated to be mags in all three passbands.
As all of our observations are one-shot images, cosmic ray rejection is problematical. We use the method of Rhoads (2000) which searches for features with significant power at spatial frequencies too high to be legitimate objects. This eliminates all but the largest of cosmic rays and satellite trails (i.e. several 10s of contiguous pixels) which are identified and removed by hand and/or SExtractor’s flag parameter.
Astrometry is performed individually on each CCD of the mosaic. Approximately 50 stars per CCD are tied to the positions from the APM (e.g. Maddox et al. 1990; http://www.ast.cam.ac.uk/apm/). The positions of the unknown sources (both galaxies and stars) are subsequently determined by use of the astrom package from starlink.
2.2 Star-Galaxy Separation

To reliably differentiate between stars and galaxies in our catalogue, we broadly follow the method of Pimbblet et al. (2001). On a plane of magnitude versus fwhm, stars should trace a locus of fixed fwhm ( seeing) at bright () magnitudes (Pimbblet et al. 2001). Figure 2 displays this information for our catalogue. By employing a cut of fwhm, we are readily able to select a galaxy population from the parent catalogue. When combined with a reasonable cut in SExtractor’s class_star parameter of (see Figure 2), we estimate that our ultimate stellar contamination rate is per cent at bright magnitudes (). Although it is appropriate to consider this cut to be conservative, it still includes more compact galaxies (Pimbblet et al. 2001) but risks missing out the newly discovered class of ultra-compact dwarf galaxies whose appearance is markedly stellar (Drinkwater et al. 2003). To check that early-type galaxies have not been classified as stars, we construct colour-magnitude diagrams for those objects with class_star and fwhm and find that there is no hint of a colour-magnitude relation (Visvanathan & Sandage 1977).
3 Photometric Accuracy of the Catalogue
3.1 Internal Consistency
First, the internal consistency of the photometric solution is tested by employing the overlap of our target observations (Figure 1). We use SExtractor’s mag_best, a maximum search radius of and only those sources whose flag parameter is equal to 0, thus eliminating saturated and heavily blended objects as well as those that fall close to the chip edges. This results in 681 matched objects whose median magnitudinal difference from the Abell 1079 pointing to the Abell 1084 one is mags in all three passbands. Further, the scatter as a function of magnitude is consistent with the errors given by SExtractor. Therefore we consider the magnitudinal zeropoint error of 0.04 mags to be our dominant source of error.
As the final step, we now remove all duplicate objects identified in the overlap area by averaging their critical parameters (e.g. magnitudes) to create our master catalogue.
3.2 Comparison to LARCS
The LARCS data used consists of high quality CCD images of a 2 degree field centred around Abell 1084 that were obtained at Las Campanas Observatory using the 1-m Swope Telescope. More details of the observations, reduction and analysis of these data are given by Pimbblet et al. (2001). It is sufficient for our discussion to note that LARCS covers all of the In-FOG-Pro observations (Figure 1) and that for their brighter objects (), the LARCS internal magnitudinal errors are certainly better than mags. Their pixel scale ( pixel-1), however, is much poorer than ours ( pixel-1). By accounting for Galactic reddening (Schlegel, Finkbeiner & Davis 1988) we are readily able to compare our magnitudes to the LARCS ones.
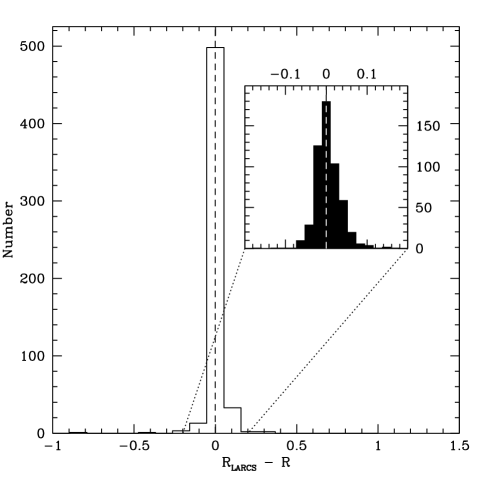
Figure 3 displays the results of comparing all sources with a magnitude cut of and a maximum search radius of . This results in 569 matched objects. The median magnitude offset is measured as from LARCS to this work. Such a small value is well inside our assumed zeropoint error of 0.04 mags.
4 Filament Verification
4.1 Defining the Filament
All clusters of galaxies display a colour-magnitude relation (CMR; Bower, Lucey & Ellis 1992; Visvanathan & Sandage 1977) of early-type (i.e. elliptical and lenticular) galaxies. Indeed, so ubiquitous is this relation that Gladders & Yee (2000) are using it to discover new high-redshift clusters. Therefore we assume that any filament that connects our two clusters should also have early-type galaxies that lie close to the cluster’s CMR. Moreover, galaxies lying on the CMR will be at approximately the same redshift.
Figure 4 shows the CMR for all galaxies in our sample. Pimbblet et al. (2002) have already shown that the CMR of Abell 1084 is very similar to that of Abell 1079. Therefore, we make use of the mean CMR slope and intercept values published by Pimbblet et al. (2002) for our two clusters; slope=, intercept where 222Our notation refers to the colour of the CMR at an absolute magnitude of . Similarly, is the magnitude that corresponds to an absolute magnitude of . Further, the value of has been chosen as it approximates well the magnitude of an galaxy (Pimbblet et al. 2002). Apparent magnitudes are computed using differential -corrections (i.e. a ‘no-evolution’ model; Pimbblet et al. 2002; Smail et al. 1998; Kodama & Arimoto 1997).. Assuming that the CMR stretches between these clusters, we are able to make an initial pass at defining filament membership (at least for the old elliptical galaxies) by taking galaxies within the 333We employ a scatter in the colour as: (i) the CMR fit made by Pimbblet et al. (2002) is only valid in the central 2 Mpc region and (ii) the width of the CMR is known to significantly broaden with clustocentric radius due to age effects (Pimbblet et al. 2002; Kodama, Bower & Bell 1999). colour (measured with mag_iso) scatter of this relation (see Figure 4).

4.2 Spatial Distribution
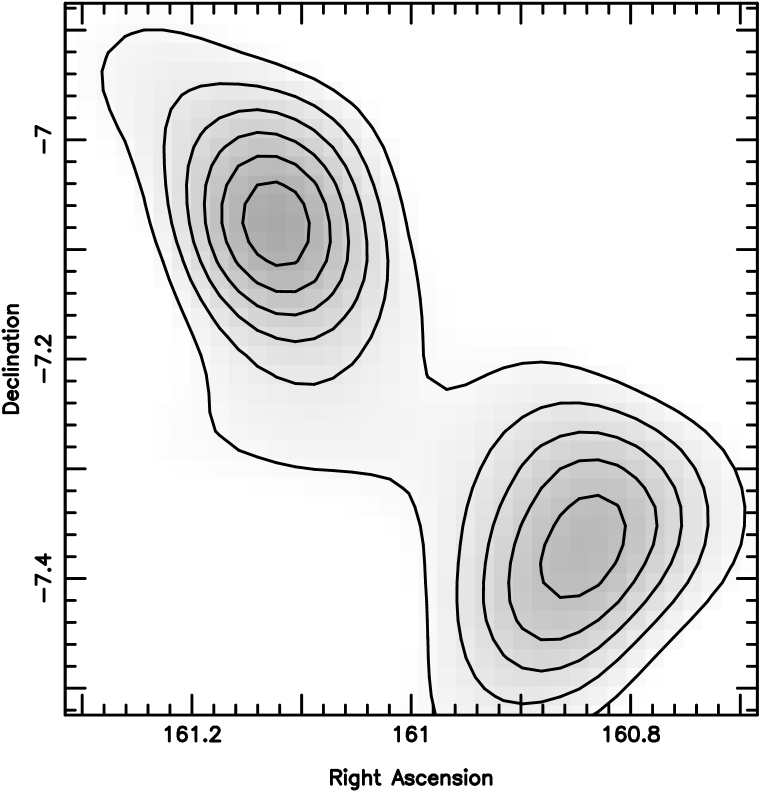
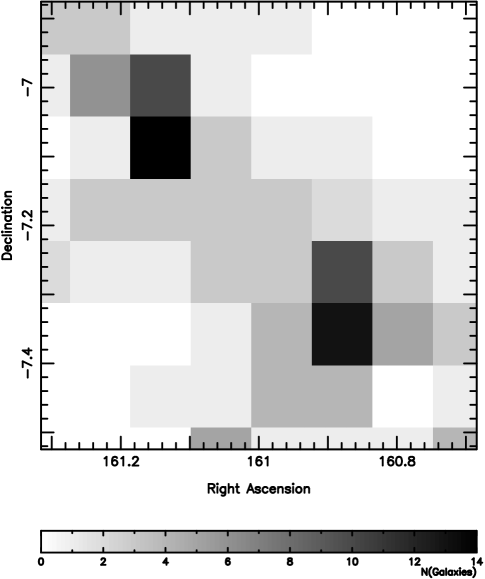
Using a fiducial limiting magnitude of to be consistent with other studies (Butcher & Oemler 1984; Pimbblet et al. 2002), we plot the smoothed spatial distribution of these filament members in Figure 5. For comparison purposes we provide an un-smoothed version of this in Figure 6. The overdensities seen are the cluster centres. Importantly, there is a population of CMR members that stretches between the clusters at a distance of from either cluster (Abell, Corwin & Olowin, 1989). Given the low density of these galaxies (an order of magnitude less dense in the filament than in the cluster), we infer that early-type galaxies do not dominate the filament outside the cluster centres. Moreover, it is near this density regime ( galaxy Mpc-2) where a noted turn-over in star-formation rate occurs (Gómez et al. 2003; Lewis et al. 2002). We must therefore account for the bluer filament members.
5 Colour-colour Analysis
In order to proceed to analyze the total filament population in the absence of spectroscopy, we must employ some kind of statistical background correction to remove contaminating foreground and background galaxies. To sample the contaminating field galaxies, the two CCD chips at opposite extrema of the observations are used. Using this sample will inevitably result in some small amount of filament galaxies being subtracted, the effect being more pronounced at fainter magnitudes (Smail et al. 1998) However, we consider this number to be small as these CCD chips are sufficiently far away from our filament (– Mpc) as to not contain many filament or cluster members (Figures 1 and 5; also see Kodama & Bower 2001 and Paolillo et al. 2001 for a perspective on sampling the background close to clusters).
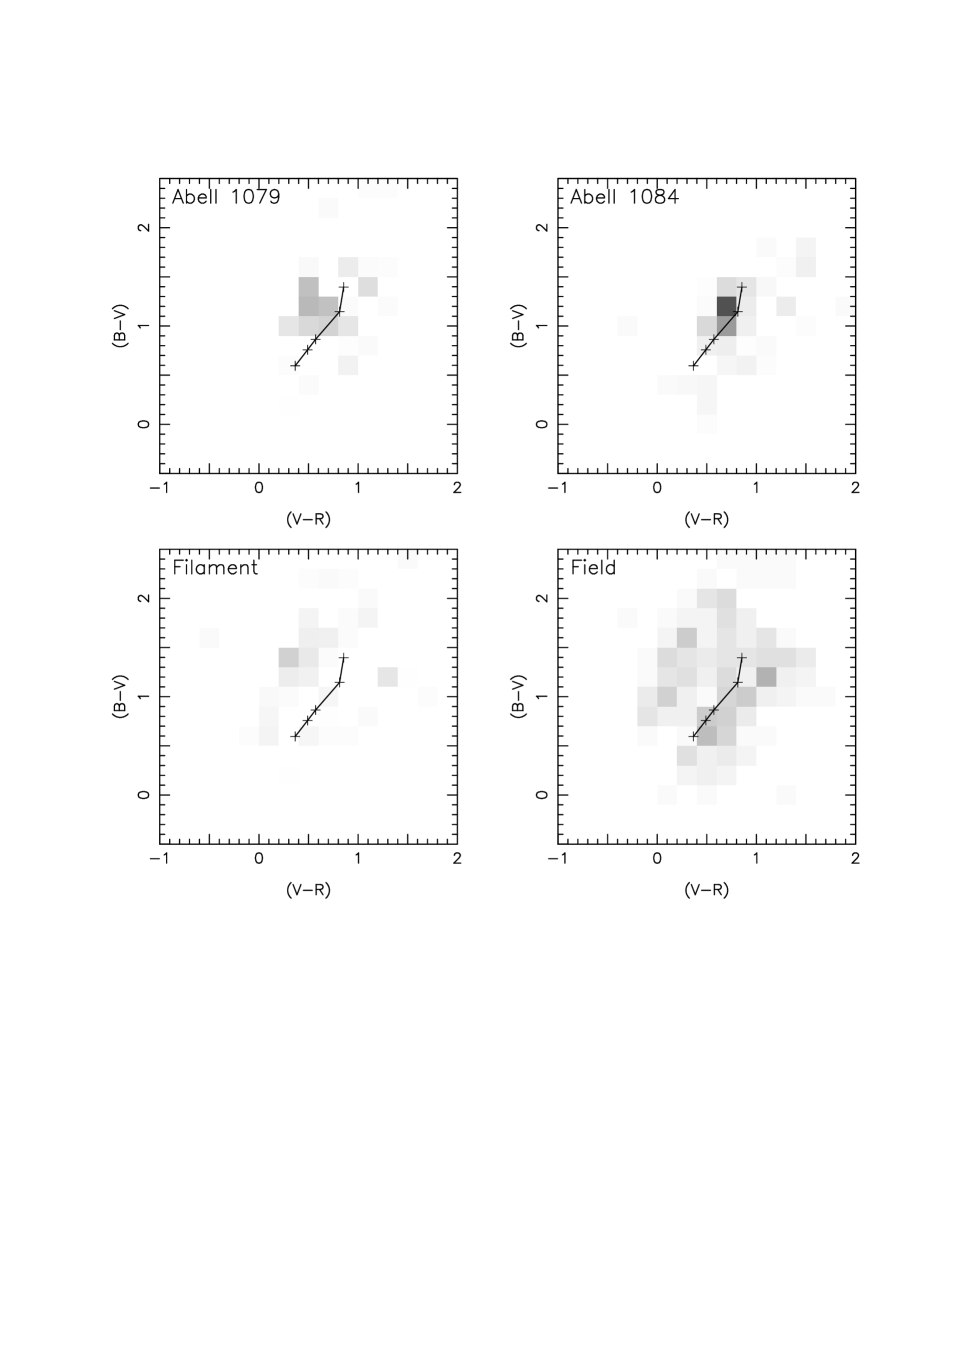
We proceed by dividing up our filament sample into three sub-samples: Abell 1079, Filament and Abell 1084. These sub-samples are centred upon the clusters (Table 1) and the approximate filament centre (, ; see Figure 5) out to a radius of degrees. At this radius, the samples touch but do not overlap one another.
Colour-colour diagrams in the plane are constructed for the field and three sub-samples with . An area-scaled amount of the field sample444The area of the field sample is arcmin2. is then subtracted from corresponding regions on the – plane of the filament sub-samples to generate the final distribution. The result of this analysis is presented in Figure 7. We overlay on these plots the expected colours of various local morphological types, assuming a no-evolution model, as they would be observed at the mean redshift of the clusters.
5.1 Discussion
Both of the clusters show a clear overdensity of early- to mid-type galaxies with a number of bluer galaxies. Given the cluster blue fractions () calculated by Pimbblet et al. (2002), this is unsurprising. Conversely, the filament’s galaxian population is an ecletic mixture of bluer galaxies that span a range of star formation rates (Figure 7).
In order to better constrain the existence of the filament, we now estimate its overdensity from an analysis of Figure 7. Since we know the expected field population (), we can compute the excess number of galaxies above this level for the filament sub-sample on the colour-colour plane (akin to Pimbblet et al. 2002). Following Paolillo et al. 2001, the galaxy number excess is given by:
| (1) |
If our field sample has been chosen too close to the clusters, however, it will obviously contain some (small but non-negligible) amount of contamination:
| (2) |
where is simply the ratio between the galaxy densities of the filament and field populations (Paolillo et al. 2001). Substituting instead of from Eq. (2) into Eq. (1) generates
| (3) |
By using a field sample too close to our filament sub-sample this implies that our final number counts will be diminished somewhat. It follows that the ultimate error budget is therefore composed of a number of sources: Poissonian errors for the filament count, Poissonian errors for the field and galaxy number density variance. Since the area of the field sample is than the area of the filament sample, the field Poissonian error is small and the other two sources of error dominate the final error. The galaxy number density variance is measured directly from the catalogues whilst Poissonian errors are computed from the field correction technique. The number of galaxies found in excess of the field population is plotted in Figure 8. Thus at a magnitude of , the filament is detected at a level (falling to at and at ; Figure 8). We are also able to compute the fraction of these galaxies that have colours consistent with the CMR, . Significantly, gives us an approximate yet effective lower bound to the number of galaxies expected to be at the filament redshift (since CMR members are early-type galaxies at similar ). This fraction ranges from at bright magnitudes to at fainter ones (Figure 8).
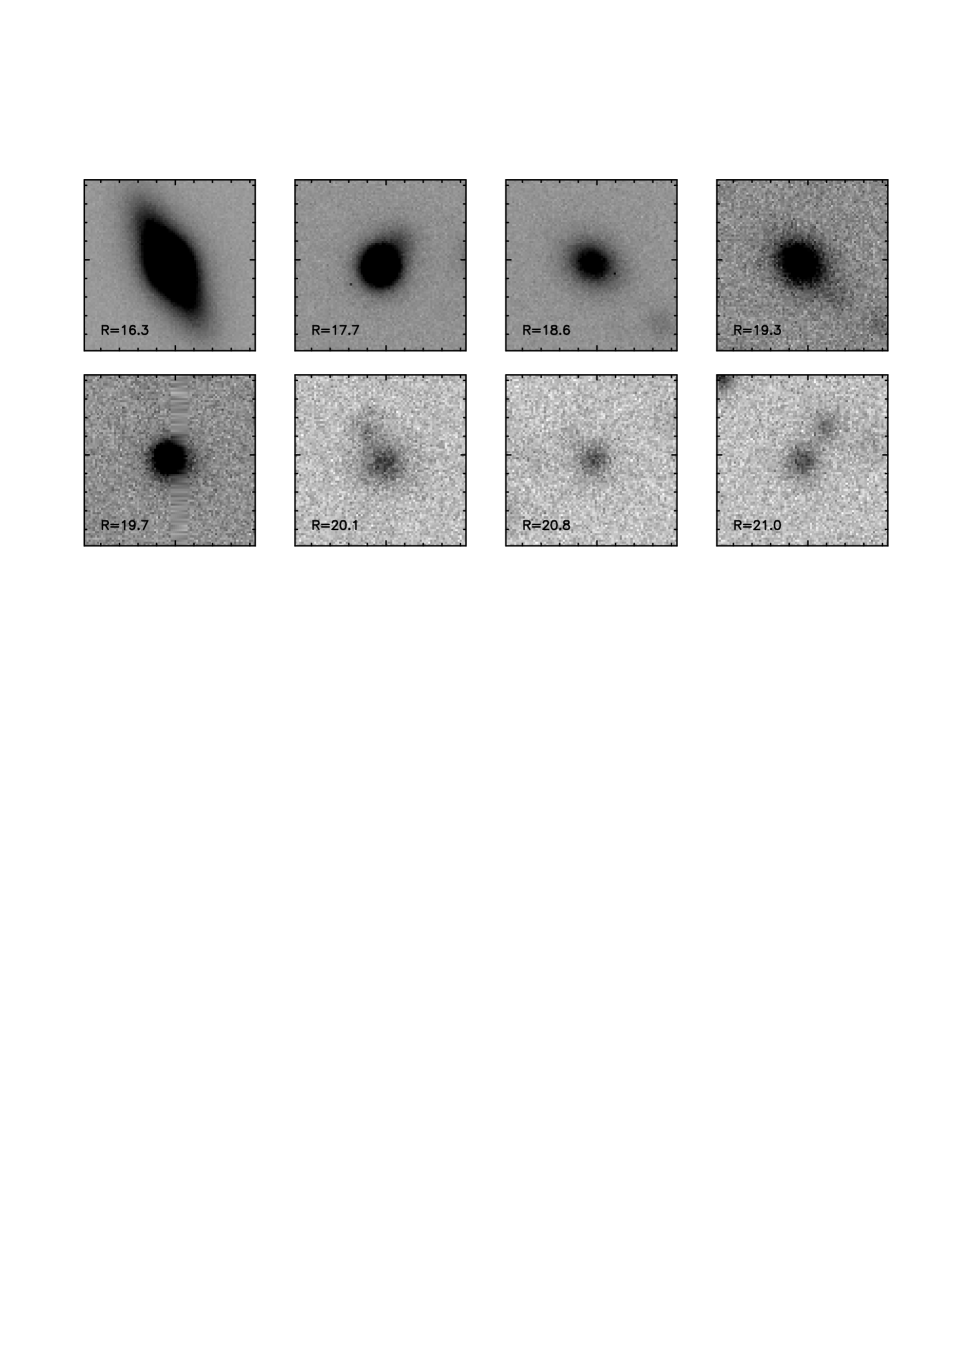
We now attempt to visually characterize the filament population by selecting filament galaxies whose colours make them part of the fraction and are hence highly likely to be at the filament redshift555We emphasize the caveat that there will be some small amount of contamination in the CMR population. Given their colours, we are confident that the majority of these potential filament members are at the appropriate redshift.. Figure 9 displays a selection of these potential filament galaxies. Whilst there are many of early-type galaxies (e.g. , Figure 9), some of them are morphologically mid-type galaxies (e.g. , Figure 9 is visually classified as an Sab type). A couple possess features indicative of recent interactions (e.g. the galaxy in Figure 9 has a distinct spike to its upper right whilst the galaxy appears to have either just undergone an interaction with its neighbour to its upper left, or is just about to).
It is these galaxies that will eventually be accreted to the clusters. Although on the filament and above the critical turn-over for star-formation-density (3–4 Mpc-2 c.f. 1–2 Mpc-2; Gómez et al. 2003; Lewis et al. 2002), some of these galaxies appear to still be actively star-forming (Figures 7 and 9). Therefore, whatever the environmental mechanism for turning off star-formation in the central regions of clusters (e.g. Pimbblet 2003), it has affected some filament galaxies and not others. Given that the present study only samples one filament, further studies into this density regime are urgently required to differentiate between the possible mechanisms. If the strangulation scenario forwarded by Balogh et al. (2000) is confirmed, then it must be able to operate in these low density environs (see also Balogh et al. 2002; Bekki, Couch and Shioya 2001; Fasano et al. 2000). Thus it is in studies such as the present one that we will be able to observe the onset of strangulation.

6 Summary
This work has presented the multicolour (BVR) CCD pilot observations for a larger study of inter-cluster filaments of galaxies. Inparticular, we have shown that:
-
•
A low density filament of galaxies stretches between Abell 1079 and Abell 1084 and we have detected it at a level ( cut).
-
•
The early-type component of this filament is an order of magnitude less dense than similar ones in the cluster centres, perhaps 3–4 galaxies per Mpc2.
-
•
The bluer galaxies are mostly morphologically mid- to early-types with a number displaying signs of recent interactions. This point will be examined in more detail in a forthcoming article.
-
•
Given the colours and states of these filament galaxies, whatever the mechanism responsible for suppressing star-formation rate in cluster centres, it is only just beginning to have an effect in the filamentary region.
This is the first publication in a series based on the In-FOG-Pro observations. In our future publications we will be able to combine observations from numerous filaments resulting in significant improvement of our signal to noise and hence be able to better characterize the galaxy populations in such low density environments. Using our planned spectroscopic followup observations we will also be able to examine star formation rates using spectral lines (e.g. [OII]; H)
Acknowledgements
The imaging observations presented in this work were taken in WFI service mode operations at the AAT in February 2003 by C. Tinney whom we wish to thank. We also thank useful conversations with A. Karick, G. Dalton, I. Smail, A. Edge and W. Couch. M. Hawkrigg is also thanked for her careful reading of this work which has significantly improved its quality. KAP acknowledges support from an EPSA University of Queensland Research Fellowship.
References
- [Abell 1989] Abell G. O., Corwin H. G., Olowin R. P., 1989, ApJS, 70, 1
- [Balogh 2002] Balogh M. L., Smail I., Bower R. G., et al., 2002, ApJ, 566, 123
- [Balogh 2000] Balogh M. L., Navarro J. F., Morris S. L., 2000, ApJ, 540, 113
- [Bekki 2001] Bekki K., Couch W. J., Shioya Y., 2001, PASJ, 53, 395
- [Bertin & Arnouts (1996)] Bertin E., Arnouts S., 1996, A&AS, 117, 393
- [Bower, Lucey, & Ellis(1992)] Bower R. G., Lucey J. R., Ellis R. S., 1992, MNRAS, 254, 601
- [Butcher & Oemler(1984)] Butcher H., Oemler A., 1984, ApJ, 285, 426
- [Colless et al.(2001)] Colless M. et al., 2001, MNRAS, 328, 1039
- [De Propris et al.(2002)] De Propris R. et al., 2002, MNRAS, 329, 87
- [Drinkwater (2000)] Drinkwater M. J., 2000, Science, 287, 1217
- [Drinkwater et al.(2003)] Drinkwater M. J., Gregg M. D., Hilker M., Bekki K., Couch W. J., Ferguson H. C., Jones J. B., Phillipps S., 2003, Nature, 423, 519
- [Ebeling et al.(1996)] Ebeling H., Voges W., Bohringer H., Edge A. C., Huchra J. P., Briel U. G., 1996, MNRAS, 281, 799
- [Einasto et al.(1997)] Einasto M., Tago E., Jaaniste J., Einasto J., Andernach H., 1997, A&AS, 123, 119
- [Fasano 2000] Fasano G., Poggianti B. M., Couch W. J., Bettoni D., Kjærgaard P., Moles M., 2000, ApJ, 542, 673
- [\citeauthoryearFukugita, Shimasaku, & Ichikawa1995] Fukugita M., Shimasaku K., Ichikawa T., 1995, PASP, 107, 945
- [Gladders & Yee(2000)] Gladders M. D., Yee H. K. C., 2000, AJ, 120, 2148
- [Gómez et al.(2003)] Gómez P. L. et al., 2003, ApJ, 584, 210
- [Jenkins et al.(1998)] Jenkins A. et al., 1998, ApJ, 499, 20
- [Kaldare, Colless, Raychaudhury, & Peterson(2003)] Kaldare R., Colless M., Raychaudhury S., Peterson B. A., 2003, MNRAS, 339, 652
- [Kodama et al.(2001)] Kodama T., Smail I., Nakata F., Okamura S., Bower R. G., 2001, ApJL, 562, L9
- [Kodama & Bower(2001)] Kodama T., Bower R. G., 2001, MNRAS, 321, 18
- [Kodama, Bower, & Bell(1999)] Kodama T., Bower R. G., Bell, E. F., 1999, MNRAS, 306, 561
- [Kodama & Arimoto(1997)] Kodama T., Arimoto N., 1997, A&A, 320, 41
- [Landolt(1992)] Landolt A. U., 1992, AJ, 104, 340
- [Lewis et al.(2002)] Lewis I. et al., 2002, MNRAS, 334, 673
- [Maddox, Efstathiou, Sutherland, & Loveday(1990)] Maddox S. J., Efstathiou G., Sutherland W. J., Loveday J., 1990, MNRAS, 243, 692
- [Paolillo 2001] Paolillo M., Andreon S., Longo G., Puddu E., Gal R. R., Scaramella R., Djorgovski S. G., de Carvalho R., 2001, A&A, 367, 59
- [Pimbblet03] Pimbblet K. A., 2003, PASA, in press
- [Pimbblet et al.(2002)] Pimbblet K. A., Smail I., Kodama T., Couch W. J., Edge A. C., Zabludoff A. I., O’Hely E., 2002, MNRAS, 331, 333
- [Pimbblet et al.(2001)] Pimbblet K. A., Smail I., Edge A. C., Couch W. J., O’Hely E., Zabludoff A. I., 2001, MNRAS, 327, 588
- [Pimbblet(2001)] Pimbblet K. A., 2001, Ph.D. Thesis, University of Durham
- [Rhoads(2000)] Rhoads J. E., 2000, PASP, 112, 703
- [Schlegel, Finkbeiner, & Davis(1998)] Schlegel D. J., Finkbeiner D. P., Davis M., 1998, ApJ, 500, 525
- [Smail, Edge, Ellis, & Blandford(1998)] Smail I., Edge A. C., Ellis R. S., Blandford R. D., 1998, MNRAS, 293, 124
- [Stoughton et al.(2002)] Stoughton C. et al., 2002, AJ, 123, 485
- [Visvanathan & Sandage(1977)] Visvanathan N., Sandage A., 1977, ApJ, 216, 214