High Angular Resolution Measurement of Ion and Neutral Spectra as a Probe of the Magnetic Field Structure in DR21(OH)
Abstract
It has been suggested that under average interstellar field strengths the cyclotron interaction between ions and magnetic fields is strong enough to narrow the linewidth and suppress the line wings in the ion spectra. We present evidence for the cyclotron interaction effect at arcsec scale on the velocity dispersions in the spectra of ion/neutral molecular species in DR21(OH) observed with the OVRO-MMA. Using a spatial resolution 3 times higher than previous CSO observations by Houde et al. (2002), we show that H13CO+ and H13CN are coexistent at the scale of our observations (6′′). In the eastern parts of the DR21(OH) core where the dynamics is simple, the ion linewidths are indeed narrower than the neutral linewidths with an average ion-to-neutral linewidth ratio of 0.820.04. We use our results, along with the existing Zeeman and dust/CO polarization data on small scales, to derive the 3-D magnetic field structure. We obtain a field strength of 0.12 mG with inclination of 36∘ to the line of sight, directed toward the observer, and a position angle of 75∘ in the plane of the sky. With the full magnetic field strength derived here, we are able to conclude that the MM1 core of DR21(OH) is magnetically supercritical; although turbulence provides the dominant support.
1 Introduction
Measurements of magnetic fields in the environment of star forming regions are mostly carried out with observations of Zeeman splitting (Crutcher 1999), the polarimetry of dust continuum (Dotson et al. 2000; Lai et al. 2001, 2002), and the polarimetry of CO emission (Girart et al. 1999; Lai et al. 2003). The Zeeman observations only give the field strength along the line of sight, and the polarimetry of dust continuum and CO emission yield the field direction in the plane of sky. As a result, these observations do not determine the full strength and orientation of the magnetic fields in 3-D. To characterize the magnetic field environment, we need to measure directly the magnetic field strength in the plane of sky . Without direct measurement of the full field strengths, the role magnetic fields play in star formation can only be assessed using indirect estimates of (the Chandrasekhar-Fermi method as used by Lai et al. 2001) and some statistical arguments (Crutcher 1999).
Houde et al. (2002) proposed an interesting new approach to probe the orientation of magnetic fields. Houde et al. (2000a,b) show that in weakly ionized plasma, even under weak fields (G), the cyclotron interaction between the ions and the field can reduce the linewidth and suppress the high velocity wings in the ion spectra when compared to coexistent neutral spectra. Their HCN and HCO+ observations with the Caltech Submillimeter Observatory (CSO) show evidence of these predicted features. Because the ion-to-neutral linewidth ratio depends largely on the inclination angle of the magnetic fields (no cyclotron interaction along the field lines), the full strength and orientation of magnetic fields can be obtained by combining the observations of Zeeman splitting, polarimetry of dust continuum and/or CO emission, and the ion-to-neutral linewidth ratio. Houde et al. (2002) have constructed the 3-D field structure of M17 using this method.
However, it is difficult to interpret the differences in the velocity dispersions of the ion/neutral spectra unambiguously as being caused by the cyclotron interaction, if the beam is large enough to include the spectral line emissions from physically and chemically different components. The intrinsic difference between the velocity structure of the ions and neutrals will also contribute to the ion-to-neutral linewidth ratio. For example, if a velocity gradient exists in a large region with HCN, but HCO+ only coexists with HCN in a small part of this region, the HCN linewidth is naturally larger than the HCO+ linewidth. Therefore, it is important to obtain high spatial resolution spectral line maps to resolve the regions with widely different physical and chemical characteristics.
In this paper, we present the comparison between H13CN and H13CO+ spectra in DR21(OH) observed with the millimeter array of the Owens Valley Radio Observatory (OVRO). DR21(OH) is an excellent object to study the magnetic field structure, because it is in the early stage of massive star formation. DR21(OH) is one of the few sources with measured average line-of-sight magnetic field strength from CN Zeeman detections (Crutcher et al. 1999) and field directions in the plane of sky mapped with BIMA using both dust and CO polarimetry (Lai et al. 2003). Deriving the full strength and 3-D structure requires knowledge of the inclination angle of the magnetic field to the line of sight, which can be obtained by measuring the ion-to-neutral linewidth ratio.
2 Observations and Results
The observations were made with the OVRO Millimeter Array at 3mm in the Compact, Low, and High resolution array configurations between October 2002 and May 2003. We obtained simultaneously spectral line images of HCN & HCO+ and H13CN & H13CO+; 13CS and N2H+ were observed in the opposite sidebands. The synthesized beam is 6.4′′6.9′′ for natural weighting and spectral resolutions are 0.434 km s-1. Among these images, the HCN and HCO+ spectra show features of optically thick emission with strong self-absorption; N2H+ has a very different spatial distribution compared to other species; H13CN, H13CO+, and 13CS have a similar spatial distribution, but 13CS has a different velocity structure from the other two. Therefore, H13CN and H13CO+ are the only neutral/ion pair that can be used to examine the cyclotron effect in our data.
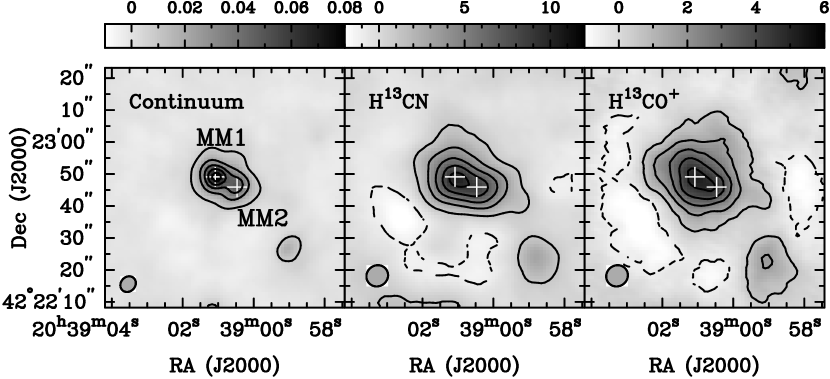
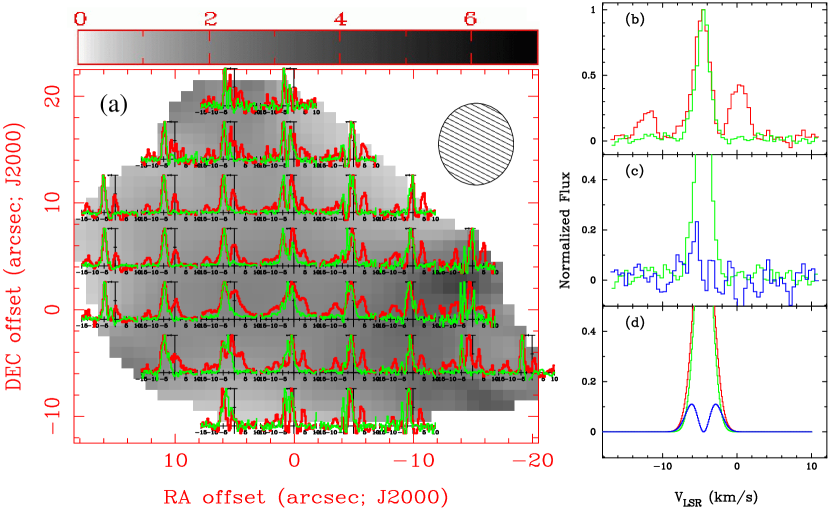
Figure 1 shows the 3mm continuum and the integrated flux of H13CN and H13CO+. The two compact cores in DR21(OH), MM1 and MM2, are resolved. H13CN and H13CO+ both trace the dense cores very well. H13CO+ is slightly more extended than H13CN, which is probably due to the lower critical density of H13CO+. Therefore, H13CN and H13CO+ seem to occupy the same volume. Figure 2 shows the normalized H13CN and H13CO+ spectra overlaid on their flux ratio map. Note that H13CN has three hyperfine lines with intensity ratios of 1:5:3 for the optically thin case. The spectra show that DR21(OH) contains two dominant velocity components – one at km s-1 and the other at km s-1, which are likely to be associated with MM1 and MM2, respectively. At the positions between MM1 and MM2, the spectra are more complex and may contain an absorption feature at 2.5 km s-1. Overall, the spectra of H13CN and H13CO+ trace each other well, which is strong evidence for the coexistence of H13CN and H13CO+, as also suggested by their spatial intensity correlation.
A difference in the ion/neutral linewidth can arise in some cases from chemical inhomogeniety, especially, if multiple velocity features are present. In Figure 2 we show the distribution of the H13CN-to-H13CO+ flux ratio (in greyscale) which is a measure of the chemical differentiation in the core. We can safely discard the effects of chemical differentiation by excluding regions where the flux ratio changes appreciably over the small spatial scale sizes of the OVRO beam. However, chemical differentiation alone will not always cause linewidth differences. The velocity structure of the region also needs to be considered. For example, if the velocity structure is uniform across the cores such that the shape and the central velocity of the spectra stay the same, any local variation in the ion-to-neutral flux ratio will result in a weighting factor that affects only the line intensities, not the ion-to-neutral linewidth ratios for the whole core. However, in DR21(OH) at least two velocity components are detected and therefore, it is critical to isolate the regions with different dynamics when interpreting the ion-to-neutral linewidth ratio as the cyclotron effect. We see a large variation in their flux ratio (by factors of 0.5 to 4) over the entire region, but it appears to be smooth except near the southwest parts of the core. In the eastern parts of the core the variation in the flux ratio is small, and the fully resolved velocity structure is dominated by a single feature. Thus, in this region of DR21(OH), we are able to minimize any contribution to the ion/neutral linewidth differences arising from chemical inhomogeneity. In our analysis we do not include the southwest region where rapid and significant variation of ion-to-neutral flux ratio is observed. Furthermore, the ion/neutral spectra in the southwest region have low S/N.
In the eastern part of MM1 where the 5 km s-1 component dominates and the spectral line shapes are better defined, we can see that H13CO+ is slightly narrower than H13CN. To eliminate the complication of the H13CN hyperfine lines, we simulate H13CN spectra with all three hyperfine lines using the H13CO+ as a ‘template’. For the case of a single velocity component, if the linewidth of H13CN is smaller than half of the velocity separations between hyperfine lines, the difference spectrum between the observed H13CN and that simulated from H13CO+ is largely free from the confusion caused by the hyperfine components and thus is a useful measure of the cyclotron interaction. If indeed H13CN has larger linewidths than H13CO+, the difference spectra will have two positive peaks near the wings of the line profile as demonstrated in Figure 2d. As the line shapes of H13CN and H13CO+ are approximately Gaussians, the integration of the difference spectra over the extent of the main hyperfine component gives a measure of the difference of the dispersions in the spectra.
| (1) |
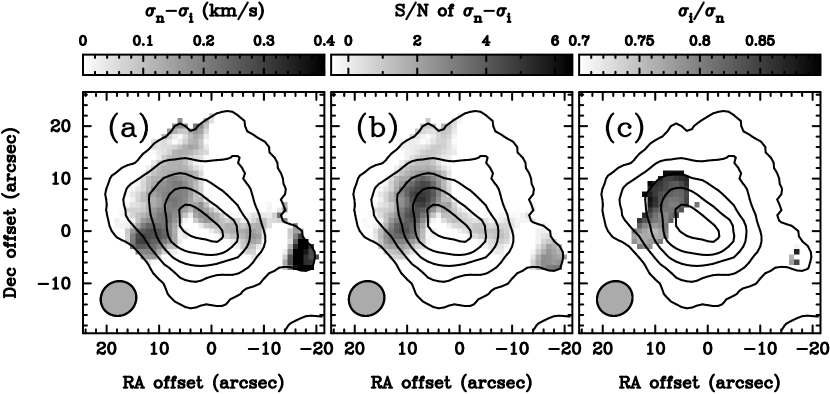
where and are the normalized H13CN and H13CO+ spectra and and are the dispersions of H13CN and H13CO+, respectively. Figure 3a shows the map of which is calculated by integrating the difference spectra over the km s-1 component ( to km s-1). These estimated using Eq(1) are in good agreement (within 10%) with those obtained by fitting Gaussians to the observed H13CN and H13CO+ line profiles at (+10′′, +5′′). The signal-to-noise ratio (S/N) of is presented in Figure 3b. We use and measured from H13CO+ spectra to derive in Figure 3c. It is evident from the results shown in Figure 3 that in the eastern side of MM1 the ion linewidth is smaller than the neutral linewidth. We do not present similar analysis for the km s-1 component, because of the low S/N of .
3 Discussion
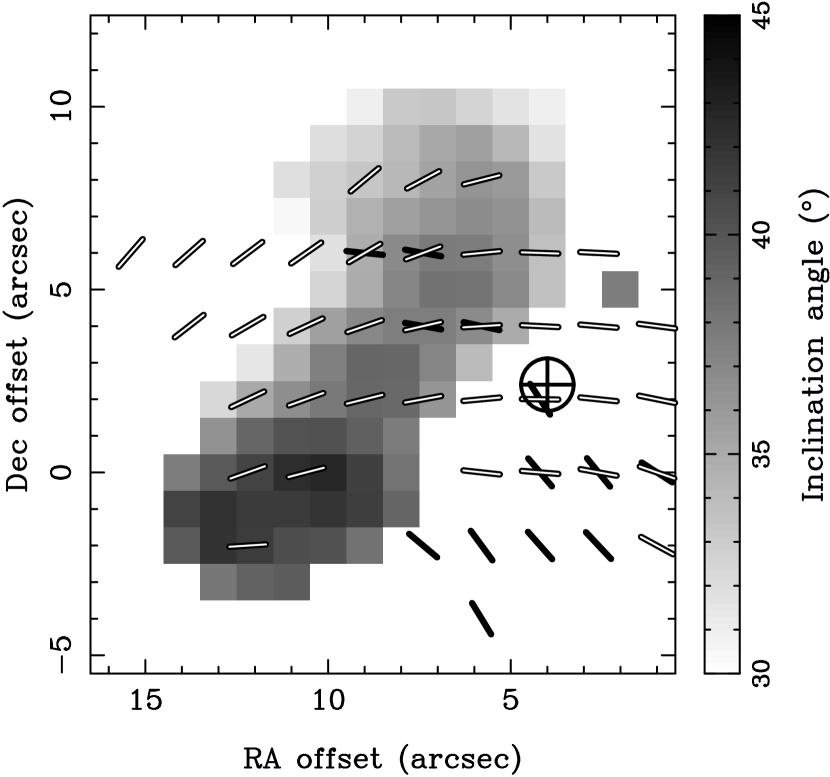
The interferometer observations with OVRO have the advantage to resolve the velocity and chemical structures in the DR21(OH) core with high spatial resolution. In the eastern parts of DR21(OH) our observations show that H13CN and H13CO+ coexist over 15′′10′′ in a single velocity feature and confirm that the ion line is indeed narrower than the neutral line. We use the ion-to-neutral linewidth ratio shown in Figure 3c to infer the inclination angle of the magnetic field to the line of sight () according to Equation (11) of Houde et al. (2002). To derive the value of () using the ion/neutral linwidth ratio we require knowledge of the gas motions within the core. Houde et al. consider the cases with neutral flow collimation widths, , (∘ means no collimation as in a purely turbulent case). For a given value of a range of values for are possible depending on the values for flow collimation widths (see Figure 4 in Houde et al.). For example the average ion-to-neutral linewidth ratio, of 0.82 will correspond to an inclination angle = 76∘, 60∘and 36∘ for =20∘, 45∘and 90∘ respectively. The dependence of the estimates for on is less critical for 90∘, a case when turbluent motions dominate over collimated flows. Although MM1 in DR21(OH) does power high velocity CO outflows (Lai et al. 2003), there is no evidence that the spectra of ions and neutrals observed at the rest velocity of the cores are contaminated by collimated flows. Therefore, to derive the magnetic field inclination, we have ignored collimated flows and we assume the gas is fully turbulent (∘). Figure 4 shows the inclination angle ranges from 30∘ in the northern part of MM1 to 42∘ in the south, and the uncertainty in is 4–8∘. The variation in is small (12∘) and is comparable to the variation of the overlaid vectors derived from the dust polarization (black) and CO polarization (white). Therefore, the magnetic field directions seem to be approximately uniform across the MM1 region. The average line-of-sight magnetic field strength in MM1 0.360.10 mG as measured by CN Zeeman observations (Crutcher et al. 1999). With the average ∘, the field strength in the plane of sky () is 0.250.07 mG, and the full magnetic field strength is 0.12 mG. The direction of the field is out of the plane of the sky towards the observer at an angle of 36∘to the line of sight, and its projection on the sky is at a position angle ∘.
Lai et al. (2003) estimate 0.9 mG for MM1 from the observed dispersion in the CO polarization position angles using the Chandrasekhar-Fermi formula. This value is a factor of 3 larger than what is derived from the cyclotron interaction data presented here. This discrepancy could be partly due to the low values for the dispersion caused by the smoothing of polarization by the finite beam size of the BIMA observations. Also, the ‘calibration factor’ of the Chandrasekhar-Fermi formula (0.5) used by Lai et al. (2003) is an average value of clouds in numerical simulations (Ostriker, Gammie, & Stone 2001), which may not be a proper value DR21(OH).
With the knowledge of the full magnetic field strength, we can evaluate the role that magnetic fields play for star formation in MM1. First, we can calculate the mass-to-magnetic flux ratio from in units of the critical mass-to-flux ratio (Crutcher 1999), where is the column density in cm-2 and is the field strength in G. With cm-2 and B=0.44 mG, 4.5. Therefore, MM1 is clearly magnetically supercritical. However, turbulence seems to provide dominant support. The H13CO+ linewidth ( 2.2 km s-1) is much larger than its thermal linewidth for =50 K (0.3 km s-1), indicating strong turbulence in DR21(OH). The relative importance of magnetic, thermal, and turbulent support can be evaluated by comparing their energy to the gravitational energy. We find that in MM1 the magnetic-to-gravitational energy ratio is 0.05, the thermal-to-gravitational energy ratio is 0.16, and the turbulent-to-gravitational energy ratio is 0.66. Therefore, turbulence provides the dominant support in MM1. Although our conclusion on the status of MM1 is similar to what has been suggested by Crutcher et al. (1999) with statistical argument for the full magnetic field strength, our results exclude the possiblity of the magnetic field dominance which may be true only if the field orientation in 3-D is very close to the plane of the sky.
References
- (1) Crutcher, R. M. 1999, ApJ, 520, 706
- (2) Crutcher, R. M., Troland, T. H., Lazareff, B., Paubert, G., & Kazès, I. 1999, ApJL, 514, L121
- (3) Dotson, J. L., Davidson, J., Dowell, C. D., Schleuning, D. A., & Hildebrand, R. H. 2000, ApJS, 128, 335
- (4) Girart, J. M., Crutcher, R. M., & Rao, R. 1999, ApJL, 525, L109
- (5) Houde, M., Bastien, P., Peng, R., Phillips, T. G., & Yoshida, H. 2000a, ApJ, 536, 857
- (6) Houde, M., Peng, R., Phillips, T. G., Bastien, P., & Yoshida, H. 2000b, ApJ, 537, 245
- (7) Houde, M., Phillips, T. G., Bastien, P., Peng, R., & Yoshida, H. 2001, ApJ, 547, 311
- (8) Houde, M. et al. 2002, ApJ, 569, 803
- (9) Lai, S.-P., Crutcher, R. M., Girart, J. M., & Rao, R. 2001, ApJ, 561, 864
- (10) Lai, S.-P., Crutcher, R. M., Girart, J. M., & Rao, R. 2002, ApJ, 566, 925
- (11) Lai, S.-P., Crutcher, R. M., & Girart, J. M. 2003, ApJ, in press
- (12) Ostriker, E. C., Stone, J. M., & Gammie, C. F. 2001, ApJ, 546, 980