On the Evidence for Clustering in the Arrival Directions of AGASA’s Ultrahigh Energy Cosmic Rays
Abstract
Previous analyses of cosmic rays above eV observed by the AGASA experiment have suggested that their arrival directions may be clustered. However, estimates of the chance probability of this clustering signal vary from to and beyond. It is essential that the strength of this evidence be well understood in order to compare it with anisotropy studies in other cosmic ray experiments. We apply two methods for extracting a meaningful significance from this data set: one can scan for the cuts which optimize the clustering signal, using simulations to determine the appropriate statistical penalty for the scan. This analysis finds a chance probability of about . Alternatively, one can optimize the cuts with a first set of data, and then apply them to the remaining data directly without statistical penalty. One can extend the statistical power of this test by considering cross-correlation between the initial data and the remaining data, as long as the initial clustering signal is not included. While the scan is more useful in general, in the present case only splitting the data set offers an unbiased test of the clustering hypothesis. Using this test we find that the AGASA data is consistent at the level with the null hypothesis of isotropically distributed arrival directions.
keywords:
Ultrahigh Energy Cosmic Rays; Anisotropy of Cosmic Rays; Extensive Air Shower ArraysPACS:
95.85.Ry , 96.40.Pq , 98.70.-f , 98.70.Sa1 Introduction
The study of arrival directions of cosmic rays above eV (ultrahigh energy cosmic rays) is one of the most promising ways to gain insight into the origin of these particles. While a number of experiments have shown that the distribution of arrival directions is remarkably isotropic, evidence for small-angle clustering has been claimed, most notably by the AGASA [1] (Akeno Giant Air Shower Array) cosmic ray experiment [2, 3, 4, 5, 6, 7]. This clustering signal, if confirmed, would give strong support to the idea that cosmic rays originate from compact sources [8].
The focus on small-angle anisotropies among the very highest energy events is well-motivated: if the cosmic ray particles are charged, then the highest energy ones are expected to suffer the smallest deflections while traversing Galactic and extragalactic magnetic fields. Their arrival directions are therefore the most likely ones to point back toward sources.
A search for clustering among the highest energy cosmic ray events must make choices for the minimum energy which defines the data set and the maximum angular separation which defines a pair. On the one hand, choosing a higher energy threshold should reduce deflections and allow clusters to show up within smaller angular separations . This holds especially for a detector such as AGASA in which the angular resolution improves at higher energies. On the other hand, as a function of energy the cosmic ray flux drops faster than , so the statistical power of the available data quickly weakens with higher energy thresholds.
For a precise model of cosmic ray source distributions and Galactic and extragalactic magnetic fields, these competing forces would imply optimal choices for and to maximize the clustering signal. At present, however, not nearly enough is known about any of these to make a priori choices useful. Instead, what is done explicitly or implicitly is to scan over a range of values for and , and identify the values which maximize the clustering signal. In this case, the final significance of the result must include a penalty factor for the a posteriori cuts arrived at by scanning.
It is the various ways of handling this penalty factor—or, in some cases, the failure to include it at all—which has led to a wide range of significances attached to the AGASA clustering signal.
Evaluating this significance rigorously is crucial for understanding the anisotropy results of new cosmic ray experiments. The world data set of detected cosmic ray particles above eV is currently dominated by the events observed by AGASA, which has been operated continuously since 1990. In the near future, a statistically independent data set from the currently operating HiRes [9] (High Resolution Fly’s Eye) air fluorescence detector will become available, and in the more distant future, the Pierre Auger Array [10] is expected to produce an even larger data set of ultrahigh energy cosmic rays.
To compare the anisotropy results of AGASA and these new experiments, the strength of the AGASA clustering signal must be well understood. We apply two methods for evaluating its significance. The first is a general method, applicable to upcoming searches by other experiments as well; the second is a specific test of the clustering hypothesis which is meaningful only in the context of the AGASA data set.
First, we propose that a clustering signal among the highest energy events can be best evaluated by scanning simultaneously over energy thresholds and angular separations to find the values for and which optimize the signal. The chance probability of the signal is determined by counting the number of simulated data sets which yield a stronger signal under an identical scan. With this procedure, the statistical significance is determined without treating a posteriori cuts as a priori ones.
As will be shown later, however, a bias remains in the case of the AGASA data set due to the inclusion of the events that led to the clustering hypothesis in the first place. One can avoid this bias by removing the early data and only scanning over the events which have been detected since the original claim. Alternatively, one can test the AGASA clustering hypothesis by applying the original cuts to the newer events directly. Since the cuts are now a priori, this test requires no statistical penalty. It has the virtues of being simple and rigorously unbiased.
The paper is organized as follows. In Section 2, we summarize previous estimates of the significance of the AGASA clustering signal and motivate the need for a re-analysis. In Section 3, we motivate and describe the autocorrelation scanning technique applied in our analysis. In Section 4, we perform this scan on the published AGASA data set and compare the result with previous estimates of the significance. In Section 5, we address the bias introduced by using the whole data set, and perform an analysis using only the unbiased event set. To increase the statistical power of this test, we also include the effect of cross-correlation between the original and the unbiased event sets. We present our conclusions in Section 6.
2 Small Scale Clustering in AGASA Cosmic Ray Data
The AGASA experiment reported possible clustering in the arrival directions of ultrahigh energy cosmic rays as early as 1996 [2], and has updated this data sample and analysis in several publications [3, 4, 5, 6]. The first report of clustering in 1996 identified three pairs of events with angular separation less than among the 36 events with energies above eV. The corresponding chance probability was found to be 2.9%. It was noted that the angular separation of is “nearly consistent with the measurement error ()” [2]. The minimum energy of eV was justified under the assumption that the Greisen-Zatsepin-Kuzmin (GZK) cutoff [11, 12] should lead to an accumulation of events around eV, and therefore that events above this energy may point back to nearby sources. The values for and identified in this report set the stage for all analyses which followed.
In 1999, a new publication by AGASA [3] identified a stronger clustering signal using these cuts with an enlarged data set now containing 47 events. The following year, AGASA published an updated list with 57 events above eV observed through May, 2000 [4]. There is also an additional event below eV which was added to the list because it forms another doublet.111 This is an unfortunate source of confusion. Like many authors, we do not include this extra event in our analysis because it is not clear how many additional events there are between it and eV. However, it is sometimes included in other authors’ analyses to which we refer. Not counting the extra event, there are four doublets and one triplet in this set.
This set was analyzed by Tinyakov and Tkachev [8], who calculated the chance probability as a function of the threshold energy of the data set, while keeping the angular bin size constant at . The lowest probability was found to be less than with eV. Since this probability was obtained by scanning over energies, it does not reflect the true significance of the clustering signal. To estimate the correct chance probability, the authors numerically calculated a correction factor by generating random sets of events which were then subjected to the same scanning in . 27 (3) random samples had a probability of less than (), and the authors concluded that the correction factor was of order 3. The final chance probability was given as , considerably lower than the chance probability reported by the AGASA collaboration in the original publications [2, 3].
A similar scan was then performed in the size of the angular bin, i.e. the maximum angular distance between events that defines a cluster. The probability shows a minimum at , but since this was interpreted as the angular resolution of the experiment, no correction factor was applied to the final chance probability.
In [5] in 2001, the AGASA group applied this scanning technique again to a data set which was now reported to include 59 events above eV—essentially the same data set as the one published in 2000 [4], though it is unclear whether the one event below the energy cutoff was kept, or whether one or two new events were added. Five doublets and one triplet were reported in the sample. A scan over angular separations was again performed, showing the peak at . Performing a scan over energies, the significance of the clustering above eV was said to be , and above eV it was said to be in excess of . No statistical penalties were applied for either the energy or angular separation scan.
The most recently published study by AGASA [6] in 2003 recapitulates much of the above analysis. The same 59 events are analyzed, though the AGASA experiment has continued to observe ultrahigh energy cosmic rays and has reported 72 events above eV seen through the end of July, 2002 [7]. Forgoing a scan over energies, the chance probability for all of the clusters (one triplet + five doublets = eight pairs) in the total set of 59 events is simply reported to be less than .
In evaluating the significance of the clustering signal, it is essential to determine whether the original choices of eV and were a priori.
We consider what would have been required to formulate such an a priori hypothesis. In the case of the angular resolution of the experiment, Monte Carlo simulations can be used to determine the optimal angular size for a cluster search. Such a study needs to take into account that the angular resolution for a ground array depends on a variety of factors. For the AGASA detector, the angular error continues to shrink with increasing energy. At eV, AGASA reports [3]. Eight of the 57 events in the data set are in fact above this energy.
In addition, the angular resolution of ground arrays depends on the alignment of the shower with the detector array. In general the errors will be asymmetric. In [3], AGASA reports on the accuracy of the arrival direction determination by showing the opening angle distribution between simulated and reconstructed arrival directions. The ratios of the 68 % and 90 % opening angles shown in [3] are clearly not those of a circular, two-dimensional Gaussian distribution. These complications mean that standard formulae do not apply and the optimal angle for a cluster search cannot be stated simply as .
Furthermore, the search angle which optimizes the clustering signal will also depend on the expected background of chance clusters. For small data sets, the chance occurrence of a pair is small, and the signal to noise ratio can be optimized with a larger separation angle in the search [13].
In summary, a clustering search which is a priori should begin by first using a Monte Carlo simulation to identify the optimal opening angle size. The first clustering paper [2] gives no indication that such a search program was undertaken, nor does it claim that is an a priori choice. It merely observes that the clustering signal is strongest for , a value which coincides to some extent (but only approximately, as ) with the angular resolution of the experiment around the given energy. This makes the value interesting, but not a priori.
We motivated the scan over threshold energies in Section 1 on physical grounds. Here, we note that the original paper [2] does not restrict the analysis to eV, but mentions at least two other energy thresholds that were looked at as well ( eV and eV). This approach is certainly valid, for the reasons we mentioned earlier. However, it does not constitute an a priori search program, which demands a choice for and prior to examination of the data. Because the values of and are determined by examining the data, a calculation of the a priori probability does not represent the true significance of the observation. Either the cuts must be tested with independent data, or the statistical penalty must be evaluated and included in the calculation of the chance probability.
3 Scanning and Evaluation of Chance Probability
The competition between magnetic deflections and statistical power described earlier offers one motivation for scanning over small angles among the highest energy events to locate a signal. Scanning is especially well motivated in the case of AGASA, where the energy dependence of the angular resolution means that clustering can be better resolved at higher energies.
In our analysis, we perform a scan simultaneously over energy thresholds and maximum separation angles to find the and which maximize the clustering signal, and then we perform identical scans over simulated data sets to evaluate the true significance.
In practice, rather than scanning directly over energy thresholds, we rank the events by energy and scan over events . That is, for each value of and , we restrict ourselves to the highest-energy events, and count the number of pairs separated by less than . Just as in the usual two-point correlation function, multiplets are counted by the individual number of pairs which they contain. A triplet of events, for example, will be counted as two or three pairs, depending on the individual separations of the three events.
Prior to scanning the data, we generate a large number () of simulated data sets with the same exposure as the detector, and use them to generate a table of values , where is the fraction of sets in which the first events contain exactly pairs separated by less than .
For each , the number of pairs is counted in the data, and the probability for observing or more pairs at is calculated as:
| (1) |
For some combination , has a minimum: . This identifies the location in the scan of the strongest potential clustering signal. To assess the true significance of this signal, we perform the same scan over Monte Carlo data sets, identifying the minimum probability for each trial and counting the number of trials for which .
The chance probability of observing in the scan is finally evaluated as:
| (2) |
This scanning technique is essentially an auto-correlation analysis in which the angular size of the first bin and the energy threshold of the data set are varied to maximize the signal, and the final significance includes the correction factor for the scan over both variables.
4 Autocorrelation Scan of the AGASA Data Set
We perform this scan on the published AGASA data above eV, which consists of 57 events [4]. To generate Monte Carlo events for determining the probabilities, we follow [8] in using a zenith angle () distribution , corresponding to geometric acceptance of isotropically distributed cosmic ray arrival directions. We use the same cut as employed by AGASA, and assign uniformly random arrival times, corresponding to the uniform exposure of AGASA in right ascension [4, 5]. We scan over angular separations from to in increments of . The results of the scan are shown in Figure 1.
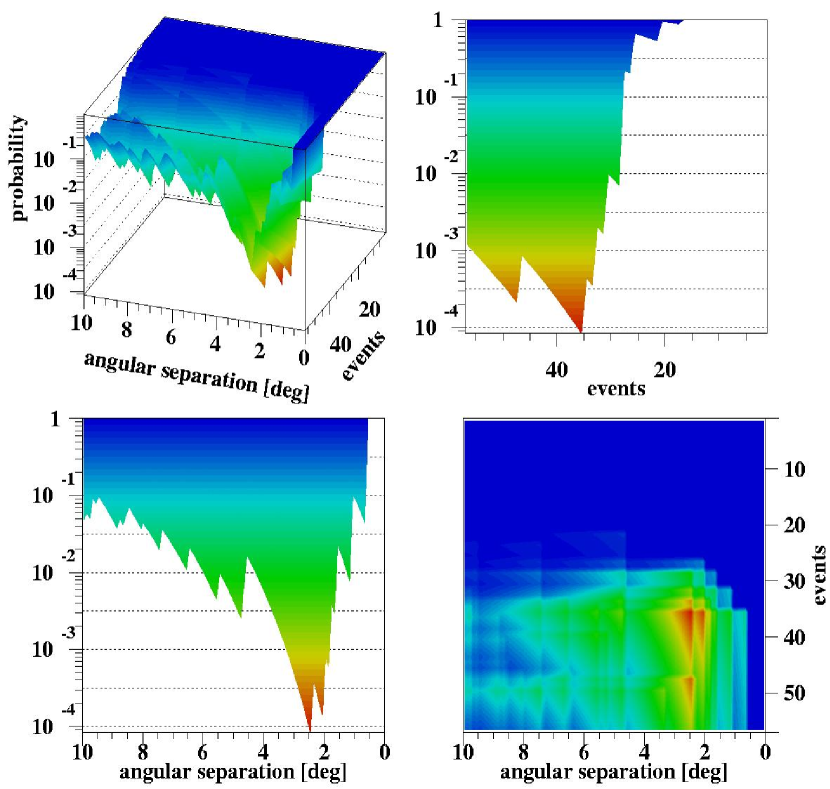
The strongest clustering signal is contained within the highest-energy events, where there are pairs separated by less than . (The energy threshold corresponding to this subset is eV.) At this spot , that is, 839 out of MC data sets had the same or greater number of pairs at the same values for and . This value for (not ) is essentially the same as the probability found by Tinyakov and Tkachev [8] for the same energy threshold and angular separation.
To evaluate the significance of this result, we perform the same scan over simulated AGASA data sets and count how many simulated sets have . We find that 3475 out of simulated sets meet this condition, implying a chance probability of . Figure 2 illustrates how varies as a function of for the simulated AGASA sets.

In performing the data scan and the simulated scans, it is necessary to choose four parameters which can affect the final result: , the total number of events included in the scan; and , the angular extent of the scan; and , the size of the angular binning. In Table 1 we show a range of values for these parameters and the effect on the final value of . We motivate our choices for each of the parameters as follows:
In choosing the extent of the scan in and , it is clear that the significance would be biased if one scanned out precisely to the maximum clustering signal and no further. An investigator who reports a clustering signal in a scan can reasonably be expected to have scanned out at least twice as far in search of an even stronger signal; hence a reasonable estimate of should extend to , and further, if is very small. The same can be said for with respect to . As for , it should be no larger than the best attainable angular resolution; in the present case, one could choose or with little effect on the final probability. Finally, it can be seen in Table 1 that reducing the angular bin size also has a negligible effect at small scales.
| 57 | ||||
|---|---|---|---|---|
| 36 | ||||
| 100 | ||||
| 57 | ||||
| 57 | ||||
| 57 | ||||
| 57 | ||||
| 57 | ||||
| 57 |
We note that over each of the ranges shown in Table 1—a factor of three in event number, a factor of 16 in angular area, and a factor of 25 in angular binning—the chance probability remains within to . Therefore our result does not depend sensitively on these scanning parameters.
The value of we calculate for is 10 times larger than that calculated by Tinyakov and Tkachev in [8]. Although they use an angular scan to demonstrate that the separation angle maximizes the signal, they nevertheless treat the choice as an a priori one and make no correction for it.
In [5], the AGASA collaboration analyzes the same data set and finds that at eV the significance of the clustering signal is , and that at a slightly higher energy threshold it is “ or more”. These results imply chance probabilities of and , respectively—three to four orders of magnitude lower than the probability we have presented here. This overestimation of the significance of the clustering signal arises in part from the application of Gaussian statistics to a non-Gaussian distribution: these significances are obtained by measuring the excess clustering signal in units of standard deviations, , when in fact this distribution is not Gaussian for the small numbers of clusters observed. Having cited Tinyakov and Tkachev [8] and made use of their technique, the authors ignore their warning on exactly this point. Furthermore, they ignore the statistical penalty involved in scanning over energy thresholds, and they do not consider a penalty for the choice of angular separations.
5 Unbiased Test of AGASA Clustering Hypothesis
A more rigorous statistical test of the clustering hypothesis can be performed by isolating the data which led to the original cuts of eV and . Since these values are justified a posteriori in conjunction with the observation in 1996 that they lead to a clustering signal [2], they can only be treated as a priori for a data set independent of the one which was used to derive them. We can do this by dividing the AGASA data into an “original data set” comprising the events observed through October 1995 which formed the basis of the original clustering claim, and a “new data set” comprising the events which have been observed since then. Using the list of events published in 2000 [4], there are 30 events in the original set and 27 in the new one. 222In [2] (1996), the original data set is said to contain 36 events above eV. However, the lists [3, 4] published in 1999 and 2000 contain only 30 events during this same time period, due to a reevaluation of the energies (according to Uchihori et al. [14]). The three original clusters are present in all sets.
Because the new data set is independent, we can test the original clustering hypothesis directly without the need for any statistical penalties. We simply count the number of pairs of events using eV and , and we find one pair. The chance probability for one or more pairs among 27 events is 28%.
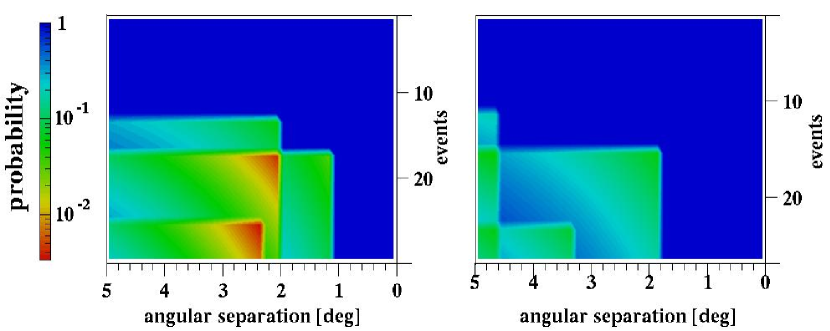
We can investigate whether there is a better choice of and for the new data set by performing an autocorrelation scan. Figure 3 shows the results of scanning over both the old and new data sets separately. The strongest clustering signal in the original set has a chance probability and occurs for and eV (with 3 pairs among the 26 highest energy events, and a minimum probability in this bin). This confirms that the cuts originally selected in 1996 were nearly optimal for that data set. However, when the new events are scanned, there is no hint of clustering at the scale or any other angular separation. The “strongest” clustering signal occurs at with .
The independent data set has less statistical power than the total data set. If we estimate that power by counting the number of all possible pairs (1596) among 57 events, then we find that the original data set contains 27% of those pairs, the independent set contains 22%, and the remaining 51% are “cross” pairs between events in the original and new data sets. If we are careful to avoid contamination by the original cuts, then we can extend the statistical power of this test by including the cross-correlation with the original set.
To do this without contamination by the initial cut obtained from the original data set, we replace each of the three doublets in the original set with a single event at each of their averaged positions. We then count the number of autocorrelation pairs in the independent set, and we now add the number of cross pairs between events in the independent and original data sets. There is one auto pair, as before, and there are two cross pairs. To estimate the chance probability, we generate Monte Carlo data sets of 27 events to replace the independent data set, while holding the original set fixed. We count what fraction of these trials have the same or greater number of auto- and cross-correlation pairs. The chance probability for a total of three or more pairs is found to be 8%. 333 The unbiased test can be extended to include two more years of data since May 2000 which has been summarized on the AGASA web page [7]. There are a total of 72 events above eV through July 2002, which means the independent set has 42 events and roughly double the statistical power as before. This set adds one new autocorrelation pair to the one already present, and no new cross-correlation pairs. Performing the same analyses as described in the text, the chance probability for two pairs within the independent set of 42 events is 19%. The chance probability for a total of four pairs—within the independent set, and between the independent and original sets—is 12%.
We observe that if the cuts had been a priori for the first data set, the chance probability for the three pairs among the first 30 events would be 0.8%. Thus it is the clustering in the first data set which dominates the significance for the total set, despite the fact that the first set by itself represents only a fraction of the total number of possible pairs. This is precisely what is to be expected when a small initial set is used to optimize the cuts.
If we had not modified the initial data set by replacing the doublets with their average positions, then there would have been three cross pairs in the above test, instead of two. The difference is due to the events which form the AGASA triplet. The chance probability for four or more total pairs in this test would have been 3% rather than 8%. Unfortunately, since it was these doublets in the first set which made the cut optimal, they cannot be included in a statistically independent test of the hypothesis. In any case, even this biased test confirms that the significance is dominated by the initial data set.
6 Conclusions
Taken at face value, an autocorrelation scan of the published AGASA data set finds a chance probability around for the clustering signal claimed previously. At this level, the observed clustering could be a hint of real small-scale anisotropy, or it could well be a chance fluctuation in an isotropic distribution. To investigate the possibility that it is a fluctuation, and that the significance of the scan is artificially high because it includes the data which led to the clustering hypothesis in the first place, we test the original claim while excluding the contribution of the original data to the clustering signal. First we form an independent data set using only the AGASA events observed after the claim. The cuts which were identified originally can now be applied a priori in an unbiased test. To increase the statistical power of the test, we include cross-correlations with the original data. Replacing the doublets in the original set with single events to keep this test independent of the original clustering signal, we find a chance probability of 8%.
We conclude that the evidence for clustering in the AGASA data set is weaker than has sometimes been claimed, and in fact is consistent with the null hypothesis of isotropically distributed arrival directions at the 8% level. This conclusion is of course not exhaustive of all the possible anisotropies that can be studied. For example, in [14] it was observed (using a combination of data from AGASA and earlier cosmic ray experiments) that the significance of the clustering increases when the field of view is restricted to within of the supergalactic plane. The authors were careful to note that the probability () of this occurrence is a posteriori, and therefore not indicative of the true significance. Nevertheless, intriguing observations such as these make the need for testing with independent data abundantly clear. It is quite possible that with the increased statistics and improved angular resolution of experiments like HiRes and the Pierre Auger Array, previous claims will be decisively tested, and compelling evidence for anisotropy may yet be found.
References
- [1] N. Chiba et al., Nucl. Instr. Meth. A 311 (1992) 338.
- [2] N. Hayashida et al., Phys. Rev. Lett. 77 (1996) 1000.
- [3] M. Takeda et al., ApJ 522 (1999) 225.
- [4] N. Hayashida et al., astro-ph/0008102 (2000).
- [5] M. Takeda et al., Proceedings Int. Cosmic Ray Conference (ICRC), Hamburg (2001) 345.
- [6] M. Teshima et al., Proceedings Int. Cosmic Ray Conference (ICRC), Tsukuba (2003) 437.
- [7] http://www-akeno.icrr.u-tokyo.ac.jp/AGASA/results.html
- [8] P.G. Tinyakov and I.I. Tkachev, JETP Lett. 74 (2001) 1 (astro-ph/0102101).
- [9] http://hires.physics.utah.edu/
- [10] http://www.auger.org/
- [11] K. Greisen, Phys. Rev. Lett. 16 (1966) 748.
- [12] G.T. Zatsepin and V.A. Kuzmin, Zh. Eksp. Teor. Fiz 4 (1966) 114.
- [13] D.E. Alexandreas et al., Nucl. Instr. Meth. A 328 (1993) 570.
- [14] Y. Uchihori et al., Astropart. Phys. 13 (2000) 151.