Ultraviolet Background Radiation from Cosmic Structure Formation
Abstract
We calculate the contribution to the ultraviolet background (UVB) from thermal emission from gas shock heated by cosmic structure formation. Our main calculation is based on an updated version of Press-Schechter theory. It is consistent with a more empirical estimate based on the observed properties of galaxies and the observed cosmic star formation history. Thermal UVB emission is characterized by a hard spectrum extending well beyond 4 Ry. The bulk of the radiation is produced by objects in the mass range , i.e. large galaxies and small groups. We compute a composite UVB spectrum due to QSO, stellar and thermal components. The ratio of the UVB intensities at the H and He Lyman limits increases from 60 at to more than 300 at . A comparison of the resulting photoionization rates to the observed Gunn-Peterson effect at high redshifts constrains the escape fraction of ionizing photons from galaxies to be less than a few percent. Near 1 Ry, thermal and stellar emission are comparable amounting to about 10 %, 20 % and 35 % of the total flux at redshifts of 3, 4.5 and higher, respectively. However, near the ionization threshold for He , the thermal contribution is much stronger. It is comparable to the QSO intensity already at redshift and dominates at redshifts above 4. Thermal photons alone are enough to produce and sustain He reionization already at . We discuss the possible implications of our results for the thermal history of the intergalactic medium, in particular for He reionization.
keywords:
cosmology: large-scale structure of universe — radiation mechanism: thermal — shock waves1 Introduction
Neutral hydrogen in the intergalactic medium (IGM) produces a forest of resonant Ly absorption lines in the spectra of high-redshift quasars. The connection of these features to the structure formation process has now been now firmly established using N-body/hydrodynamic numerical simulations (Cen et al., 1994; Zhang et al., 1995; Miralda-Escude et al., 1996). There is consensus that the observed IGM temperature results from a balance between photo-ionization heating and adiabatic cooling due to the Hubble expansion. Such photo-heating is provided by the extragalactic ultraviolet background (UVB) whose nature, origin and evolution have, therefore, been subject to considerable investigation.
At low redshifts, the ionization balance is consistent with a pure power-law ionizing spectrum. Traditionally QSOs have considered as the main sources of ionizing photon. However, a number of recent theoretical and observational developments are at odds with this. Kim et al. (2001) find that the break in the redshift evolution of absorbers occurs at lower redshifts than predicted by numerical simulations using a standard QSO ionizing background (Haardt & Madau, 1996), hinting at an incomplete description of the UVB. This led Bianchi et al. (2001, B01 hereafter) to recompute the UVB as a superposition of contributions from QSOs and galaxies. Those authors adopted an escape fraction of ionizing photons from galaxies, . In spite of many theoretical (Dove et al., 2000; Wood & Loeb, 2000; Haehnelt et al., 2001; Ciardi et al., 2002) and observational studies (Leitherer et al., 1995; Heckman et al., 2001; Steidel et al., 2001) the determination of this parameter remains highly uncertain. In §3.3 below we use recent measurements of the Gunn-Peterson effect in high redshift quasars (Becker et al., 2001; McDonald & Miralda-Escudé, 2001; Fan et al., 2002) to argue for values of as small as a few % for high redshift galaxies (§3.3), in agreement with independent estimates by Fernández-Soto et al. (2003). These authors set a 3 (statistical) upper limit % using photometry of 27 spectroscopically identified galaxies with in the Hubble Deep Field.
Similarly, high resolution simulations using a standard cold dark matter model and a standard QSOs ionizing background (Haardt & Madau, 1996), produce a Ly- forest lines with a minimum width significantly below that observed (Theuns et al., 1998a; Bryan et al., 1999). This appears to require additional heat sources, for example photo-electric dust heating (Nath et al., 1999), radiative transfer effects (Abel & Haehnelt, 1999), or Compton heating by X-ray background photons (Madau & Efstathiou, 1999).
The situation around redshift is more complicated. Apparently the spectrum must be very soft, with a large break at the edge. Songaila (1998) reports an abrupt change of the ratio at . This may indicate a rapid and significant change in the shape of the ionizing spectrum, perhaps due to He reionization. This is corroborated by the detection of patchy He Ly absorption at similar redshifts. In addition, Heap et al. (2000) analyzed the Gunn-Peterson He II absorption trough at found the UVB to be characterized by a high softness parameter111Note that is defined as the ratio of the photoionization rate in H over the one in He (§3.2). , in contrast to the harder spectrum deduced at . However, a more recent VLT/UVES study (Kim et al., 2002) using 7 QSOs finds no strong discontinuity for the quantity around and suggests that it might not be a good indicator of He reionization. These results are in agreement with the analysis of Boksenberg et al. (2003) who studied the properties of metal absorption systems between redshift 1.6 and 4.4 in the spectra of 9 Keck/HIRES QSOs.
Schaye et al. (2000) concluded that the IGM temperature evolution differs considerably from simple expectations based on QSOs as sole ionizing power input. Ricotti et al. (2000) found a similar result with an analogous but independent approach. Both analyses suggest at the IGM temperature (of the gas at mean density) undergoes a “sudden” jump which is interpreted as associated with He reionization. It is worth pointing out that Ricotti et al. (2000) recover higher temperature values and a quite smoother temperature jump than Schaye et al. (2000), whereas McDonald et al. (2001) using similar data to Shaye et al. and a more conservative analysis did not find the same temperature step at redshift 3 (for IGM gas overdense by a factor 1.4 with respect to the mean). This provides a measure of the possible uncertainties in these experiments.
In this paper we explore another source of UVB ionizing photons, namely thermal emission from shock-heated gas in collapsed cosmic structures. We find that thermal radiation, produced mainly in halos with temperatures between 106 K and a few K, is characterized by a hard spectrum with many photons above the H and He ionization thresholds. As noted above we limit the escape fraction of UV ionizing photons from high redshift galaxies, , to a few %. Thermal emission provides a significant fraction of H ionizing photons at redshift . In addition, we find that thermal emission plays a major role in the reionization of He , being comparable to the QSOs at redshift and dominating the flux at . In fact it turns out that thermal photons alone are enough to cause He reionization at . Our study is based on well understood emission mechanisms, bremsstrahlung and line emission from optically thin thermal plasma, so we expect our results to be robust.
Thermal emission is not the only possible source of ionizing photons in collapsing structures. An alternative is inverse Compton emission by relativistic electrons accelerated in large scale structure shocks (Miniati et al., 2001). However, based on methods similar to those presented in Miniati (2002) we find such a component to be negligible compared to that from QSOs, a result in agreement with Randall & Sarazin (2001).
The paper is organized as follows. In §2 we present the details of our model, that is we describe how we solve the radiative transfer equation and estimate the radiation due to QSOs, stars and, particularly, thermal emission. Our results are presented in §3 where the relevant features of the transmitted radiation flux are described. Finally, in §4 we discuss the thermal evolution of the IGM and in §5, we summarize our main results.
2 Model
2.1 Radiative Transfer
The mean specific ionizing flux, , observed at frequency, , and redshift, zo, is the solution to the cosmological radiative transfer equation which reads (Peebles, 1993)
| (1) |
where is the speed of light, is the Hubble parameter, and are the matter and vacuum energy densities respectively222 We assume a flat cosmological model with normalized Hubble constant 70 km s-1 Mpc 1, , , ., and is the volume-averaged proper spectral emissivity computed at emission redshift, , and at the appropriately blueshifted photon frequency . In addition, is the effective optical depth at frequency due to absorption of residual neutral gas in the IGM between and . Following Paresce et al. (1980), for a distribution of discrete absorbers in an otherwise transparent (i.e. ionized) medium we write
| (2) |
The distribution of absorbers as a function of the H column density and redshift, , is typically derived from counts of Ly lines in QSOs absorption spectra. It is assumed that the number density of absorbers evolves with redshift as , implying an evolution of the effective optical depth of the Ly forest as (Zuo, 1993). This was the approach taken in B01 who, based on observations of the Ly forest in the redshift range (Kim et al., 2001), determined a value of . For redshifts higher than 4, however, recent observations, including the detection of a nearly complete absorption through in the QSOs spectra discovered by the SDSS at , imply a much stronger evolution of that function (Becker et al., 2001; Fan et al., 2002). Therefore, for we retain the power-law behavior for but determine the power-law index through a comparison of the power-law models with the new measurements of Fan et al. (2002). In Fig. 1 we report the power-law models for different values of together with observed data points taken from McDonald & Miralda-Escudé (2001) and Fan et al. (2002). Actually the data do not exhibit a smooth behavior and, therefore, cannot be described in full detail by any of the smooth power-laws. The features in the data are likely due to inhomogeneities in the reionization process or to a drop in the ionizing flux in the aftermath of cosmological reionization (e.g. Cen & McDonald, 2002). In addition, as we approach , the data indicate a sudden increase of the IGM optical depth. Both of these features in the redshift dependence of are reflected in the redshift evolution of the ionization rates that McDonald & Miralda-Escudé (2001) and Fan et al. (2002) inferred by modeling the distribution of absorbers in the IGM in a fashion similar to ours. Here we adopt a single power-law with at , which approximately describes the behavior of . However, it is part of our objectives to compare the measured ionization rates (McDonald & Miralda-Escudé, 2001; Fan et al., 2002) with those produced by the radiation processes explored in this paper. We will heretofore need to bear these approximations in mind in order to properly interpret the results.

Each absorber is characterized by an optical depth , due to H and He ionization (He ionization is negligible). The value of can be derived from by studying the radiative transfer within each cloud (Haardt & Madau, 1996). For simplicity, we have assumed that all clouds are optically thin at the He ionization threshold, which yields (Madau, 1991). While this approximation slightly underestimates the optical depth at eV, it does not severely affect the opacity of the most abundant () clouds for eV (cf. Fig. 2 of Haardt & Madau, 1996).
In order to compute the mean specific ionizing flux eq. (1) is solved iteratively, as required by the dependence of on . For the total emissivity we take , that is the sum of QSO, stellar and thermal components. In the following sections we describe how each component is computed.
2.2 Radiation from QSOs and stars in galaxies
The contributions of QSOs and stars to the ionizing UV background adopted in this paper are similar to those derived in B01. We briefly summarize here the main assumptions of the model. The QSO emissivity assumes a luminosity function that follows the double power-law model of Boyle et al. (1988). For , we adopt the parameters given in Boyle et al. (2000), obtained by fitting a sample of over 6000 QSOs with . At , we include the exponential decline suggested by Fan et al. (2001), describing the dramatic reduction in QSOs number density at high redshift. Finally the QSO spectrum in the ionizing UV range is modeled as a simple power law, (Zheng et al., 1997).
For the stellar component, we assume a star formation rate that is constant from high redshifts to , then rapidly decreases to local values, as indicated by several galaxy surveys in the rest-frame non-ionizing UV (Madau et al., 1998; Steidel et al., 1999). Synthetic galactic spectra (produced with the 2001 version of the Bruzual A. & Charlot 1993 code) have then been used to calculate the emissivity for the ionizing UV as a function of . Finally, the internal absorption of radiation by the galaxy interstellar medium was modeled by a redshift-independent value for , the fraction of Ly-continuum photons that can escape into the IGM. As we shall show in §3 the values for the ionization rates recently measured by McDonald & Miralda-Escudé (2001) and Fan et al. (2002) constrain to a level of a few %. In the following we will usually set . We should also mention for completeness that we have neglected contributions from radiative recombinations in the absorbers (Haardt & Madau, 1996). It would be possible to correct for this omission, but it is not strictly necessary for comparing the contributions from the various emission processes explored in this paper.
2.3 Thermal Emission
In this section we compute the contribution to the ionizing background flux from thermal emission from gas accreting onto dark matter halos. Since we calculate this for the first time here, we outline the assumptions of the model in more detail than for the QSOs and stellar components (§2.2).
The gravitational collapse of matter density enhancements during structure formation drives supersonic flows which eventually shock (e.g. Miniati et al., 2000). The shocked gas is collisionally ionized and heated to temperatures so that dense regions can efficiently radiate away thermal energy through bremsstrahlung and line emission (White & Rees, 1978). At these temperatures and where the gas overdensity is above a few hundred collisions ensure the fractions, and , for neutral hydrogen and singly ionized helium respectively. It can be shown that under these circumstances the column density associated with the gas within the virial radius produces negligible absorption both at 1 and 4 Ry (see Appendix A). However, for cooler structures collisional ionization is less efficient and the gas becomes optically thick for virialization temperatures K (see Appendix A). Most of the thermal emission, however, is produced in objects with K. . Therefore, in the following we will assume that thermal radiation is characterized by an escape fraction of order 1.
In the following, the description of the evolution of the baryonic gas, responsible for the emission of thermal radiation, is rather simplified. Although in principle it could be pursued in some detail through semi-analytic schemes (White & Frenk, 1991; Kauffmann et al., 1993; van den Bosch, 2002), the latter provide considerably more information than we require and their level of sophistication is well beyond the scope of our current study. However, we do test our model predictions for the amount of cooling that must have occurred against independent empirical estimates. These are based on the observed cosmic star formation history and the distribution of stellar mass as a function of halo masses, that we infer from recent SDSS data. The comparison is detailed in §2.4. In addition, we comment on possible additional effects neglected in our simplified approach. In general, however, the agreement that we find between our predictions and our empirical estimates is encouraging and supports our adopted approach.
2.3.1 Collapsed Halos
The volume averaged comoving thermal emissivity in units of erg s-1 cm-3 Hz-1 can be written as
| (3) |
where is the comoving number density of collapsed dark matter halos of mass at redshift, , and is the spectral emissivity per unit mass. The last term is the ratio of the cooling time to the Hubble time at redshift and accounts for the fact that any parcel of gas emits only as long as is allowed by its supply of thermal energy.
To describe we adopt the Press & Schechter (1974) formalism as updated by Sheth & Tormen (1999). This gives the mass function
| (4) |
where is the current () average mass density of the universe, , is the mass variance of linear density perturbation corresponding to mass at the current epoch and is the critical linear overdensity evaluated at present for a spherical perturbation that collapses at redshift . Both and are taken from Kitayama & Suto (1996) and the parameters are as in Sheth & Tormen (1999). According to the spherical collapse model, for the virialized dark matter halos are characterized by an overdensity with respect to the critical value, . The baryonic gas is assumed to settle in approximate hydrostatic equilibrium within each halo at its virial temperature (e.g. Bryan & Norman, 1998)
| (5) |
and with a density , where is the halo baryonic fraction.
The spectral thermal emissivity, , is computed through the code by Raymond & Smith (1977, version 1992)333The code assumes the emitting plasma in collisional equilibrium and neglects the effects of an ambient radiation field. It includes the following atomic processes: collisional ionization, collisional excitation followed by auto-ionization, radiative recombination, and dielectronic recombination. Collisional ionization and excitation are assumed to be produced by free electrons with a Maxwellian distribution of energies (Raymond & Smith, 1977). whereas the cooling function, , necessary to compute the cooling time, was taken from the work of Sutherland & Dopita (1993). Our choices are appropriate because, for regions characterized by an overdensity of order 100 or greater at redshift and higher, the ionization equilibrium is primarily determined by plasma collisions. We adopt an average metallicity within the collapsed halos , thought to be typical for high redshift objects (Martinelli et al., 2000).
Contributions to the integral in eq. (3) are limited below a certain mass threshold. For halo masses below where is the photon energy in units of 13.6 eV, emission of thermal radiation is depressed exponentially because the low virial temperature is insufficient to ionize hydrogen. The most stringent constraint for low mass objects is due, however, to cooling. In fact, we find that the cooling correction in eq. (3) is
| (6) |
where is the gas number density, is the gas metallicity, is the cooling function and is Boltzmann’s constant. For , the normalization for given in eq. (6) holds to a good approximation for (cf. Sutherland & Dopita, 1993). If the gas contraction induced by radiative cooling occurs isobarically the amount of radiated energy equals the enthalpy of the system and, . We point out that the halo life-time, instead of the Hubble time, should perhaps be used in eq. (3), but we will neglect these details in the current investigation. Thus, the above scenario should provide at least a lower limit to the potential amount of energy to be radiated (even without considering the effects of feedback, see below).
2.3.2 Cooling & Feedback
It is well known that feedback of energy and momentum associated with formation of stars plays a fundamental role in regulating the dynamics of the IGM, although a clear and coherent understanding of how is still lacking. For the purposes of the present investigation, the effects of feedback can be taken into account by computing the increase in the cooling time, , caused by the injection of additional energy. The average energy deposited in each halo of mass can be computed through two quantities: the fraction of the baryons () that is converted into stars and, the amount of energy, , released by supernova explosions per unit of stellar mass formed. When normalized to the halo volume-integrated enthalpy, , where is the halo volume and is the gas mean molecular weight, the deposited energy is
| (7) |
The value assumed for varies in the literature. If we take a ratio of supernova per total mass converted into stars , as suggested by a standard Salpeter initial mass function, then erg M, although based on metallicity arguments Silk (1997) suggests a value 4 times larger (see also Bookbinder et al., 1980; Cen & Ostriker, 1992). We notice, incidentally, that the deposition of the assumed amount of energy corresponds to keV/part. roughly as observed in the core of small groups of galaxies (Ponman et al., 1999). Obviously, for the assumed parameters, the energy injection will only substantially affect gas within halos with temperatures K. This result is in agreement with the more sophisticated feedback prescriptions presented in White & Frenk (1991).
With the additional energy expressed in eq. (7) the radiative lifetime of a halo, as in eq. (6), will be extended by a factor . Here we have introduced yet another parameter, , the fraction of energy deposited through feedback processes that is available for conversion into thermal radiation. We do so in order to account for various effects produced by feedback. For example, when gas is more likely to be blown out of its host halo, thus strongly inhibiting cooling (MacLow & Ferrara, 1999). This would imply . In addition, the evolution of a cooling core will be altered and possibly disrupted by the occurrence of merger events (cf. White & Rees, 1978), making . However, as we shall show in the following, most of the radiation is contributed by halos within a narrow mass range. Thus, in practice, we only explore the case , which we consider appropriate for the mass range of interest here (cf. Mori et al., 2002).
2.3.3 Halo Emissivity Distribution
In Fig. 2 we show which halos are primarily responsible for the production of thermal far UV emission. For this purpose we define arbitrarily a UV luminosity , as the integral between 13.6 and 100 eV of given in eq. (3). We then plot for different redshifts and as a function of the temperature of the emitting halo population, histograms of , that is the total UV luminosity of halos with virial temperature in a logarithmic interval centered on . According to our model, most of the emission is produced by halos with temperatures between 106 K and a few K, corresponding to masses M⊙. The contribution from halos below this range is reduced because of their short cooling time. This may be seen by comparing with the highest (no-cooling) curve which corresponds to the case in which the corrective term that accounts for the effects of cooling is omitted. Notice that the “bumpy” shape of these curves for K is a reflection of the structured temperature dependence of the cooling function. On the other hand, the bend at the high mass end is solely due to the paucity of massive halos above a certain threshold which depends on both redshift and : for , .
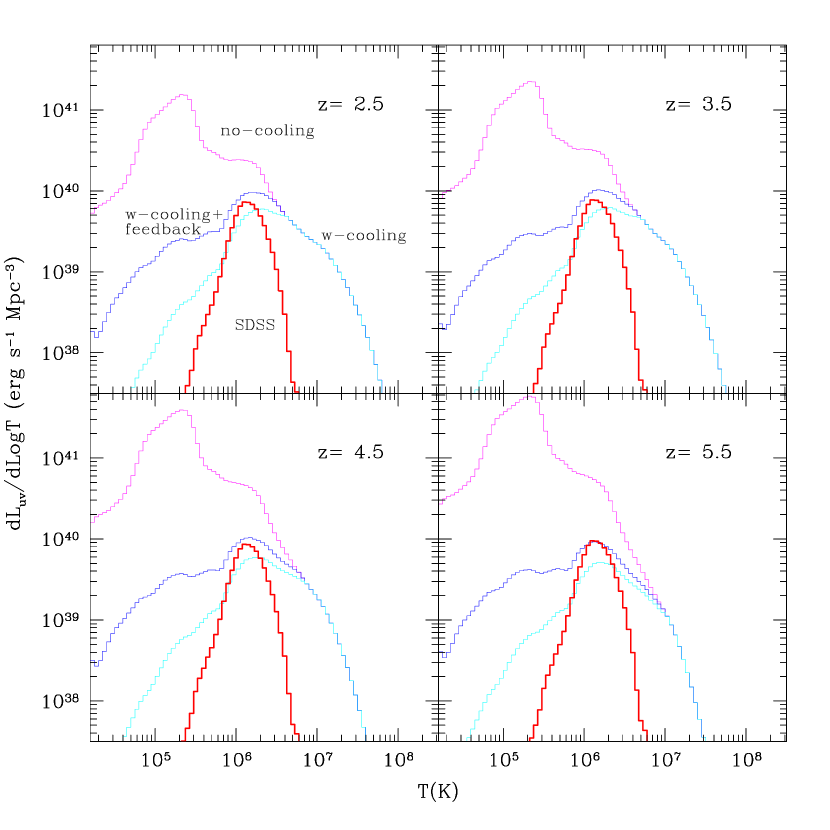
The line labeled ‘w-cooling+feedback’ corresponds to the feedback case described in Sec. 2.3.2. As expected, the extra injected energy primarily affects small structures which are now able to produce a larger amount of radiation (by reradiating the injected energy). Compared to the no-feedback case (no-feedback) the spectra in Fig. 4 are increased by a factor of a few in the low energy UV range but are basically unchanged in soft X-rays. This is a reflection of the fact that feedback mostly affects smaller (colder) halos. In any case the objects which dominate the thermal emission are only weakly affected by the specific feedback prescription we adopt.
2.4 Comparison with Observational Data
We will now attempt to test our model against observable quantities that are related to the occurrence of radiative cooling. For this purpose, we have used SDSS data presented in Kauffmann et al. (2003) for a representative sample of more than 105 galaxies, to construct a function, , describing how the total stellar mass is distributed over halo mass in the present day universe. The dataset includes the following quantities of interest to us: colors in the bands, stellar masses and concentration index.
For each galaxy, the halo mass is inferred from its luminosity through either the Tully-Fisher or Faber-Jackson relations depending on whether the galaxy is disk or bulge dominated, respectively. We first divide the sample into spirals and ellipticals on the basis of the concentration index defined as the ratio of the Petrosian half-light radius to the Petrosian 90% light radius, . Thus, a galaxy is classified as spiral or elliptical/spheroidal depending on whether or not (Shimasaku et al., 2001). The SDSS color indexes are converted to Johnson’s system according to the relations given by Smith et al. (2002). Next, for spirals we use Verheijen’s (2001) relation between the band magnitude, , and the rotational velocity , measured in the outer parts of the galaxy disk where the rotation curve flattens out. For ellipticals we employ the relation between band magnitude, , and dispersion velocity as determined by Bender et al. (1996). Temperature and velocity are then related according to and temperature and mass as in eq. (5).

The results for are shown in Fig. 3, where the histogram represents the fraction of stellar mass in the local universe as a function of the host halo virial temperature and mass.
The formation of a mass of stars implies that the thermal energy/enthalpy associated with the equivalent gas mass, , must have been radiated away. Here is the virial temperature of the host halo and as in eq. (6). In fact, this is just a lower limit. More precisely, the amount of radiated thermal energy is connected with the rate at which cold gas forms inside a halo, , rather than the rate at which stars form, . Obviously, averaged over the halo lifetime ; however, there is no straightforward way of inferring the former from the latter. A number of empirical facts and theoretical arguments suggest a proportionality between the cosmic-volume averages of the two quantities,
| (8) |
with the proportionality factor taking values of order of several at high redshifts (in Appendix B we provide an estimate of based on Press-Schechter formalism). Since we only have poor statistical information about how the time history of star formation depends on the halo mass, we assume that, on average, stars in halos of a given mass formed at the measured cosmic star formation rate (see, e.g. B01) multiplied by our stellar mass distribution function, . That is
| (9) |
This is the simplest assumption compatible with the results in Fig. 3. Thus, the differential amount of energy radiated as a consequence of star formation by halos of mass is
| (10) |
which amounts to a differential volume-averaged thermal emissivity
| (11) |
The last term in the above equation describes the spectral distribution of the radiated energy. Using the above ‘empirical’ thermal emissivity, and the cosmic star formation rate summarized in B01, we have recomputed the quantity presented in Fig. 2 in order to compare it with our model predictions. The results are illustrated by the thick (SDSS) line plotted in Fig. 2 for each redshift (the adopted value of was computed as detailed in Appendix B).
The comparison between model and ‘empirical’ predictions is only meaningful for halos with (no star formation can occur otherwise), i.e. with virial temperatures somewhat below the overlap point of the curves labeled as ‘with-cooling’ (cooling accounted for) and ‘no-cooling’ (no cooling) in Fig. 2. The actual dividing line should occur a few times below this point of overlap, typically above several K. This is because the cooling suppression factor in the former curve is based on the assumption that the halo age equals the Hubble time and is thus a bit overestimated. With this clarification, we conclude that the ‘empirical’ curve agrees quite well with the model predictions for star forming halos with virial temperatures above a few K, where the cooling effects are strong. Below K the agreement worsens considerably. This is somewhat expected and is tipically attributed to the suppression of star formation and/or gas blow-away due to feedback effects. Nevertheless, this is not too worrisome since the contribution of these objects to the UV background is not crucial, even in the ‘feedback-case’.
Finally, we note that the model and empirical curves have been derived using completely different methods and assumptions, with values for the few free parameters involved (e.g. ) taken from the studies in which these were introduced, rather than in order to improve our results. Nevertheless, the two approaches give very similar estimates of the UV thermal emission; this is encouraging as, in principle, the agreement could have been much worse.
3 Results
3.1 Ionizing Flux
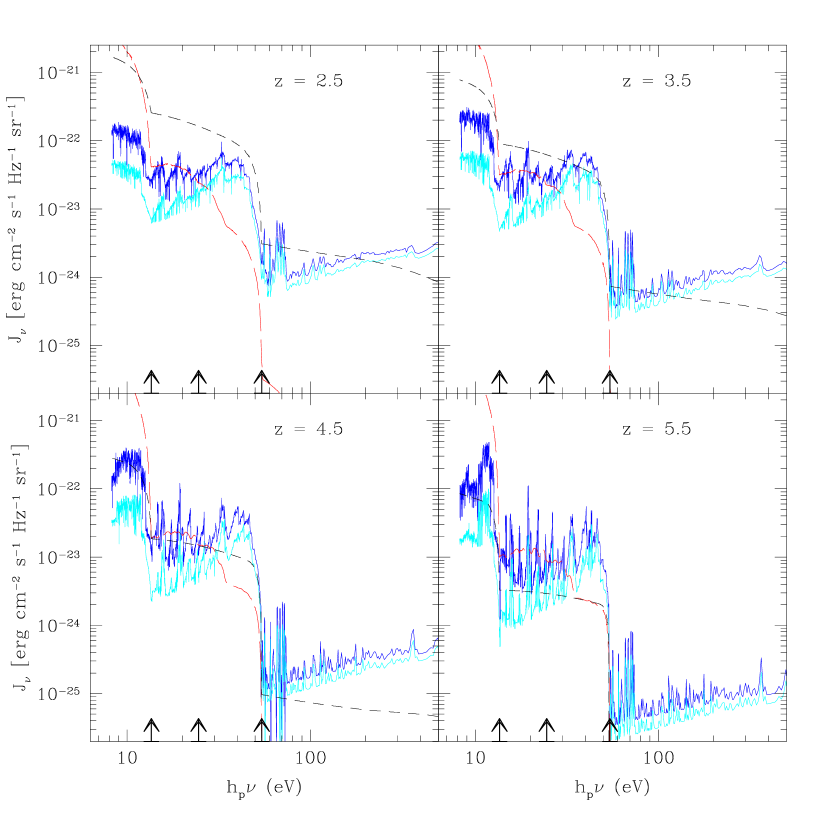
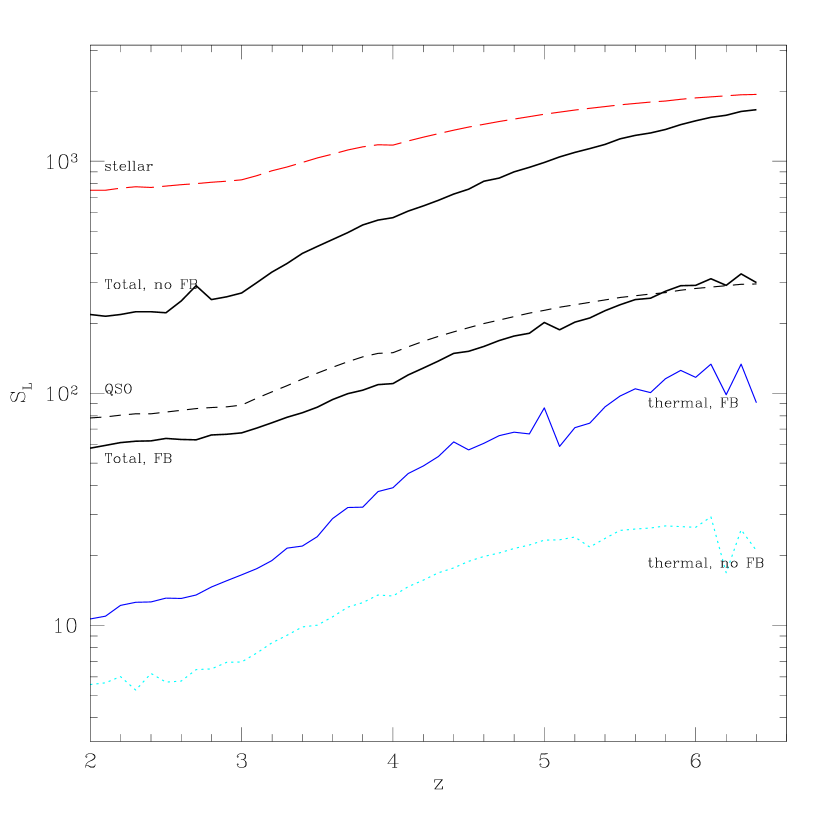
Fig. 4 shows the mean ionizing flux due to thermal emission with () and without feedback effects, that due to QSOs, and that due to galaxies () at four different redshifts. The imprint of the H and He IGM absorption, with a significant reduction of the flux close to the Lyman limits of the two species, is clearly visible in each spectrum. We find that thermal emission provides an important contribution to the average UV radiation flux. Apart from this, the three sources of radiation have very different spectra and redshift dependence. At and near the H ionization threshold, thermal emission with feedback effects corresponds to 10 % of the QSO contribution and is comparable to the stellar component. When feedback effects are not included the thermal flux in this spectral region is reduced by a factor of a few. At higher redshifts the thermal flux becomes progressively more important relative to the QSO component, whereas its relation to the stellar component is virtually unchanged. This latter feature makes sense because the production of stellar photons is linked to the formation of stars and, therefore, of cold gas, which in turn produces the thermal photons. Since the two components were modeled independently, this provides a nice consistency check. At photon energies near the He ionization threshold the trends are similar, except that now the thermal flux plays a more dominant role because of its relatively hard spectrum. Thus, in this energy range, and independently of feedback effects, thermal emission dominates the stellar contribution (even for ). It is comparable to the QSOs flux at , and becomes the dominant source at redshifts .
3.2 Softness parameter
Both for the individual spectral components and for the total spectrum, we have computed the redshift evolution of the spectral softness parameter,
| (12) |
where and are the UVB intensities at the H and He Lyman limits respectively. These are shown in Fig. 5. As already anticipated, the thermal emission is characterized by small values of , ranging from a few at low redshift to 100, at , with minor differences introduced by the adopted feedback prescription. A similar evolution is seen for the QSO spectra, although with higher values in the range 80-300; the stellar component instead shows less pronounced evolution, increasing by only a factor of , but maximal values that exceed 1000 at . The composite spectra (feedback case) evolution resembles very closely that of QSOs, even at high redshift: this is somewhat fortuitous as at the UVB is dominated by the sum of stellar and thermal contribution. The above values can be compared with the available data. Heap et al. (2000), from an analysis of the quasar Q0302-003 (), find that around the ratio of the H to He photoionization rates, is larger than 400. As , where depends on the spectrum shape and is about 4 for our composite spectrum, from Fig. 5 we find that this value corresponds to our estimate for , a very close match. In our model the results of Heap et al. would not be necessarily caused by a jump in the parameter at , but by the evolution of the composite spectrum, particularly the decrease in the ratio of thermal to the QSO flux. In the final Section we will reconsider this point.
3.3 Photo-ionization Rates
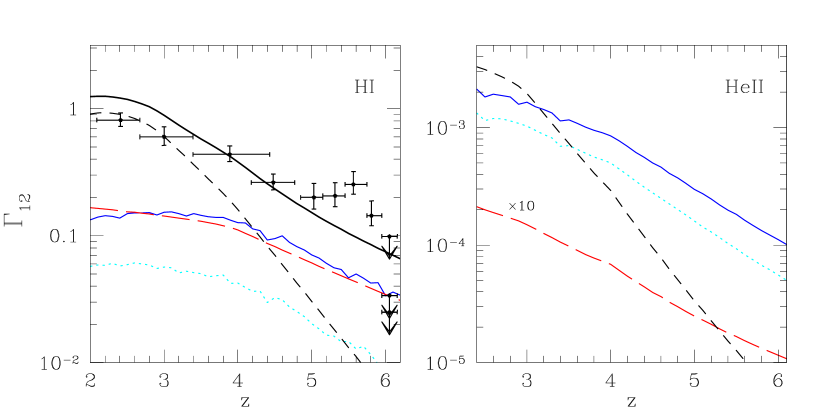
Fig. 6 shows the photo-ionization rates in units of s-1 defined as
| (13) |
for the various UV radiation components discussed above and as a function of redshift with the same notation as in Fig. 4. In addition, we also plot the photo-ionization rates inferred from the observed Gunn-Peterson effect in high-z QSO spectra (McDonald & Miralda-Escudé, 2001; Fan et al., 2002).
The left panel of Fig. 6 is relative to ionization of H and contains a number of important features. First, we notice that although the emission from QSOs is able to produce the ionizing flux observed at , it falls short at higher redshifts, a well known fact. In our formulation, it results from the assumed rapid decline of the QSO number density for , as derived from the SDSS (§2.2 Fan et al., 2001). We note here, however, that Meiksin & White (2003) in a recent paper questioned this view: by tweaking the bright end of the SDSS QSO luminosity function and allowing for objects fainter than the survey limit, QSOs alone can in principle account for the UV background at .
As a second result, the comparison between the meadured values of McDonald & Miralda-Escudé (2001); Fan et al. (2002) and the stellar ionization rates assuming (dash curve) imply, according to our model, that has to be smaller than a few %. In fact, had we assumed, e.g. , the observed would have been overpredicted by a factor 5 for and by a factor 2 at . In B01 the value was preferred, based on comparisons of the predicted ionizing flux with estimates from the proximity effect at . Estimates of the UV background from the proximity effect are known to be larger than those obtained via theoretical models of the IGM opacity (i.e. the work of Fan et al. we are using here), probably because of a bias of the QSO distribution towards the denser environments the (Schirber & Bullock, 2002) or because of systematic errors due to line blending (Scott et al., 2000). Furthermore, proximity-based UV backgrounds have been traditionally derived in a flat Einstein-De Sitter cosmology (Scott et al., 2000): this may cause a further overestimation by 40% if the true cosmology is the one we are using here (Phillipps et al., 2002).
Our conclusions on are not affected by the high values of the measured photo-ionization rates for . As already pointed out in §2.1 (see Fig. 1 there) that bump is due to a deviation of the IGM optical depth from the assumed smooth power-law evolution. Had we modeled in more detail the behavior of the IGM optical depth we would have also recovered higher values for in the same redshift range. Therefore our statement above is valid throughout the whole redshift range.
A third interesting point concerns the relative contribution of stellar and thermal emission to the metagalactic UV flux at high redshifts where the QSO emission drops rapidly. Although one can in principle reproduce the observed photo-ionization rates (thick solid line) with an escape fraction , it is also possible that at least half of those rates are due to thermal emission. This is the case when a fraction of the feedback energy is re-radiated through thermal processes (thin solid line). However, thermal emission is characterized by a much harder spectrum than the stellar one. This might serve not only as a way to discriminate observationally between the two components, but it might have implications for the temperature evolution of the IGM, studied in the next Section.
Finally, the right panel of Fig. 6 shows the He ionization rates. According to the plot, above 4 Ry stellar emission is thoroughly negligible (independent of ) whereas thermal emission is comparable to QSOs at but completely dominates the radiation flux at higher redshifts. This result is very important in terms of the IGM evolution and has not previously been noticed. It depends only weakly on feedback, but it does assume an escape fraction of the thermal photons from collapsed halos of order 1. As already discussed in Sec. 2.3 and shown in Appendix A, these conditions should be ensured for collisionally ionized gas within halos of virial temperature above K, that is for the halos that generate most of the thermal emission. However, at 4 Ry thermal flux would dominate over the QSO component even for an escape fraction from halos at and as small as at .
3.4 He Reionization
The previous results hint at the intriguing possibility that He reionization could have been powered by UV light from cosmic structure formation. For this to be the case, the production rate of ionizing photons has to satisfy the condition
| (14) |
Here is the recombination time, is the radiative recombination coefficient, and the clumping factor is meant to allow for the effects of density inhomogeneities inside the ionized region. Using a helium to hydrogen number ratio and assuming a temperature of the reionized gas K, we find
| (15) |
which is shorter than a Hubble time for . Thus, from Fig. 6 we find that at thermal emission dominates the photoionization rates and alone provides () He photoionizations/s in the no-feedback (feedback) case. According to eq. (15), the He recombination rate at the same redshift is s-1, i.e. a comparable value. Hence, it appears that structure formation can produce He reionization around , without the contribution from any other process and essentially independently of the feedback prescription adopted.
An additional check of the above results can be performed. At the fraction of mass in halos with virial temperature [calculated from Press-Schechter, eq. (4)] larger than 4 Ry is equal to % (Mo & White, 2002). In order to provide at least one He ionizing photon per He atom (we have assumed a helium abundance and that He is all singly ionized), the required mean photon energy has to be equal to 4 Ry eV. By averaging again over the mass distribution we find that this mean energy is 1.7 keV. Hence this simple argument confirms that He reionization can be caused by structure formation.
Whether or not this possibility is fully compatible with other observational results is not clear. Nevertheless, in §4 we show that this scenario predicts a temperature evolution of the IGM that maybe consistent with existing observations.
4 Discussion
Fig. 7 illustrates the thermal history of the IGM. Data points are from Schaye et al. (2000), who measured the cut-off in the relation in a sample of nine quasar spectra in the redshift range 2.5-4.0. Despite the large uncertainties, there is an indication of a temperature peak at redshift . On the other hand, the plotted curves represents different evolutionary scenarios and are (numerical) solutions to the equation
| (16) |
where , is the concentration of the i-th species, is the mean molecular weight and the IGM mean density evolves as . The calculation accounts for photoheating from a time dependent ionizing background, Compton cooling on Cosmic Microwave Background photons and non–equilibrium evolution of hydrogen and helium ionic species in a cosmological context (see Ferrara & Giallongo, 1996; Theuns et al., 1998b, for further details; we do not include metal cooling which is negligible for typical IGM metallicities). The temperature of the medium at , where we start our integration, has been computed self-consistently.
We emphasize that the various curves presented in Fig. 7 are meant to illustrate a variety of possibilities and not to depict a specific scenario. In this perspective, we first discuss the dotted line, representing the case for a UVB generated by QSO+stellar contributions given by the photoionization rates presented in Fig. 13. In this case H reionizes at and He around (therefore their heating and ionization rates are set to zero prior to their respective epoch of ionization). At hydrogen reionization the IGM temperature jumps to and decreases later on due to adiabatic cooling. A sharp rise is seen at He reionization at , although not quite enough to fit all the data points. When the contribution from thermal emission is added, the effect is small since the previous photoionization rates were already sufficient to keep the gas fully ionized and, therefore, their increase changes little the energy input to the IGM.
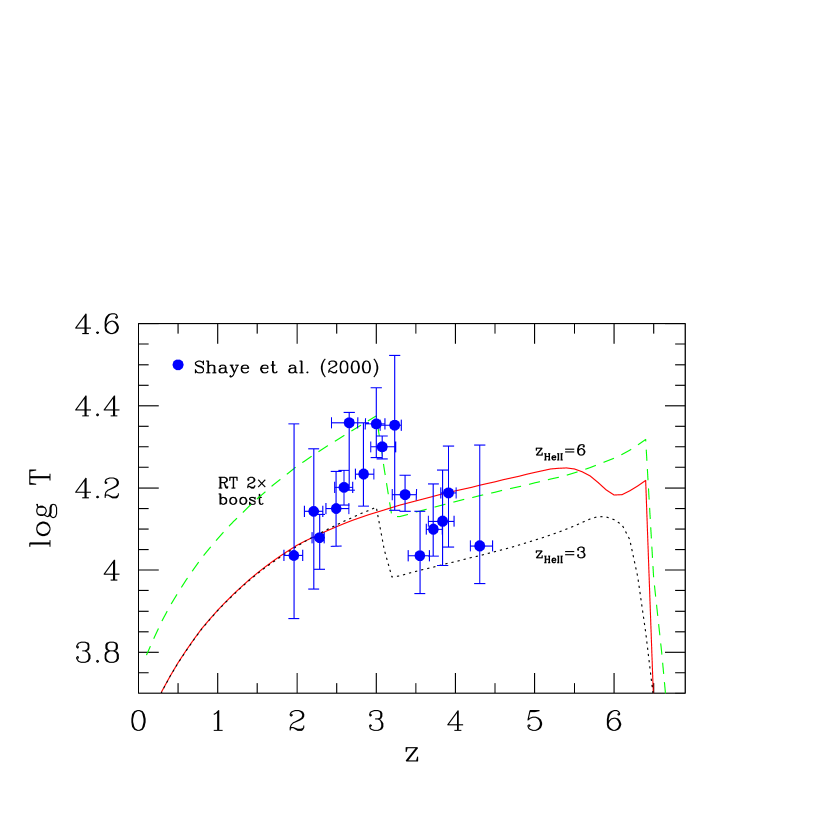
As a second example the long-dash-dot curve illustrates a similar case but with the photoheating rates increased twofold to mimic radiative transfer effects as discussed in Abel & Haehnelt (1999). Again, H reionizes at and He around . This scenario provides a somewhat better fit. Obviously it is possible to improve even further the agreement with the data points by fiddling with the available parameters so as to produce the desired behavior. At least in principle the data points can be reproduced (see also Ricotti et al., 2000).
Motivated by our findings in 3.4 we also explore a less conservative scenario in which He reionization occurs as early as and is mainly driven by thermal emission. By construction, the temperature peak around does not develop in this case. Nevertheless, most of the data are fit at the 1 level and all except one point at level.
The possibility that cosmic structure formation is responsible for He reionization at an early epoch is intriguing and challenges the common wisdom that such process is due to QSOs and occurs around . It is worthwhile then to revisit the arguments in support of the standard conjecture. These are essentially three: (i) an apparent boost of the IGM temperature around which could be due to heating associated with He reionization; (ii) an abrupt change of the C /Si ratio at indicating a significant change in the ionizing spectrum; (iii) the detection of a patchy He Ly absorption at about the same redshift, suggestive of the final (overlapping) stages of reionization process. Taken together these facts seem to justify the conjecture above.
However, as already pointed out by Schaye et al. (2000), these three observations probe different structures: metal line ratios probe high density regions; the effective He Ly absorption is mainly produced by neutral gas in the voids; the IGM temperature measurements concern the ionized gas with density around the cosmic mean. Radiative transfer calculations show that the ionization fronts propagate first through the low density regions and only subsequently penetrate the denser clumps such as filaments and halos (Gnedin, 2000; Ciardi et al., 2003).
We also emphasize the following difficulties. The existence of the peak in the IGM temperature evolution needs further data to be fully confirmed. Although a wavelet analysis seems to confirm it (Theuns et al., 2002), the data are also marginally consistent with no feature at , in which case early reionization would provide a better fit to the temperature data (Fig. 7). The conclusion about the jump in the C /Si ratio at is still debated (e.g. Boksenberg et al., 1998; Boksenberg, 1998). More recent studies of metal absorption systems in QSOs spectra both with VLT/UVES (Kim et al., 2002) and Keck/HIRES (Boksenberg et al., 2003) find no discontinuity in the C /Si ratio around . On the other hand, we have shown (Sec. 3.2) that our smoothly increasing is quantitatively consistent with the Heap et al. (2000) observations. Finally, Songaila (1998) points out that a considerable number of hard photons are required at to reproduce the observed abundances of O . At that epoch a sizable fraction of cosmic volume has to be transparent at photon energies above the He ionizing threshold.
In conclusion, there is no conclusive argument against an early () start of He reionization which may result from the hard UV field emitted during the virialization of large galaxies/small groups. Clearly, this conclusion needs to be confirmed by numerical simulations, although this task might be far from easy, as the correct treatment of the strongly radiating cooling inhomogeneities in the gas poses challenging numerical problems. Resorting to improved observations of the proximity effect might then provide a check of the scenario proposed here.
5 Summary and Conclusions
We have shown that UVB ionizing photons can be copiously produced by thermal emission from shock-heated gas in collapsing cosmic structures. Our calculations are based on an implementation of the extended Press-Schechter theory. However, the estimated amount of thermal radiation is consistent with that inferred from an independent analysis based on observed, high redshift star formation rates (B01; Lanzetta et al., 2002), and the distribution of stellar mass as a function of halo virial temperature as reconstructed from recent SDSS data (Kauffmann et al., 2003).
Thermal radiation is characterized by a hard spectrum extending up to photon energies of order . This is well above the H and He ionization thresholds for virial temperatures above K. The bulk of the emission is produced by halos with temperatures between 106 K and a few K, corresponding to masses M⊙. We assume that most of the thermal radiation is able to freely escape into intergalactic space, which is justified for a gas that is collisionally ionized and at the temperature of these halos (see Appendix A).
We use simplified radiative transfer to compute the transmitted flux due to QSO, stellar and thermal emissions. Importantly, the resulting associated photoionization rates, when compared to measurements of the Lyman series Gunn-Peterson effect in the spectra of high redshift QSOs (Fan et al., 2002; Becker et al., 2001), imply an escape fraction of UV ionizing photons from galaxies, , below a few %. This result is in agreement with very recent and independent determinations of carried out by Fernández-Soto et al. (2003), who set a 3 (statistical) upper limit % for a sample of spectroscopically identified galaxies of redshift in the Hubble Deep Field.
It turns out that near the H ionization threshold, thermal emission is comparable to the stellar component and amounts to about 5-10 %, 15-30 % and 20-50 % of the total at redshifts of 3, 4.5 and higher respectively. The quoted range depends on the fraction of feedback energy allowed to be re-radiated through thermal processes. Near the ionization threshold for He , the thermal contribution is much stronger. It is comparable to the QSO input already at , and it dominates for . Thus, this contribution, with a typical softness parameter , is expected to play a major role in He reionization. In principle structure formation alone provides enough photons to produce and sustain He reionization at . These conclusions are independent of our feedback prescriptions, which only affect low virial temperature systems. In our scenario, He ionizing photons are produced primarily by relatively large collapsing structures (with K).
The thermal spectrum is very hard, with a slope in the range depending on the importance of the supernova feedback we include. The latter process primarily affects the smallest systems, increasing their emissivity through reradiation of SN input. As these smaller objects dominate the 1-4 Ry band, the spectrum in this energy range becomes flatter as feedback is increased. Measuring the evolution of the thermal component of the UVB provides a powerful method to evaluate the importance of SNe input into the intergalactic medium.
Acknowledgments
We are indebted to X. Fan for providing us with the measurements of the photo-ionization rates presented in his work (2002) and to G. Kauffmann for making available to us her SDSS data sample. In addition, we wish to thank B. Ciardi, G. De Lucia, F. van den Bosch and V. D’Odorico for useful discussions. This work was partially supported by the Research and Training Network ‘The Physics of the Intergalactic Medium’, EU contract HPRN-CT2000-00126 RG29185.
Appendix A Optical Depth for Collisionally Ionized Gas in a Virialized Halo.
Under collisional equilibrium the fraction of neutral hydrogen and singly ionized helium are given by the ratio of the coefficients for radiative recombination and collisional ionization. With the values for these coefficients as summarized in Theuns et al. (1998b) we find
| (17) | |||||
| (18) |
where we have used the notation K. Within a virial radius
| (19) |
the gas column density for absorption at 1 Ry (4 Ry) is , where is given in eq. 17 (18) when considering that H (He ) is nearly completely ionised, is the hydrogen (helium) abundance by number and . Thus for the optical depth, , we find
| (20) | |||||
| (21) |
Appendix B Press-Schechter Estimate of .
The lifetime of a halo is
| (22) |
with the formation redshift, , of a halo of mass defined as the formation time of a progenitor with mass (Lacey & Cole, 1993, 1994). Its relation to the running redshift (assumed ) is statistical and -dependent, and is described by
| (23) |
where takes values (effectively between a few and a few) according to a probability function defined within the extended Press-Schechter formalism (Lacey & Cole, 1993, see also approximation formulae in Kitayama & Suto 1996) and and have been defined in §2.3.1. Thus, at a given redshift the formation rate of cold gas within a halo of mass that formed at , averaged over the halo lifetime , is
| (24) |
where () is the mass return fraction by stars and the subscript explicitly indicates , as opposed to cosmic-volume. After introducing the characteristic star formation timescale: (e.g. Zasov, 1995), we rewrite eq. (24) as
| (25) |
It follows that at early epochs when radiatively cooled gas is produced at a much faster rate than stars. However, the two quantities converge at late times, when . This is consistent with, e.g. , van den Bosch (2002) semianalytic model of a Milky Way-like galaxy, in which star formation occurs at a rate proportional to the amount of available cold gas. Based on the diagram of Fig. 2 of his paper we readily infer that , at shortly after the galaxy starts evolving, by and by .
Values of Gyr or so have been inferred from observations of nearby galaxies by, e.g., Zasov (1995), although the author suggests higher values during the early stages of the evolution of galactic disks. Alternatively, can be taken from semianalytic models which successfully reproduce a number of observed galactic properties. In the model of Kauffmann et al. (1993), the star formation rate is prescribed according to , where is a control parameter and . In this formulation
| (26) |
It implies lower values than those found by Zasov (1995) and, therefore, is more conservative for our present calculations. After using this expression in eq. (25) and volume averaging over halos of a given mass , a comparison to eq. (8) leads to
| (27) |
where the last equality holds for . The averaging operation is effectively over the halo formation time which we achieve through the relation in eq. (23) and the probability functions for as in Kitayama & Suto (1996). In fact, for , values of computed through eq. (27) are of order of several. This is consistent with the idea that the bulk of the cold gas in galactic systems formed at and, on average, had not yet been depleted by star formation occurring at roughly constant rate before that time (see plot 2 in B01; see also Lanzetta et al., 2002). For the purpose of comparison in §2.4 we have used and , although results are not too sensitive to .
References
- Abel & Haehnelt (1999) Abel, T. & Haehnelt, M. G. 1999, ApJL , 520, L13
- Becker et al. (2001) Becker, R. H., Fan, X., White, R. L., Strauss, M. A., Narayanan, V. K., Lupton, R. H., Gunn, J. E., Annis, J., Bahcall, N. A., Brinkmann, J., Connolly, A. J., Csabai, I. ., Czarapata, P. C., Doi, M., Heckman, T. M., Hennessy, G. S., Ivezić, Ž., Knapp, G. R., Lamb, D. Q., McKay, T. A., Munn, J. A., Nash, T., Nichol, R., Pier, J. R., Richards, G. T., Schneider, D. P., Stoughton, C., Szalay, A. S., Thakar, A. R., & York, D. G. 2001, AJ, 122, 2850
- Bender et al. (1996) Bender, R., Ziegler, B., & Bruzual, G. 1996, ApJL , 463, L51
- Bianchi et al. (2001) Bianchi, S., Cristiani, S., & Kim, T.-S. 2001, A&A, 376, 1
- Boksenberg (1998) Boksenberg, A. 1998, in Structure et Evolution du Milieu Inter-Galactique Revele par Raies D’Absorption dans le Spectre des Quasars, 13th Colloque d’Astrophysique de l’Institut d’Astrophysique de Paris, 85–+
- Boksenberg et al. (1998) Boksenberg, A., Sargent, W. L., & Rauch, M. 1998, in Proc. of Xth Rencontres de Blois ‘The Birth of Galaxies’
- Boksenberg et al. (2003) Boksenberg, A., Sargent, W. L., & Rauch, M. 2003, ApJS , submitted, eprint arXiv:astro-ph/0307557
- Bookbinder et al. (1980) Bookbinder, J., Cowie, L. L., Ostriker, J. P., Krolik, J. H., & Rees, M. J. 1980, ApJ , 237, 647
- Boyle et al. (2000) Boyle, B. J., Shanks, T., Croom, S. M., Smith, R. J., Miller, L., Loaring, N., & Heymans, C. 2000, MNRAS, 317, 1014
- Boyle et al. (1988) Boyle, B. J., Shanks, T., & Peterson, B. A. 1988, MNRAS, 235, 935
- Bruzual A. & Charlot (1993) Bruzual A., G. & Charlot, S. 1993, ApJ , 405, 538
- Bryan et al. (1999) Bryan, G. L., Machacek, M., Anninos, P., & Norman, M. L. 1999, ApJ , 517, 13
- Bryan & Norman (1998) Bryan, G. L. & Norman, M. L. 1998, ApJ , 495, 80
- Cen & McDonald (2002) Cen, R. & McDonald, P. 2002, ApJ , 570, 457
- Cen et al. (1994) Cen, R., Miralda-Escude, J., Ostriker, J. P., & Rauch, M. 1994, ApJL , 437, L9
- Cen & Ostriker (1992) Cen, R. & Ostriker, J. P. 1992, ApJL , 399, L113
- Ciardi et al. (2002) Ciardi, B., Bianchi, S., & Ferrara, A. 2002, MNRAS , 331, 463
- Ciardi et al. (2003) Ciardi, B., Stoehr, F., & White, S. D. M. 2003, MNRAS , 343, 1101
- Dove et al. (2000) Dove, J. B., Shull, J. M., & Ferrara, A. 2000, ApJ, 531, 846
- Fan et al. (2002) Fan, X., Narayanan, V. K., Strauss, M. A., White, R. L., Becker, R. H., Pentericci, L., & Rix, H. 2002, AJ, 123, 1247
- Fan et al. (2001) Fan, X., Strauss, M., Schneider, D., Gunn, J., Lupton, R., Becker, R., Davis, M., Newman, J., Richards, G., White, R., Anderson, J., Annis, J., Bahcall, N., Brunner, R., Csabai, I., Hennessy, G., Hindsley, R., Fukugita, M., Kunszt, P., Ivezic, Z., Knapp, G., McKay, T., Munn, J., Pier, J., Szalay, A., & York, D. 2001, AJ, 121, 31
- Fernández-Soto et al. (2003) Fernández-Soto, A., Lanzetta, K. M., & Chen, H.-W. 2003, MNRAS , submitted, preprint: astro-ph/0303286
- Ferrara & Giallongo (1996) Ferrara, A. & Giallongo, E. 1996, MNRAS , 282, 1165
- Gnedin (2000) Gnedin, N. Y. 2000, ApJ , 535, 530
- Haardt & Madau (1996) Haardt, F. & Madau, P. 1996, ApJ , 461, 20
- Haehnelt et al. (2001) Haehnelt, M. G., Madau, P., Kudritzki, R., & Haardt, F. 2001, ApJL , 549, L151
- Heap et al. (2000) Heap, S. R., Williger, G. M., Smette, A., Hubeny, I., Meena, S. S., Jenkins, E. B., & nd J. N. Winkler, T. M. T. 2000, ApJ , 534, 69
- Heckman et al. (2001) Heckman, T., Sembach, K. R., Meurer, G., Leitherer, C., Calzetti, D., & Martin, C. L. 2001, ApJ, in press
- Kauffmann et al. (2003) Kauffmann, G., Heckman, T. M., White, S. D. M., Charlot, S., Tremonti, C., Brinchmann, J., & et al., G. B. 2003, MNRAS , 341, 33
- Kauffmann et al. (1993) Kauffmann, G., White, S. D. M., & Guiderdoni, B. 1993, MNRAS , 264, 201
- Kim et al. (2001) Kim, T. S., Cristiani, S., & D’Odorico, S. 2001, A&A, 373, 757
- Kim et al. (2002) —. 2002, A&A , 383, 747
- Kitayama & Suto (1996) Kitayama, T. & Suto, Y. 1996, ApJ , 469, 480
- Lacey & Cole (1993) Lacey, C. & Cole, S. 1993, MNRAS , 262, 627
- Lacey & Cole (1994) —. 1994, MNRAS , 271, 676
- Lanzetta et al. (2002) Lanzetta, K. M., Yahata, N., Pascarelle, S., Chen, H.-W., & Fernández-Soto, A. 2002, ApJ , 570, 492
- Leitherer et al. (1995) Leitherer, C., Ferguson, H. C., Heckman, T. M., & Lowenthal, J. D. 1995, ApJL, 454, L19
- MacLow & Ferrara (1999) MacLow, M.-M. & Ferrara, A. 1999, ApJ , 513, 142
- Madau (1991) Madau, P. 1991, ApJL, 376, L33
- Madau & Efstathiou (1999) Madau, P. & Efstathiou, G. 1999, ApJL , 517, L9
- Madau et al. (1998) Madau, P., Pozzetti, L., & Dickinson, M. 1998, ApJ, 498, 106
- Martinelli et al. (2000) Martinelli, A., Matteucci, F., & Colafrancesco, S. 2000, A&A , 354, 387
- McDonald & Miralda-Escudé (2001) McDonald, P. & Miralda-Escudé, J. 2001, ApJL , 549, L11
- McDonald et al. (2001) McDonald, P., Miralda-Escudé, J., Rauch, M., Sargent, W. L. W., Barlow, T. A., & Cen, R. 2001, ApJ , 562, 52
- Meiksin & White (2003) Meiksin, A. & White, M. 2003, MNRAS , accepted. astro
- Miniati (2002) Miniati, F. 2002, MNRAS , 337, 199
- Miniati et al. (2001) Miniati, F., Jones, T. W., Kang, H., & Ryu, D. 2001, ApJ , 562, 233
- Miniati et al. (2000) Miniati, F., Ryu, D., Kang, H., Jones, T. W., Cen, R., & Ostriker, J. 2000, ApJ , 542, 608
- Miralda-Escude et al. (1996) Miralda-Escude, J., Cen, R., Ostriker, J. P., & Rauch, M. 1996, ApJ , 471, 582
- Mo & White (2002) Mo, H. J. & White, S. D. M. 2002, MNRAS , 336, 112
- Mori et al. (2002) Mori, M., Ferrara, A., & Madau, P. 2002, ApJ , 571, 40
- Nath et al. (1999) Nath, B. B., Sethi, S. K., & Shchekinov, Y. 1999, MNRAS, 303, 1
- Paresce et al. (1980) Paresce, F., McKee, C. F., & Bowyer, S. 1980, ApJ, 240, 387
- Peebles (1993) Peebles, P. J. E. 1993, Principles of Physical Cosmology (Princeton New Jersey: Princeton University Press)
- Phillipps et al. (2002) Phillipps, S., Horleston, N. J., & White, A. C. 2002, MNRAS, 336, 587
- Ponman et al. (1999) Ponman, T. J., Cannon, D. B., & Navarro, J. F. 1999, Nature (London) , 397, 135
- Press & Schechter (1974) Press, W. H. & Schechter, P. 1974, ApJ , 187, 425
- Randall & Sarazin (2001) Randall, S. W. & Sarazin, C. L. 2001, ApJ , 548, 60
- Raymond & Smith (1977) Raymond, J. C. & Smith, B. W. 1977, ApJS , 35, 419
- Ricotti et al. (2000) Ricotti, M., Gnedin, N. Y., & Shull, J. M. 2000, ApJ , 534, 41
- Schaye et al. (2000) Schaye, J., Theuns, T., Rauch, M., Efstathiou, G., & Sargent, W. L. W. 2000, MNRAS , 318, 817
- Schirber & Bullock (2002) Schirber, M. & Bullock, J. S. 2002, ApJ, 584, 110
- Scott et al. (2000) Scott, J., Bechtold, J., Dobrzycki, A., & Kulkar ni, V. P. 2000, ApJS, 130, 67
- Sheth & Tormen (1999) Sheth, R. K. & Tormen, G. 1999, MNRAS , 308, 119
- Shimasaku et al. (2001) Shimasaku, K., Fukugita, M., Doi, M., Hamaba, M., Ichikawa, T., Okamura, S., & et al., M. S. 2001, Astr. J. , 122, 1238
- Silk (1997) Silk, J. 1997, ApJ , 481, 783
- Smith et al. (2002) Smith, J. A., Tucker, D. L., Kent, S., Richmond, M. W., Fukugita, M., Ichikawa, T., & et al. 2002, Astr. J. , 123, 2121
- Songaila (1998) Songaila, A. 1998, Astr. J. , 115, 2184
- Steidel et al. (1999) Steidel, C. C., Adelberger, K. L., Giavalisco, M., Dickinson, M., & Pettini, M. 1999, ApJ, 519, 1
- Steidel et al. (2001) Steidel, C. C., Pettini, M., & Adelberger, K. L. 2001, ApJ, 546, 665
- Sutherland & Dopita (1993) Sutherland, R. S. & Dopita, M. A. 1993, ApJS , 88, 253
- Theuns et al. (1998a) Theuns, T., Leonard, A., & Efstathiou, G. 1998a, MNRAS , 297, L49
- Theuns et al. (1998b) Theuns, T., Leonard, A., Efstathiou, G., Pearce, F. R., & Thomas, P. A. 1998b, MNRAS , 301, 478
- Theuns et al. (2002) Theuns, T., Zaroubi, S., Kim, T., Tzanavaris, P., & Carswell, R. F. 2002, MNRAS , 332, 367
- van den Bosch (2002) van den Bosch, F. 2002, MNRAS , 332, 456
- White & Frenk (1991) White, S. D. M. & Frenk, C. 1991, ApJ , 379, 52
- White & Rees (1978) White, S. D. M. & Rees, M. J. 1978, MNRAS , 183, 341
- Wood & Loeb (2000) Wood, K. & Loeb, A. 2000, ApJ, 545, 86
- Zasov (1995) Zasov, A. V. 1995, Astronomy Letters, 21, 652
- Zhang et al. (1995) Zhang, Y., Anninos, P., & Norman, M. L. 1995, ApJL , 453, L57
- Zheng et al. (1997) Zheng, W., Kriss, G. A., Telfer, R. C., Grimes, J. P., & Davidsen, A. F. 1997, ApJ, 475, 469
- Zuo (1993) Zuo, L. 1993, A&A, 278, 343