SPI Measurements of Galactic 26Al
The precision measurement of the 1809 keV gamma-ray line from Galactic 26Al is one of the goals of the SPI spectrometer on INTEGRAL with its Ge detector camera. We aim for determination of the detailed shape of this gamma-ray line, and its variation for different source regions along the plane of the Galaxy. Data from the first part of the core program observations of the first mission year have been inspected. A clear detection of the 26Al line at 5–7 significance demonstrates that SPI will deepen 26Al studies. The line intensity is consistent with expectations from previous experiments, and the line appears narrower than the 5.4 keV FWHM reported by GRIS, more consistent with RHESSI’s recent value. Only preliminary statements can be made at this time, however, due to the multi-component background underlying the signal at 40 times higher intensity than the signal from Galactic 26Al.
Key Words.:
Nucleosynthesis – Galaxy: abundances – ISM: abundances – Gamma-rays: observations – Methods: observational1 Introduction
The measurement of 1809 keV emission from Galactic 26Al has been one of the design goals of the INTEGRAL mission (Winkler et al., 2003; Hermsen & Winkler, 2002). 26Al gamma-rays were discovered already in 1982 by HEAO-C (Mahoney et al., 1982), and since then are considered direct proof of ongoing nucleosynthesis in the Galaxy. Several follow-up experiments have set out to measure details about 26Al sources.
Much has been learned through the Compton Gamma-Ray Observatory, in particular with COMPTEL’s sky survey over 9 years, which resulted in an all-sky image in the 1809 keV gamma-ray line (Plüschke et al., 2001; Knödlseder et al., 1999; Oberlack, 1997; Diehl et al., 1995). This image clearly demonstrates that emission along the plane of the Galaxy dominates, hence 26Al nucleosynthesis is common throughout the Galaxy, rather than a local phenomenon of the solar system. The irregular structure of the emission and alignments of emission maxima with spiral-arm tangents suggested that massive stars dominate 26Al nucleosynthesis (Chen et al., 1995; Prantzos & Diehl, 1996). This could be further substantiated through comparisons with candidate source tracers, and through modelling of 26Al emission from the Galaxy and specific source regions based on knowledge about the massive-star populations (Knödlseder et al., 1999; Knödlseder, 1999).
The high spectral resolution of Ge detectors of 3 keV (FWHM) at the 26Al line energy of 1808.7 keV is expected to reveal more information about the sources and their location through Doppler broadenings and shifts, from Galactic rotation (Gehrels & Chen, 1996) and from dynamics of the 26Al gas ejected into the interstellar medium. In particular after the GRIS balloon experiment and their report of a significantly-broadened line (Naya et al., 1996), alternative measurements of the 26Al line shape were of great interest. GRIS’s value translates into an intrinsic line width of 5.4 keV, equivalent to a Doppler broadening of 540 km s-1. Considering the y decay time of 26Al such a large line width is hard to understand (Chen et al., 1997; Sturner & Naya, 1999). Other high-resolution measurements are in mild conflict with the GRIS result. The original HEAO-C measurement was interpreted as an intrinsically-narrow line of width less than 2 keV (Mahoney et al., 1984), and the recent RHESSI measurement shows some broadening, however at an intermediate value of about keV FWHM (Smith, 2003), significantly less than the GRIS value. SPI on INTEGRAL (Vedrenne et al., 2003; Roques et al., 2003) with its competitive spectral resolution and the INTEGRAL core observing program (Winkler et al., 2003) emphasizing exposures of the inner region of the Galaxy is expected to clarify these questions through high-quality data. The initial calibration phase early in the mission, which used exposures of sources in the Cygnus region, had demonstrated an excellent performance of the instrument and even shown convincing evidence of detections of diffuse 26Al emission from the Cygnus region, supporting these prospects. In this paper, we report initial analyses of the first part of the inner Galaxy region survey of the INTEGRAL core program.

2 Observations, Data, and Analysis
The first year of the INTEGRAL mission will emphasize a deep survey of the inner part of the Galaxy, devoting about 4 Msec of exposure to this region, in a dedicated observing pattern characterized by a 2∘ pitch, extending 30∘ in longitude and 20∘ in latitude away from the Galactic Center (Winkler et al., 2003). Data sharing agreements within the INTEGRAL Science Working Team imply that results on Galactic 26Al for the separate Galactic quadrants will not be addressed here, but reported in future papers. The data used for this initial analysis encompass INTEGRAL orbits 46–66 (mission days 1157–1216). Not all our analyses use the exactly same data, different selections were applied from early stages of processing; a minimum set comprises in total 839 pointings with 0.971 Ms integrated exposure livetime (see Figure 1).
Energy calibration during this time was derived by fitting instrumental background lines at energies 439, 585, 883, 1014, 1369, and 1779 keV as accumulated for each orbit. Calibrated single-detector events (“SE”, triggering one single of the 19 Ge detectors), and the composite of single and multiple detector hits (SE+“multiple events, ME”) were analyzed. Note that at the 26Al line energy 40% of the measured events are multiples. A systematic uncertainty of our energy calibration at energies below 150 keV may however distort the energies assigned to multiple events. We therefore perform independent analyses per event type (SE, SE+ME), to check for such systematics which could lead to artifacts in the wings of spectral lines.
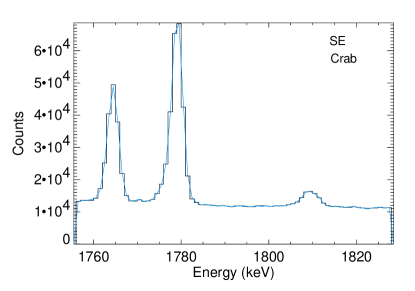
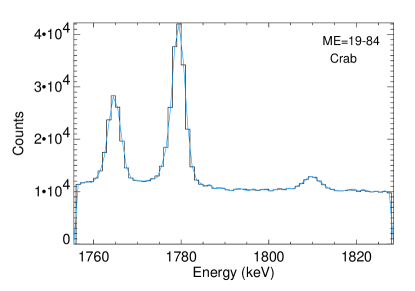
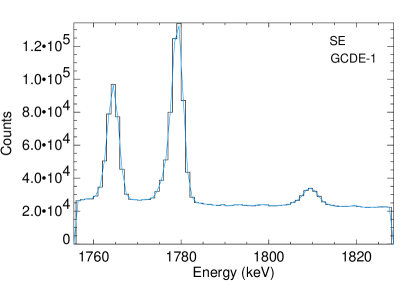
Background dominates the overall signal, (see Figures 2–4), so that in the 26Al line region (18094 keV) we measure counts from the inner Galaxy, while our background reference is based on exposures of the Crab region providing counts in the line-region. Continuum dominates, but 17% of the total signal is in a rather broad line-like feature around 1810 keV. This is mostly instrumental background, which needs to be understood before extracting the 26Al signal: For the GCDE, we expect from COMPTEL measurements a signal strength of about 13000 counts or 2.7% of the total measured counts in the line region. Background is expected at 1808.7 keV from excited 26Mg produced from spallation of Al and from -captures on Na, and at 1810.7 keV from 56Mn()56Co()56Fe, but other nuclear lines may contribute (Weidenspointner et al., 2003). Correlation analysis with other line features and cosmic-ray activation monitors is underway to model details of this underlying background, both in shape and intensity (e.g. Jean et al., 2003).
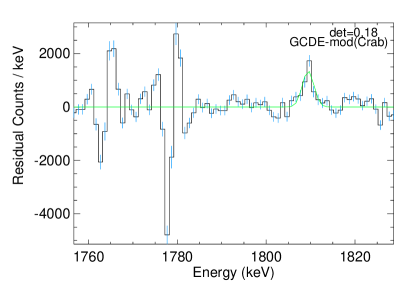
Data analysis is complicated due to the large number (839) of individual pointings, different measurement times of source and background, and detector and background evolution within and between them. For a strong source, one may hope to subtract a sufficiently well-defined background and then see a source signal. Indeed, when we use exposures from the Crab region, adjust for the different exposures and detector resolutions by normalization on the nearby background lines at energies 1764 and 1779 keV, and subtract this normalized “off-source” reference from the integrated spectrum measured from the inner Galaxy, we obtain an excess signal which indicates the presence of a celestial signal from 26Al (Fig 5). The strong instrumental background lines do not perfectly subtract. The suppression by a factor 90, however, would correspond to residuals from the instrumental feature at 1809 keV of less than half of what we observe; also, residuals appear in the wings of the instrumental lines, because our normalization does not trace time-variable gains or non-Gaussian detector degradation. The feature at 1809 keV, however, resembles the expected line more closely than background residuals: we indicate the expected 26Al signal with a Gaussian at the 26Al line energy and instrumental line width. Note that here we do not use SPI’s imaging capabilities, so it is not surprising that a not very significant 26Al detection is obtained (see Figure 5).
Imaging analysis makes use of the detailed response of the SPI instrument as is obtained from Monte Carlo simulations (Sturner et al., 2003), including the properties of the coded mask, the Ge camera, and all other material possibly interacting with incident gamma-rays. Calibrations before INTEGRAL’s launch (Attie et al., 2003) and on Cyg-X1 and the Crab in the first part of the mission have verified the validity of this response (Roques et al., 2003; Sturner et al., 2003). Adopting an intensity distribution on the sky, one may thus predict the measured event distribution from 26Al for the observed exposure pattern. Adding these to a suitable background model, one obtains a prediction for the actually-measured dataset. A fitting procedure can then be used to adjust intensity parameters of the 26Al skymap and background components:
Here are the measured data, the sky intensity distribution, the instrument response function, the background model, the statistical noise, and indices are for detectors, for pointings, for energy, and for background model components. From such fits we obtain intensity spectra of our sky model as constrained by our measurement. Several implementations (e.g. spidiffit/spi_obs_fit) of this analysis concept have been developed (Strong, 2003; Knödlseder, 2003), differing in the method of minimum searches and uncertainty estimates: The fit determines the mean of the intensity parameter posteriors through a Markov-Chain Monte Carlo method marginalizing over the background parameters (spidiffit), or alternatively minimizes the log-likelihood function through a Levenberg-Marquardt minimum search to fit spectral intensities (spi_obs_fit). Background amplitudes are fitted per pointing and energy from the measurement (spidiffit), or prescribed by an absolute model based on tracers of continuum and line background components (spi_obs_fit). Error bars are determined as standard deviation from the mean with the same Markov-Chain Monte Carlo method (Strong, 2003) for the large number of fitted parameters in spidiffit, and with an eigenvalue analysis of the error matrix (Strong, 1985; Knödlseder, 2003) for the few fitted parameters in spi_obs_fit.
Estimates of the systematic uncertainties have been added in quadrature to these statistical uncertainties and are thus included in the error bars given in figures 6–8. We fit different models () of background, such as continuum background interpolated from adjacent energies, line backgrounds from scaled reference observations off the source of interest, and scaling models using suitable tracers of background such as the rate of saturated-signal events in the Ge detectors; these are assumed to arise from cosmic-ray triggers which activate spacecraft material and hence generate nuclear-line background (Jean et al., 2003). Suitable models of the 26Al sky intensity distribution were adopted from the COMPTEL 26Al all-sky results (Plüschke et al., 2001), and from distributions of free electrons or warm dust as derived from COBE measurements (see Knödlseder et al., 1999).
If the signal is sufficient, one may consider imaging analyses in narrow spectral bins, such as exercised for the case of the 511 keV emission from the inner Galaxy (Knödlseder et al., 2003); in our case, the signal is too weak to reasonably constrain such analysis with its intrinsically many free parameters. For instrumental background only, no or only modest correlation with a plausible 26Al skymap is expected, while the correlation should be significantly better within the 26Al line energy bins. However, systematic uncertainties in our background models lead to distortions of such a correlation. It is the main task of current analysis efforts to understand the level and possible spectral shapes of such systematic uncertainties.
3 Results
From spectral analysis through fitting of adopted models for the 26Al skymap over an energy range around the 26Al line, we obtain clear detections of celestial 26Al emission at the level of 5–7. The results for the 26Al flux, as well as details of the spectral signature, however, vary significantly with parameters of the analysis, and thus indicate the levels of uncertainty at this initial stage of the work; statistical uncertainties are negligable, in comparison.
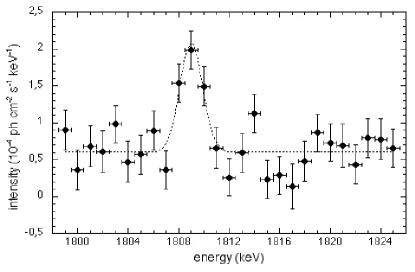
| FWHM [keV] | I [ph cm-2s-1] | |
|---|---|---|
| uncertainty | 0.7 | 1.4 |
| fit value Fig. 6 | 2.1 | 3.3 |
| fit value Fig. 7 | 3.1 | 3.3 |
| fit value Fig. 8 | 3.1 | 4.7 |
In Figure 6 we show a spectrum derived from all (single and multiple) events with spidiffit using the COMPTEL Maximum-Entropy map from 9 years of measurements as a model for the spatial distribution of the sky emission (Plüschke et al., 2001). Given the rather modest spatial resolution of SPI, the particular choice of such distribution is not critical, as long as the dynamic range of fluxes and spatial distribution are approximately correct; any choice of good source tracers, such as the warm dust or free electron distributions (see e.g. Knödlseder et al., 1999), produce very similar results. Here we treat background by adopting the relative detector intensity ratios from the Crab exposures, and adjust their intensity for each pointing in the fit.
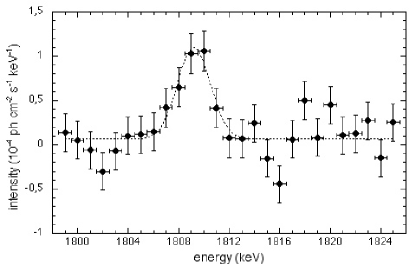
In Figure 7 we compare this to a spectrum derived from single events only (to avoid ME energy calibration issues), with spi_obs_fit and the COBE/DIRBE 240 m dust map as sky model, modelling background for the continuum from adjacent energy bins, and for the line component through taking detector ratios from the Crab exposures and absolute intensity variations from the rate of saturated events in the Ge camera during the actual GCDE measurements.
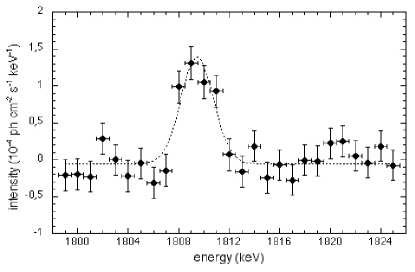
Figure 8 then illustrates how results depend on different datasets for the background: here the exposures taken for SN1987A were used as a reference to model detector ratios, in an otherwise analogous analysis with spi_obs_fit.
Our fitted sky intensity values (see Table 1) from the inner 30∘ of the Galaxy are (3–5) ph cm-2s-1, and thus fall into the range suggested by previous observations: The general consensus for the inner-Galaxy brightness of 26Al is ph cm-2s-1, considering all uncertainties involved (Prantzos & Diehl, 1996); here “inner Galaxy” means integrating over the central radian, roughly in longitude about the Galactic Center. COMPTEL had measured a value somewhat lower value of ph cm-2s-1 (Oberlack, 1997), with their background subtraction from high-latitude observations possibly suppressing large-scale diffuse flux components. On the other hand, RHESSI recently measured a rather high value of ph cm-2s-1 (Smith, 2003) from earth occultation analysis of their measurements pointed at the sun.
The different values for our line positions, all somewhat higher than the expected value of 1808.7 keV, may indicate systematics in our energy calibration, the impact of detector degradation over the time of measurements, or some structured underlying background effect which may shift our signal upward by a few tenths of a keV. On the other hand, all line width results which we obtain are consistent with SPI’s instrumental resolution of 3 keV (FWHM) and thus support RHESSI’s recent finding (Smith, 2003) that the broad line reported by GRIS (Naya et al., 1996) probably cannot be confirmed. Work is in progress to refine our spectral treatment and background modelling, in order to be able to further quantify and substantiate this conclusion.
Acknowledgements.
SPI has been completed under the responsibility and leadership of CNES. We are grateful to ASI, CEA, CNES, DLR, ESA, INTA, NASA and OSTC for support.References
- Attie et al. (2003) Attie, D., Cordier, B., Gros, M., et al. 2003, A&A, this volume
- Chen et al. (1995) Chen, W., Gehrels, N., and Diehl, R. 1995, ApJ, 444, L57
- Chen et al. (1997) Chen, W., Diehl, R., Gehrels, N., et al. 1997, ESA-SP 382, 105
- Diehl et al. (1995) Diehl, R., Dupraz, C., Bennett, K., et al. 1995, A&A, 298, 445
- Gehrels & Chen (1996) Gehrels, N., and Chen, W. 1996, A&AS, 120, 331
- Hermsen & Winkler (2002) Hermsen, W., and Winkler, C. 2002, The INTEGRAL Mission, in Proc. of the XXII Moriond Astroph. Meeting
- Jean et al. (2003) Jean, P., Vedrenne, G., Roques J.-P., et al. 2003, A&A, this volume
- Knödlseder et al. (2003) Knödlseder, J., Lonjou, V., Jean, P., et al. 2003, A&A, this volume
- Knödlseder (2003) Knödlseder, J. 2003, spi_obs_fit User Manual, to be found at http://www.cesr.fr/jurgen/isdc/index.html
- Knödlseder et al. (1999) Knödlseder, J., Bennett, K., Bloemen, H., et al. 1999, A&A, 344, 68
- Knödlseder (1999) Knödlseder, J. 1999, ApJ, 510, 915
- Knödlseder et al. (1999) Knödlseder, J., Dixon, D., Bennett, K., et al. 1999, A&A, 345, 813
- Mahoney et al. (1982) Mahoney, W. A., Ling, J.C., Jacobson A.S., Lingenfelter R.E. 1982, ApJ, 262, 742
- Mahoney et al. (1984) Mahoney, W. A., Ling, J.C., Wheaton W.A., Lingenfelter R.E. 1984, ApJ, 286, 578
- Naya et al. (1996) Naya, J. E., Barthelmy, S.D., Bartlett, L.M., et al. 1996, Nature, 384, 44
- Oberlack (1997) Oberlack, U. 1997, Ph. D. Thesis, Technische Universität München
- Plüschke et al. (2001) Plüschke, S., Diehl, R., Schönfelder, V., et al. 2001, ESA SP-459, 55
- Prantzos & Diehl (1996) Prantzos, N., and Diehl, R. 1996, Phys. Rep., 267, 1
- Roques et al. (2003) Roques, J.-P., Schanne, S., von Kienlin, A., et al. 2003, A&A, this volume
- Smith (2003) Smith, D. 2003, ApJ, 589, L55
- Strong (2003) Strong, A.W. 2003, spidiffit User Manual, to be found at http://isdc.unige.de
- Strong (1985) Strong, A.W. 1985, A&A, 150, 273
- Sturner et al. (2003) Sturner, S.J., Shrader, C.R., Weidenspointner, G., et al. 2003, A&A, this volume
- Sturner & Naya (1999) Sturner, S. J., and Naya, J. E. 1999, ApJ, 526, 200
- Taylor & Cordes (1993) Taylor, J. H., and Cordes, J. M. 1993, ApJ, 411, 674
- Vedrenne et al. (2003) Vedrenne, G., Roques, J.-P., Schönfelder, V., et al. 2003, A&A, this volume
- Weidenspointner et al. (2003) Weidenspointner, G., Kiener J., Gros M., et al. 2003, A&A, this volume
- Winkler et al. (2003) Winkler, C., Courvoisier, T.C., DiCocco, G., et al. 2003, A&A, this volume