The final two redshifts for radio sources from the equatorial BRL sample
Abstract
Best, Röttgering and Lehnert (1999, 2000a) defined a new sample of powerful radio sources from the Molonglo Reference Catalogue, for which redshifts were compiled or measured for 177 of the 178 objects. For the final object, MRC1059-010 (3C249), the host galaxy is here identified using near-infrared imaging, and the redshift is determined from VLT spectroscopy. For one other object in the sample, MRC0320+053 (4C05.14), the literature redshift has been questioned: new spectroscopic observations of this object are presented, deriving a corrected redshift. With these two results, the spectroscopic completeness of this sample is now 100%.
New redshifts are also presented for PKS0742+10 from the Wall & Peacock 2.7 GHz catalogue, and PKS1336+003 from the Parkes Selected Regions. PKS0742+10 shows a strong neutral hydrogen absorption feature in its Lyman- emission profile.
keywords:
Galaxies: active — Galaxies: distances and redshifts — Catalogues1 Introduction
The role of radio sources in astrophysical and cosmological studies is wide and varied (e.g. see McCarthy 1993 for a review), and the utility of spectroscopically complete samples of radio sources cannot be understated. By far the best studied sample of radio sources is the revised 3CR sample [1983], which is a spectroscopically complete sample of the brightest 173 radio sources in the northern sky, selected at 178 MHz ( Jy). The inaccessibility of this sample to large southern hemisphere telescope facilities prompted Best et al. (1999; hereafter BRL99) to define a roughly equivalent sample of equatorial radio sources from the Molonglo Reference Catalogue (MRC; Large et al. 1981), according to the criteria Jy, , . The reader is referred to BRL99 for a complete description of the sample and its properties.
This equatorial radio source sample, hereafter referred to as BRL, consists of 178 objects. BRL99 compiled or measured redshifts for 174 of these, and Best et al. [2000a] determined a further three, leaving just the radio source MRC1059010 without measured redshift. Subsequently the redshift of MRC0320+053, obtained by BRL99 from the NASA/IPAC Extragalactic Database (NED), has also been called into question [1998]. In this paper, a new host galaxy identification is obtained for MRC1059010, based on near–infrared imaging observations, and spectroscopic redshifts are provided for both MRC1059010 and MRC0320+053. In addition, redshifts are presented for two further radio sources from samples with high spectroscopic completeness.
2 Observations and Data Reduction
2.1 Infrared imaging observations
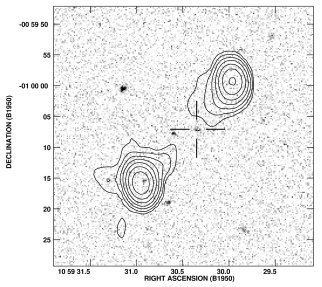
MRC1059010 was observed on the night of 22nd April 2002 with the United Kingdom InfraRed Telescope (UKIRT) using the UKIRT Fast Track Imager (UFTI). UFTI is a 1024 by 1024 pixel array with a plate scale of 0.091 arcsec per pixel. A total of 18 minutes of data were taken in the K–band, corresponding to two cycles of a 9–point dither pattern with 15 arcsecond offsets, with a 60 second exposure at each position. The data were reduced using standard techniques within the iraf noao reduction software (see e.g. Best et al. 2003 for details). The combined K–band image is shown with the contours of the radio emission overlaid in Figure 1. Regular observations of standard stars throughout the night showed that conditions were photometric, with a K–band zero-point magnitude of .
2.2 VLT spectroscopic observations
Spectroscopic observations of MRC1059010 were obtained during morning twilight of the night of 28th February 2003, using the FORS1 instrument of ESO’s Very Large Telescope (VLT). The observations were made using the 300V+10 grating, which provides a spatial scale of 0.2 arcsec, a spectral resolution of 12Å through a 1-arcsec slit, and a useful wavelength coverage of about 3600 to 8000Å. Two 1200 second spectra were obtained; see Table 1 for details.
During this same observing run, observations of two further radio sources without spectroscopic redshifts were also carried out at times when the primary targets were not accessible (see Table 1). These sources are PKS0742+10, one of the few remaining sources without redshifts in the 2.7 GHz all sky radio source sample of Wall & Peacock [1985], and PKS1336+003, drawn from the Parkes Selected Region sample [1989b].
The data were reduced using standard packages within iraf. The different exposures were combined and one-dimensional spectra were extracted from an angular extent of 2.0 arcsec. These were then wavelength calibrated using observations of HeNeAr arc lamps. After correction for the airmass, flux calibration was achieved using observations of the spectrophotometric standard stars Hiltner 600, GD108 and Feige 56.
2.3 NTT spectroscopic observations
The radio source MRC0320+053 (RA: 03 20 41.54, Dec: 05 23 34.6; B1950) was observed using EMMI on the New Technology Telescope (NTT), during evening twilight on the night of 3 March 2003. The observations were made through a 1.5-arcsecond slit using Grism number 4, which provided a useful wavelength range of about 6000 to 9500Å at a spectral resolution of Å. The CCD was binned 2 by 2 on readout, giving a spatial scale of 0.33 arcsec per binned pixel. Three five-minute exposures were obtained, but the first two of these had a significantly higher background level.
Data reduction followed the same procedure as for the VLT observations except that, because of the varying background level, to obtain maximum signal–to–noise the three individual frames were given weights proportional to the inverse of their background counts in the image combination procedure. The one–dimensional spectrum was extracted from an angular extent of 3.3 arcsec along the slit and the star LTT3218 was used for flux calibration.
| Source | Obs. | Telescope | Exp. | Redshift | Emis. | Line Flux | Eq. width | Vel. width | |
|---|---|---|---|---|---|---|---|---|---|
| Date | & Instrum. | time | line | (obs.) | (rest-frame) | (deconv) | |||
| [d/m/y] | [s] | [Å] | [W m-2] | [Å] | [km s-1] | ||||
| MRC1059-010 | 28/02/03 | VLT/FORS1 | CIV 1549 | 3962.9 | — | ||||
| CIII] 1909 | 4874.4 | — | |||||||
| CII] 2326 | 5948.4 | — | |||||||
| [NeIV] 2425 | 6178.8 | — | |||||||
| MRC0320+053 | 03/03/03 | NTT/EMMI | [NII] 6548 | 7717.4 | 33 | ||||
| H 6563 | 7735.5 | 6 | |||||||
| [NII] 6583 | 7758.6 | 92 | |||||||
| [SII] 6717 | 7915.1 | 8 | |||||||
| [SII] 6731 | 7931.7 | 5 | |||||||
| PKS0742+10 | 27/02/03 | VLT/FORS1 | Ly 1216 | 4409.7 | 162 | ||||
| CIV 1549 | 5607.9 | 2 | |||||||
| HeII 1640 | 5947.9 | 17 | |||||||
| CIII] 1909 | 6919.5 | 21 | |||||||
| PKS1336+003 | 27/02/03 | VLT/FORS1 | HeII 1640 | 3663.6 | 12 | ||||
| CIII] 1909 | 4265.7 | 42 | |||||||
| CII] 2326 | 5207.6 | 35 | |||||||
| [NeIV] 2425 | 5427.9 | 14 | |||||||
| [NeV] 3426 | 7669.5 | 9 |

3 Results
3.1 The BRL sample
Two possible host galaxies for MRC1059010 are clearly identified on the new K–band image (Figure 1), the more westerly of these being more likely host galaxy based upon its location. The position (RA: 10 59 30.33, Dec: 01 00 07.2; B1950) of this galaxy is offset by over an arcsecond from that determined by BRL99 based upon a tentative 4 detection of an galaxy. No K–band counterpart to that –band object is seen, suggesting that it was simply a noise peak. The VLT spectroscopic slit was aligned to include both of the potential K–band host galaxies, and 4 strong emission lines were detected towards the favoured western candidate (see Figure 2), identifying this galaxy as the radio source host and placing the radio source at redshift . Details of the emission line properties are provided in Table 1; both the line luminosities and the emission line ratios are typical of distant radio galaxies (cf Best et al. 2000b). The K–band magnitude of this galaxy is as measured through a 3-arcsec diameter aperture; this is nearly a magnitude fainter than a typical powerful radio source at this redshift [2002], which partially explains the difficulty in obtaining an optical identification. The host galaxy also has , making it one of the reddest powerful radio galaxies at those redshifts (cf Dunlop et al. 1989).
The redshift of MRC0320+053 has also been securely determined through the detection of strong and NII emission lines with confirming [SII] (Figure 3). The new redshift of is considerably lower than the value of which had erroneously appeared in NED, and is more in line with that estimated by de Vries et al. [1998] from the K-band magnitude. To derive the emission line properties the [NII] and H emission lines were deblended by fixing the relative wavelengths and forcing the width of each line to be the same, but allowing the redshift of the system and the relative line intensities to vary; despite the apparent closeness, the 7600Å atmospheric absorption feature does not significantly influence this fit. The intensity ratio of the two [NII] lines ought to be 3; this value was not fixed in the fitting procedure, but the best-fit is consistent with this, giving confidence in the results. The [SII] doublet was similarly deblended, and the measured line ratio is consistent with gas in the low density limit, cm-3 [1989]. This radio galaxy has a [NII]/H ratio in excess of 10, which corresponds to a remarkably high ionisation, well above that of typical AGN [1989]. This may be related to the fact that this is a compact radio source, smaller than 0.2 arcsec, with the emission lines arising from very close to the active nucleus.

3.2 Parkes Radio Sources
The extracted spectra of the two Parkes radio sources are shown in Figure 4, and details of their emission line properties are provided in Table 1. Emission lines are detected for both objects, confirming their optical identifications. PKS0742+10 shows a strong absorption feature within its Ly- emission; this is reminiscent of the results of van Ojik et al. [1997], who found neutral hydrogren absorption features to be almost ubiquitous in small ( kpc) high redshift radio sources. PKS0742+10 has a radio size of only a few milliarcsec [2001], fitting this trend.
The absorption feature was modelled using a Gaussian emission line together with a Voigt absorption profile, each convolved with the spectral resolution of the observations (see inset in Figure 4). The absorption profile is centred at 4412.6Å, corresponding to a 150 km s -1 redshift compared to the mean velocity determined from the other emission lines. If it is assumed that this absorption is optically thin then the neutral hydrogen column density can be calculated from the equivalent width of the absorption, giving cm-2, with a velocity width of km s-1. This column density will be a lower limit if the absorber is optically thick: as discussed by Dopita & Sutherland [2003], in the optically thick regime the column density cannot be reliably estimated from low spectral resolution observations unless the absorption is strong enough to be damped, which is not the case here. This has been well demonstrated by the results of Jarvis et al. [2003], who took high spectral resolution observations of the radio galaxy 0200+015 and found remarkably different absorption column densities to those found by van Ojik et al. [1997] for the same source at much lower resolution (two absorbers with cm-2 column density instead of one with cm-2).
 |
 |
3.3 Concluding remarks
By obtaining the final optical identification and the final two spectroscopic identifications of sources from the BRL sample, a fully spectroscopically complete catalogue of radio sources has been constructed at equatorial declinations, complementing the northern 3CR sample. This is currently the only complete sample of powerful radio sources which is accessible to southern hemisphere telescopes, making it a unique and powerful resource in radio source astrophysics.
Although the Parkes Selected Regions still only have about 50% spectroscopic completeness, a search through NED reveals that the Wall & Peacock 2.7 GHz sample has now reached a spectroscopic completeness of 224 out of 233 sources. The nine remaining sources without redshifts are PKS0008–42, PKS0316+16, PKS0407–65, PKS1308–22, PKS1600+33, PKS1740–51, PKS2008–06, PKS2032–35 and PKS2150–52.
Acknowledgements
PNB would like to thank the Royal Society for financial support through its University Research Fellowship scheme. MHB and RED are grateful for the support of PPARC research studentships. The authors thank Omar Almaini for carrying out the observations of MRC0320+053. The United Kingdom Infrared Telescope is operated by the Joint Astronomy Centre on behalf of the U.K. Particle Physics and Astronomy Research Council. The spectroscopic observations were carried out using the ESO Very Large Telescope at the Paranal observatory under Program-ID Number 071.A-0622(A), and the ESO New Technology Telescope at the La Silla observatory under Program-ID Number 70.B-0747 . This research has made use of the NASA/IPAC Extragalactic Database (NED) which is operated by the Jet Propulsion Laboratory, California Institute of Technology, under contract with NASA. The authors thank the referee for his/her efficiency in reviewing the manuscript.
References
- [2003] Best P. N., Lehnert M. D., Röttgering H. J. A., Miley G. K., 2003, MNRAS, 343, 1
- [1999] Best P. N., Röttgering H. J. A., Lehnert M. D., 1999, MNRAS, 310, 223
- [2000a] Best P. N., Röttgering H. J. A., Lehnert M. D., 2000a, MNRAS, 315, 21
- [2000b] Best P. N., Röttgering H. J. A., Longair M. S., 2000b, MNRAS, 23, 311
- [2002] De Breuck C., van Breugel W., Stanford S. A., Röttgering H., Miley G., Stern D., 2002, AJ, 123, 637
- [1998] de Vries W. H., O’Dea C. P., Perlman E., Baum S. A., Lehnert M. D., Stocke J., Rector T., Elston R., 1998, ApJ, 503, 138
- [2003] Dopita M. A., Sutherland R. S., 2003, Astrophysics of the diffuse Universe. Springer
- [1989a] Dunlop J. S., Guiderdoni B., Rocca-Volmerange B., Peacock J., Longair M., 1989a, MNRAS, 240, 257
- [1989b] Dunlop J. S., Peacock J. A., Savage A., Lilly S. J., Heasley J. N., Simon A. J. B., 1989b, MNRAS, 238, 1171
- [2003] Jarvis M. J., Wilman R. J., Röttgering H. J. A., Binette L., 2003, MNRAS, 338, 263
- [1983] Laing R. A., Riley J. M., Longair M. S., 1983, MNRAS, 204, 151
- [1981] Large M. I., Mills B. Y., Little A. G., Crawford D. F., Sutton J. M., 1981, MNRAS, 194, 693
- [1993] McCarthy P. J., 1993, ARA&A, 31, 639
- [1989] Osterbrock D. E., 1989, Astrophysics of Gaseous Nebulae and Active Galactic Nuclei. Mill Valley CA: University Science Books
- [2001] Stanghellini C., Dallacasa D., O’Dea C. P., Baum S. A., Fanti R., Fanti C., 2001, A&A, 377, 377
- [1997] van Ojik R., Röttgering H. J. A., Miley G. K., Hunstead R., 1997, A&A, 317, 358
- [1985] Wall J. V., Peacock J. A., 1985, MNRAS, 216, 173