Strong Gravitational Lens Candidates in the GOODS ACS Fields11affiliation: Based on observations taken with the NASA/ESA Hubble Space Telescope, which is operated by the Association of Universities for Research in Astronomy, Inc. (AURA) under NASA contract NAS5–26555
Abstract
We present results from a systematic search for strong gravitational lenses in the GOODS ACS data. The search technique involves creating a sample of likely lensing galaxies, which we define as massive early-type galaxies in a redshift range . The target galaxies are selected by color and magnitude, giving a sample of 1092 galaxies. For each galaxy in the sample, we subtract a smooth description of the galaxy light from the -band data. The residuals are examined, along with true-color images created from the data, for morphologies indicative of strong lensing. We present our six most promising lens candidates, as well as our full list of candidates.
Subject headings:
galaxies: general — galaxies: high-redshift — gravitational lensing — surveys1. Introduction
A great strength of gravitational lenses as astrophysical tools is that they provide direct measures of total mass, without the requirement that the mass be luminous or baryonic. At the most basic level, the image separation in lens systems provides a nearly model-independent measurement of the projected mass of the lensing galaxy (e.g., Kochanek, 1991; Wambsganss & Paczyński, 1994). The combination of additional observational constraints and more sophisticated modeling can provide data on the elongation and orientation of the mass distribution (e.g., Keeton, Kochanek, & Seljak, 1997), the radial mass profile of the lensing galaxy (e.g., Koopmans & Treu, 2003; Rusin et al., 2002; Kochanek et al., 2001; Wucknitz et al., 2003), and the possible existence of dark matter subhaloes (e.g., Mao & Schneider, 1998; Metcalf & Madau, 2001; Dalal & Kochanek, 2002; Bradač et al., 2002; Moustakas & Metcalf, 2003). Therefore, gravitational lenses provide a wealth of information about moderate redshift galaxies and can provide important insights into galaxy evolution (e.g., Keeton, Kochanek, & Seljak, 1998; Rusin et al., 2003). An increase in the number of known lenses benefits almost all these studies and thus motivates searches for new lenses. The data obtained with the Advanced Camera for Surveys (ACS) on the Hubble Space Telescope as part of the Great Observatories Origins Deep Survey (GOODS; Giavalisco et al., 2003) offers an unprecedented combination of angular resolution, depth, and sky coverage. In this paper we report the results of a systematic search for lenses in the data obtained in the first three epochs of observations of the GOODS fields.
2. The target population
The search strategy that we used was focused on the likely lens galaxies rather than the likely background sources. This is in contrast to the searches conducted at radio wavelengths (e.g., Myers et al., 2003; Browne et al., 2003; Winn et al., 2000) and optical searches targeting known quasars (e.g., Bahcall et al., 1992). For this search, we selected the objects most likely to produce strong lenses, namely massive early-type galaxies at . Theoretical studies indicate that these galaxies should dominate the lensing population, with only 10% or fewer of strong lenses produced by spiral galaxies (e.g., Turner, Ostriker, & Gott, 1984; Fukugita & Turner, 1991; Maoz & Rix, 1993). Similarly, a ray-tracing analysis conducted on the northern Hubble Deep Field data (HDF-N; Williams et al., 1996) indicated that nearly all the lensing cross-section was provided by massive ellipticals at (Blandford, Surpi, & Kundić 2001). Thus, our target sample was chosen to maximize the chance of finding massive early-type galaxies in the desired redshift range.
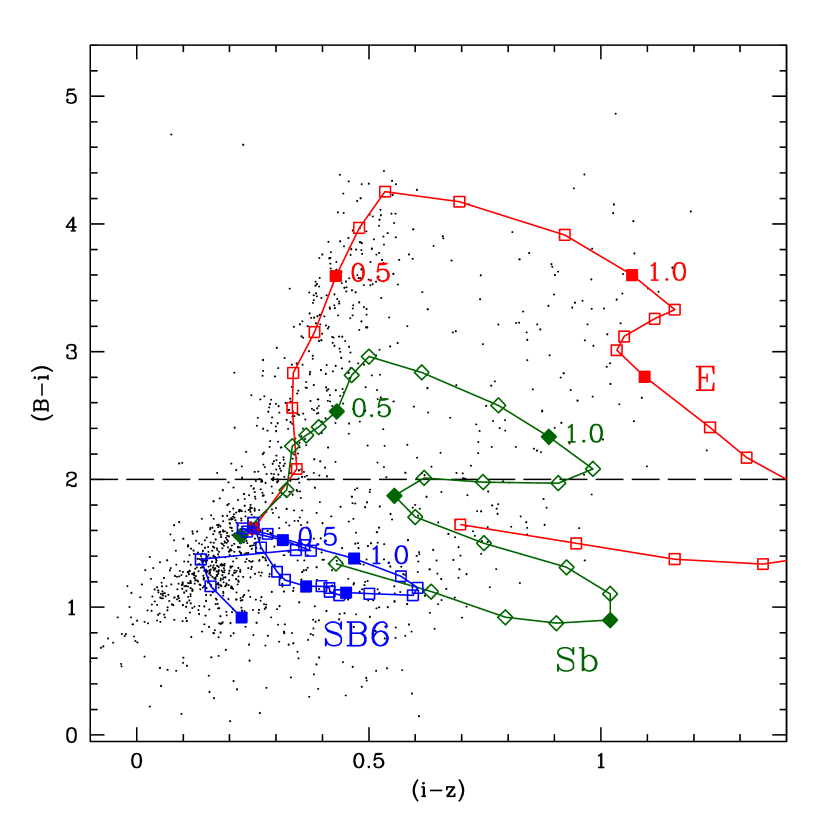
All candidate selection was done using the ACS data obtained in the F435W, F606W, F775W, and F850LP filters (hereafter, , , , and ). We consider only objects with isophotal magnitudes . Colors were measured in matched apertures, with the apertures defined by the -band data111For complete details of the source extraction, photometry, and limiting magnitudes, see Giavalisco et al. (2003).. In a color-color plot of vs , galaxies at with old stellar populations should lie in the upper part of the diagram (see Figure 1). We define our target region as , which produces a sample of 1092 galaxies. Figure 1 also contains, as examples, no-evolution tracks for different types of galaxies, which show solely the effect of spectral features moving into different filter bands for galaxies at different redshifts. Although the track for elliptical galaxies in Figure 1 would suggest that our target region contains ellipticals in a wider redshift range than desired, the combination of the low volume probed at low redshifts, cosmological dimming at high redshifts, and evolution implies that the redshift range selected is closer to the desired . Based on comparisons with both non-evolving and passive evolution models (Kinney et al., 1996), as well as spectroscopy of galaxies in the southern GOODS field, we find that the regions marked in the figure do contain the vast majority of the massive early-type galaxies in the relevant redshift interval. The target region also includes a large contamination (%) from highly-obscured systems (particularly dusty bulge-dominated galaxies). Since our goal is to be as inclusive as possible, without needing to examine the full catalog in detail, this gives an adequate sample of target galaxies.
3. Lens-search techniques
3.1. Subtraction of galaxy models
Our primary technique for searching the target sample for gravitational lens candidates was to model the light distribution of the target galaxy and then subtract the model from the data. The residuals for each target were examined for indications of gravitational lensing. To increase the robustness of our results, we used two methods to subtract the galaxy emission for each target.
The first method used customized IDL scripts that provided an empirical description of the target galaxy emission. The galaxy centroid, ellipticity, and position angle were calculated from the light distribution. The input image was split into a series of concentric ellipses, each with the input ellipticity and position angle. The empirical description of the galaxy emission was then produced by boxcar-smoothing the distribution of flux as a function of semi-major axis. This simple approach provided acceptable representations of most of the target galaxies, and non-symmetric features were clearly visible in the residual images produced by subtracting the smoothed image from the input. To judge the effectiveness of the technique in subtracting smoothly-distributed galaxy light, we use as a figure of merit the ratio of the counts in the residual image to the counts in the original image, summed within a 3″-diameter aperture. For 75% of the targets, this ratio was less than 0.05, indicating a good fit to the galaxy emission. All targets producing higher ratios had either close neighbors or the kind of asymmetric structure that the routine was designed to find, e.g., knots of star formation, bars, dust lanes, possible lensed images, etc. Thus, this method is sensitive to compact lensed images and to tangentially stretched arcs. However, complete or nearly complete Einstein rings would be subtracted away by this method. Therefore, we used a second galaxy-subtraction method to complement the empirical technique.
The second technique involved fitting parametric models to all candidate lens galaxies. Experimentation with various combinations of parametric laws (using GALFIT; Peng et al., 2002) showed that a single Sersic fit did remarkably well for the majority of galaxies in our sample, with a median . In most of the cases, the residuals produced by the GALFIT subtraction did not differ qualitatively from those produced by the empirical method, and no believable lens candidates were found solely from an examination of the GALFIT residuals.
3.2. Selection Criteria
The residuals produced by the galaxy-subtraction methods were carefully examined, as were the unsubtracted true-color () images of the target galaxies. The latter provided invaluable color information about features in the target images, which was incorporated into the candidate selection process. The criteria used to select lens candidates were based on features commonly seen in HST images of strong gravitational lenses222The CfA-Arizona Space Telescope Lens Survey web site, at http://cfa-www.harvard.edu/castles/ provides an excellent compilation of such images.. Any one of the following features seen in either the residual images or in the true-color images would cause a target to be flagged as a possible lens candidate: (1) two compact images on opposite sides of the target galaxy; (2) multiple (more than two) compact images arranged in a typical lensing morphology, (3) an arc, possibly with a faint counterimage, tangentially stretched relative to the target galaxy, especially if the arc is bluer than the galaxy, (4) a ring of possibly blue emission surrounding the target galaxy. Because gravitational lensing is an achromatic phenomenon, the alleged lensed images should have the same colors. However, some leeway was allowed to incorporate the possible effects of differential extinction (e.g., Blandford et al., 2001; Falco et al., 1999). Two of the authors independently examined all of the target galaxies. The list presented in Table 1 is the union of the two selections.
4. Discussion
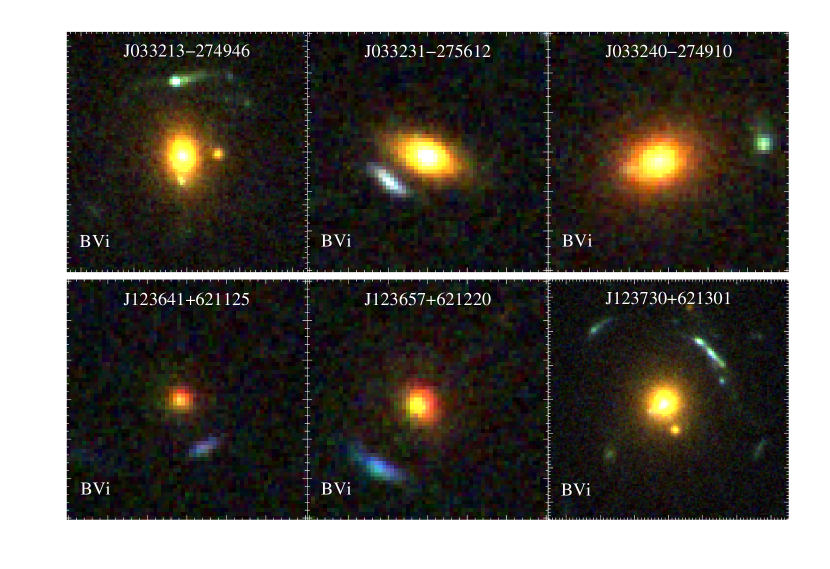
The systematic search produced a list of 48 candidates of varying quality. The biggest difficulty in selecting candidates was to differentiate rings or arcs of star formation from lensing morphologies. Most of the candidates have morphologies consisting of arc- or point-like blue features near red galaxies, with no clear counterimages; these were accepted as candidates because the faint counterimages might be below the detection threshold. All of the authors voted on which of the 48 candidates were most likely to be lenses. We list our six top candidates in Table 2 and show them in Figure 2. Further followup is necessary to establish more definitively which of the systems are real gravitational lenses. Therefore, we present the full list of candidates and their coordinates in Table 1 so that interested readers can make their own selection of most promising lens candidates and target selected systems for additional observations333See also http://www.stsci.edu/science/goods/lensing/Lenscands/lenscands.html for images of the full list of candidates.. We note that the northern GOODS field includes the HDF-N area, which was searched extensively for gravitational lenses. The two best lens candidates found in those searches, J123652+621227 and J123656+621221 (Hogg et al., 1996; Zepf, Moustakas, & Davis, 1997), are detected in the GOODS data. The former is fainter than our magnitude cutoff at ; the latter is in the target sample and was independently selected as lens candidate GDS J123657621220 (Figure 2).
In this letter, we will provide only first-order estimates of the properties of our six best candidates. Systems for which later observations clearly establish the lensing nature will be treated more fully in forthcoming papers. A nearly model-independent quantity that may be derived from lens system data is the mass of the lensing galaxy within a cylinder of radius , the Einstein ring radius. In cases with clear multiple images, a good estimate of is simply half the image separation. However, in most of the lens candidates presented in this letter, an arc is seen, but no counterimage is detected. Although this presents a difficulty, we note that in cases where an arc is highly magnified compared to the counterimage, the arc lies very close to the critical curve of the lens. Thus, in these cases the distance from the galaxy to the arc provides a reasonable estimator of . We have used the -band images to estimate for the candidates because both the blue and red objects are detected at high significance in these images. In Table 2 we provide estimated Einstein ring radii () as well as the target galaxy magnitudes in apertures with radii . More extensive descriptions of the properties of the lens galaxies will become possible with spectroscopic data and more detailed modeling.
5. Summary and Future Work
In this paper we have presented the results of a systematic search for strong gravitational lens candidates in the GOODS ACS data. The search targeted massive early-type galaxies in the redshift range , i.e., the sources most likely to produce strong lenses. We have presented a list of 48 lens candidates as well as images of our six most promising candidates. The search was conducted on images that are not yet at the full depth expected from the GOODS survey; however, we do not expect the 30% increase in sensitivity provided by the incorporation of the last two epochs of the GOODS observations to yield a significant increase in the number of lens candidates. The best candidates are being targeted for spectroscopic observations, in order to confirm or reject the lensing hypothesis. Based on these data, we will be able to measure accurate masses, mass-to-light ratios, and other parameters of the confirmed lens systems.
References
- Bahcall et al. (1992) Bahcall, J. N., Maoz, D., Doxsey, R., Schneider, D. P., Bahcall, N. A., Lahav, O., & Yanny, B. 1992, ApJ, 387, 56
- Bertin & Arnouts (1996) Bertin, E. & Arnouts, S. 1996, A&AS, 117, 393
- Blandford et al. (2001) Blandford, R., Surpi, G., & Kundić, T. 2001, in ASP Conf. Ser. 237, Gravitational Lensing: Recent Progress and Future Goals, ed. T. G. Brainerd & C. S. Kochanek (San Francisco: ASP), 65
- Bradač et al. (2002) Bradač, M., Schneider, P., Steinmetz, M., Lombardi, M., King, L. J., & Porcas, R. 2002, A&A, 388, 373
- Browne et al. (2003) Browne, I. W. A., et al. 2003, MNRAS, 341, 13
- Dalal & Kochanek (2002) Dalal, N. & Kochanek, C. S. 2002, ApJ, 572, 25
- Falco et al. (1999) Falco, E. E., et al. 1999, ApJ, 523, 617 Kasai, M., & Turner, E. L. 1992, ApJ, 393, 3
- Fukugita & Turner (1991) Fukugita, M. & Turner, E. L. 1991, MNRAS, 253, 99
- Giavalisco et al. (2003) Giavalisco, M. et al., ApJ, submitted
- Hogg et al. (1996) Hogg, D. W., Blandford, R., Kundic, T., Fassnacht, C. D., & Malhotra, S. 1996, ApJ, 467, L73
- Keeton, Kochanek, & Seljak (1997) Keeton, C. R., Kochanek, C. S., & Seljak, U. 1997, ApJ, 482, 604
- Keeton, Kochanek, & Seljak (1998) Keeton, C. R., Kochanek, C. S., & Falco, E. E. 1998, ApJ, 509, 561
- Kinney et al. (1996) Kinney, A. L., Calzetti, D., Bohlin, R. C., McQuade, K., Storchi-Bergmann, T., & Schmitt, H. R. 1996, ApJ, 467, 38
- Kochanek (1991) Kochanek, C. S. 1991, ApJ, 373, 354
- Kochanek et al. (2001) Kochanek, C. S., Keeton, C. R., & McLeod, B. M. 2001, ApJ, 547, 50
- Koopmans & Treu (2003) Koopmans, L. V. E. & Treu, T. 2003, ApJ, 583, 606
- Mao & Schneider (1998) Mao, S. & Schneider, P. 1998, MNRAS, 295, 587
- Maoz & Rix (1993) Maoz, D. & Rix, H.-W. 1993, ApJ, 416, 443
- Metcalf & Madau (2001) Metcalf, R. B. & Madau, P. 2001, ApJ, 563, 9
- Mobasher et al. (2003) Mobasher, B., Jogee, S., Dahlen, T., De Mello, D., Lucas, R., Conselice, C., & Livio, M. 2003, ApJ, submitted
- Moustakas & Metcalf (2003) Moustakas, L. A. & Metcalf, R. B. 2003, MNRAS, 339, 607
- Myers et al. (2003) Myers, S. T., et al. 2003, MNRAS, 341, 1
- Peng et al. (2002) Peng, C. Y., Ho, L. C., Impey, C. D., & Rix, H.-W. 2002, AJ, 124, 266
- Rusin et al. (2002) Rusin, D., Norbury, M., Biggs, A. D., Marlow, D. R., Jackson, N. J., Browne, I. W. A., Wilkinson, P. N., & Myers, S. T. 2002, MNRAS, 330, 205
- Rusin et al. (2003) Rusin, D., et al. 2003, ApJ, 587, 143
- Turner, Ostriker, & Gott (1984) Turner, E. L., Ostriker, J. P., & Gott, J. R. III 1984, ApJ, 284, 1
- Wambsganss & Paczyński (1994) Wambsganss, J. & Paczyński, B. 1994, AJ, 108, 1156
- Winn et al. (2000) Winn, J. N., et al. 2000, AJ, 120, 2868
- Williams et al. (1996) Williams, R. E., et al. 1996, AJ, 112, 1335
- Wucknitz et al. (2003) Wucknitz, O., Biggs, A. D., & Browne, I. W. A. 2003, MNRAS, submitted
- Zepf, Moustakas, & Davis (1997) Zepf, S. E., Moustakas, L. A., & Davis, M. 1997, ApJ, 474, L1
| ID | RA(2000) | Dec(2000) | aaPhotometric redshifts determined as described in Mobasher et al. (2003). Photometric redshifts for the northern GOODS sources are being determined. | ||||
|---|---|---|---|---|---|---|---|
| GDS J033206274729 | 03 32 06.431 | 27 47 28.76 | 23.83 | 22.94 | 21.78 | 21.09 | 0.96 |
| GDS J033211274650 | 03 32 11.403 | 27 46 49.98 | 24.42 | 22.77 | 21.70 | 21.34 | 0.46 |
| GDS J033213274946 | 03 32 13.006 | 27 49 46.08 | 24.02 | 21.98 | 20.65 | 20.19 | 0.55 |
| GDS J033215274157 | 03 32 14.825 | 27 41 57.17 | 25.38 | 23.60 | 22.37 | 22.00 | 0.55 |
| GDS J033216274714 | 03 32 15.805 | 27 47 13.61 | 24.44 | 22.44 | 20.98 | 20.51 | 0.62 |
Note. — Units of right ascension are hours, minutes, and seconds. Units of declination are degrees, arcminutes, and arcseconds. [The complete version of this table is in the electronic edition of the Journal. The printed edition contains only a sample.]
| ID | RA(2000) | Dec(2000) | aaPhotometric redshifts determined as described in Mobasher et al. (2003). Photometric redshifts for the northern GOODS sources are being determined. | bbEstimated Einstein ring radius, in arcseconds. | ccMagnitude within an aperture of radius . | ccMagnitude within an aperture of radius . | ccMagnitude within an aperture of radius . | ccMagnitude within an aperture of radius . | NotesddCI = counter-image. |
|---|---|---|---|---|---|---|---|---|---|
| GDS J033213274946 | 03 32 13.006 | 27 49 46.08 | 0.55 | 0.96 | 24.82 | 22.35 | 20.93 | 20.48 | Blob + possible CI |
| GDS J033231275612 | 03 32 31.067 | 27 56 12.34 | 0.57 | 0.62 | 25.00 | 23.10 | 21.82 | 21.42 | Arc |
| GDS J033240274910 | 03 32 39.598 | 27 49 09.57 | 0.75 | 1.31 | 25.52 | 23.18 | 21.69 | 20.80 | Faint CI |
| GDS J123641621125 | 12 36 41.139 | 62 11 25.32 | 0.73 | 26.82 | 24.95 | 23.57 | 22.73 | Faint arc | |
| GDS J123657621220 | 12 36 56.642 | 62 12 20.45 | 1.00 | 25.77 | 24.25 | 22.71 | 21.97 | Arc | |
| GDS J123730621301 | 12 37 29.900 | 62 13 01.15 | 1.98 | 23.10 | 21.29 | 20.22 | 19.85 | Multiple arcs (+CI?) |
Note. — Units of right ascension are hours, minutes, and seconds. Units of declination are degrees, arcminutes, and arcseconds.