The Chamaeleontis young stellar group and the characterization of sparse stellar clusters
Abstract
We present the outcomes of a Chandra X-ray Observatory snapshot study of five nearby Herbig Ae/Be (HAeBe) stars which are kinematically linked with the Oph-Sco-Cen Association (OSCA). Optical photometric and spectroscopic followup was conducted for the HD 104237 field. The principal result is the discovery of a compact group of pre-main sequence (PMS) stars associated with HD 104237 and its codistant, comoving B9 neighbor Chamaeleontis AB. We name the group after the most massive member. The group has five confirmed stellar systems ranging from spectral type B9–M5, including a remarkably high degree of multiplicity for HD 104237 itself. The HD 104237 system is at least a quintet with four low mass PMS companions in nonhierarchical orbits within a projected separation of 1500 AU of the HAeBe primary. Two of the low-mass members of the group are actively accreting classical T Tauri stars. The observations also increase the census of companions for two of the other four HAeBe stars, HD 141569 and HD 150193, and identify several additional new members of the OSCA.
We discuss this work in light of several theoretical issues: the origin of X-rays from HAeBe stars; the uneventful dynamical history of the high-multiplicity HD 104237 system; and the origin of the Cha group and other OSCA outlying groups in the context of turbulent giant molecular clouds. Together with the similar Cha cluster, we paint a portrait of sparse stellar clusters dominated by intermediate-mass stars Myr after their formation.
1 Introduction
While much star formation research has concentrated on the origins of rich stellar clusters and of isolated individual stars, it is likely that a significant fraction of stars also form in groups of stars which represent an intermediate scale in the hierarchical structure of star formation regions (Clarke, Bonnell, & Hillenbrand, 2000; Elmegreen et al., 2000; Adams & Myers, 2001; Kroupa & Boily, 2002). If their stellar population is drawn from a standard initial mass function (IMF), these stellar groups will typically be dominated by a few M⊙ stars. These groups may emerge from relatively small molecular clouds, such as found in the Taurus-Auriga cloud complex, or in parts of giant molecular clouds (GMCs) which also produce the rich OB associations. In the latter case, some plausibly will appear dispersed around OB associations, propelled by motions inherited from the natal turbulent molecular material (Feigelson, 1996).
Such young stellar groups are often difficult to find as they are often dynamically unbound, dispersing into the Galactic field within a few million years (Bonnell & Clarke, 1999). Study of small stellar groups is thus largely confined to the pre-main sequence (PMS) phase. Searches have been pursued in two ways. First, excess stellar densities in the neighborhoods of nearby Herbig Ae/Be (HAeBe) stars – intermediate-mass PMS stars readily identified by their infrared-luminous disks and active accretion – are sought using optical and near-infrared imagery (Aspin & Barsony, 1994; Hillenbrand et al., 1995; Testi et al., 1997; Testi, Palla, & Natta, 1999; Weinberger et al., 2000). They are often surrounded by small groups of lower mass stars, as expected from the IMF.
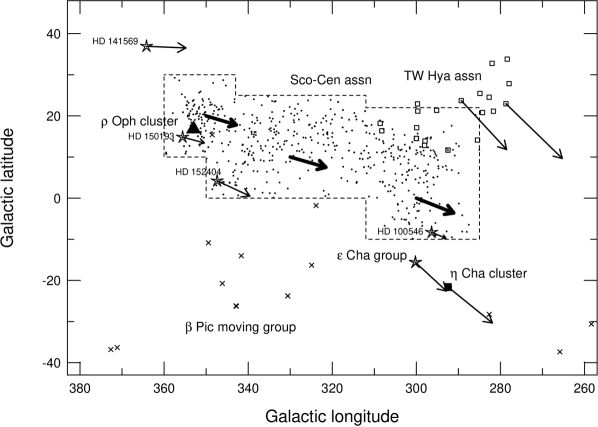
Second, sparse stellar groups kinematically convergent with the nearest OB association, the Oph-Sco-Cen Association (OSCA; this nomenclature is adopted from Blaauw, 1991), have been identified (Mamajek, Lawson, & Feigelson, 2000; Ortega et al., 2002). These include one compact group – the Cha cluster dominated by a B8 star and three A stars (Mamajek, Lawson, & Feigelson, 1999; Lawson et al., 2001) – and two dispersed groups – the Pic moving group dominated by five A stars (Zuckerman et al., 2001) and the TW Hya Association with a single A star (HR 4796; Song, Bessell & Zuckerman 2002 and references therein). The locations of these groups in relation to the OSCA are illustrated in Figure 1. Membership of OSCA outlier groups are principally based on a combination of kinematical criteria and elevated X-ray emission, which is a ubiquitous characteristic throughout PMS evolution from Class I protostars through post-T Tauri stars (Feigelson & Montmerle, 1999).
In addition to clustering on pc scales, intermediate-mass stars may be accompanied by bound companions on AU scales. The stellar multiplicity of older low-mass stars is established to be 57:38:4:1 singles:binaries:triples:quartets for every 100 stars (Duquennoy & Mayor, 1991). A few higher multiplicity field systems are known such as Castor, a sextet of three close binaries dominated by two early A stars. The situation is more confusing for PMS systems. The crowded and rich Orion Nebula Cluster simultaneously shows very high multiplicities around its massive OB stars, main sequence levels of close lower-mass binaries, and a deficiency of wide binaries (Preibisch et al., 1999; Simon, Close, & Beck, 1999). The distribution of binary separations may depend on the local density of neighbors even within a single cluster (Brandner & Koehler, 1998). In less crowded environments like the Taurus-Auriga clouds, binarity is nearly a factor of 2 higher among lower-mass PMS systems than in main sequence stars such that virtually all stars appear to be born in multiple systems (Mathieu, 1994). Binary fractions among HAeBe stars are also elevated above main sequence levels and a few triple systems are known (§7.2).
The study of multiplicity in young stars is of critical importance (Zinnecker & Mathieu, 2001). It first addresses primordial conditions of star formation, such as the fragmentation of molecular material and redistribution of angular momentum during gravitational collapse (Klessen, 2001; Boss, 2002; Larson, 2002, and the review by Bodenheimer et al. 2000). But it also reveals subsequent dynamical evolutionary effects, such as the dissipation of molecular material, close stellar encounters, stellar evaporation, and the survival of protoplanetary disks (reviews by Bonnell 2000 and Kroupa 2000).
We report here an effort that combines the two observatioal approaches outlined above. We seek young low-mass PMS stars with elevated X-ray emission around intermediate-mass PMS HAeBe stars that are kinematically associated with the OSCA. This is a small study based on only five X-ray snapshots designed to test the efficacy of the method. Despite the exploratory nature of our effort, one new young OSCA outlying stellar group is found associated with the closely spaced B/A stars Cha and HD 104237, including a remarkably high multiplicity of HD 104237 itself. Section 5 details our X-ray, optical/infrared photometric and spectroscopic characterization of the Cha group111Following the practice of Mamajek, Lawson, & Feigelson (1999) in naming the Chamaeleontis star cluster, we name the new Chamaeleontis group of PMS stars after the highest mass member. Components HD 104237 B-E are names in order of proximity to the primary HD 104237A.. We also find new companions within AU of two of the other observed HAeBe stars, HD 141569 and HD 150193 (§6). A variety of theoretical issues are discussed in §7.
2 Our strategy for locating young stellar systems
Figure 1 shows of the celestial sphere featuring stars associated with the OSCA. The dashed lines outline the boundaries of the rich Upper Sco (US), Upper Centaurus Lupus (UCL) and Lower Centaurus Crux (LCC) subgroups of the OSCA defined by de Zeeuw et al. (1999) in their detailed study of Hipparcos motions. The brighter members, complete to and consisting mainly of intermediate-mass BAF stars, identified by them are plotted as small dots. The three thick arrows show subgroup average proper motions during the next 1 Myr without correction for solar reflex motion. Hipparcos parallaxes of these bright members establish the subgroup distances to be 145 pc (US), 140 pc (UCL) and 118 pc (LCC).
Several samples of fainter OSCA members within the traditional boundaries have been constructed based on various combinations of kinematical, spectroscopic and X-ray selection criteria (Preibisch et al., 2002; Mamajek, Meyer, & Liebert, 2002), but these constitute only a few percent of the full population of the subgroups, estimated to be stars with M⊙ assuming a standard initial mass function and some stellar evaporation (de Geus, 1992). The late-type members of these samples are particularly valuable in establishing ages from their positions on the PMS tracks in the HR diagram. The ages for Oph, US, UCL and LCC OSCA subgroups are found to be , 5, 16 and 17 Myr respectively. This progression of ages led Blaauw (1964, 1991) to suggest that a sequence of distinct star forming events occurred in the ancestral giant molecular cloud where later events are triggered by the shocks and ionization fronts produced by the OB stars of previous events (Elmegreen & Lada, 1977). The ages of the outlying OSCA groups are similarly established to be , , and Myr for the Cha, Pic and TW Hya groups respectively (Lawson & Feigelson, 2001; Zuckerman et al., 2001; Webb et al., 1999).
In this preliminary study, we chose five HAeBe stars with present-day space positions in or near the OSCA, and with space motions consistent with an origin in the SCA giant molecular cloud (Table 1). The first five columns of the table give the star identifiers, Hipparcos distances, and estimated masses and ages. See table notes for details.
The ninth column of Table 1 indicates that two of the stars are closely associated with small molecular clouds. HD 100546 is likely associated with the bright-rimmed dark cloud DC296.2-7.9 located 0.4∘ away (Vieira, Pogodin, & Franco, 1999; Mizuno et al., 2001). HD 104237, and its comoving non-emission line B9Vn companion Cha 2′ away, lie among several small molecular clumps with M⊙ within 10′ (Knee & Prusti, 1996). Knee & Prusti plausibly argue that these are dissipating remnants of the molecular cloud from which these two intermediate-mass stars formed. Indeed, the entire Chamaeleon-Musca region south of the OSCA has many widely dispersed small molecular clouds and filaments, some closely associated with relatively isolated PMS stars (Mizuno et al., 1998, 2001). These authors (see also Mamajek et al. 2000) discuss the possibility that this molecular material remains after the passage of the interstellar supershells attributed to the OB winds and supernova remnants of the OSCA (de Geus, 1992).
Figure 1 qualitatively shows that the five targets have proper motions similar to those of the principal OSCA subgroups. Quantitative assessment of an origin in the same molecular cloud complex, which is now largely dispersed, requires accurate radial velocities which are generally not available. We adopt here the approximate method described by Mamajek, Lawson, & Feigelson (2000) (see also Mamajek & Feigelson 2001) where we evaluate the closest approach in three dimensions between a star and OSCA subgroups, , assuming linear motion and arbitrary radial velocities. This calculation of closest approach includes correction for solar reflex motion, and is similar to the measurement of proximity of ‘spaghetti’ in 6-dimensional phase space described by Hoogerwerf & Aguilar (1999) and used by de Zeeuw et al. (1999) to establish OSCA memberships. The resulting distances for the target stars to OSCA subgroup centers over the past 10 Myr are given in the last column of Table 1. In the two cases where radial velocity measurements are available (HD 141569 and 152404, Barbier-Brossat & Figon 2000), our method correctly gives the closest approach to OSCA subgroups for the measured value compared to other hypothetical values.
From this measure of past proximity, available kinematical data for three of the target stars (HD 100546, 104237 and 150193) are fully consistent with OSCA subgroup membership ( pc), while for two stars (HD 141569 and 152404) SCA membership is less certain ( pc). For the three stars lying within the SCA boundaries (Figure 1), these results agree with those obtained by de Zeeuw et al. (1999) who assign HD 100546 and 150193 as high probability OSCA members and HD 152404 as a lower probability member.
Finally, we note that for three targets HD 100546, HD 141569 and HD 150193 searches for close low-mass companions to the bright HAeBe primary have been made at optical or near-infrared bands (§6). This provides us opportunity to compare the effectiveness of finding companions through X-ray activity versus photospheric emission.
3 observations and analysis
Table 2 gives the log of X-ray observations. We used the Advanced CCD Imaging Spectrometer Imaging (ACIS-I) array on board the Chandra X-ray Observatory. The satellite and instrument are described by Weisskopf et al. (2002). The first stages of data reduction are described in the Appendix of Townsley et al. (2003). Briefly, we start with the Level 1 events from the satellite telemetry, correct event energies for charge transfer inefficiency, and apply a variety of data selection operations such as ASCA event grades and energies in the range keV. A small (typically ″) correction to the image boresight is made so the X-ray bright Herbig Ae/Be stellar position agrees with the position.
Candidate sources were located using a wavelet-based detection
algorithm (Freeman et al., 2002). We applied a low threshold () so that some spurious sources are found which we exclude
later. The image was visually examined for additional sources such as
close companions to the bright HAeBe star. Events for each candidate
source were extracted using the acis_extract222
Description and code for acis_extract are available at
http://www.astro.psu.edu/xray/docs/TARA/ae_users_guide.html.
procedures which take into account the position-dependent point spread
function. Background is negligible for sources of interest in these
short exposures and was not subtracted. Candidate sources with 3
extracted counts are now rejected.
The valid sources are cross-correlated with the USNO-B1.0 star catalog derived from all-sky Schmidt survey photographic plates (Monet et al., 2003). Sources with counterparts brighter than 16.0 magnitude in the , or band are considered to be prime candidate young stars. This criterion eliminates virtually all X-ray sources which are extragalactic. The X-ray sources with stellar counterparts are listed in Tables 3 and 4.
Table 5 provide results from subsequent analysis of the X-ray properties of the sources most likely associated with PMS stars. The following software packages were used: CIAO 2.3 and for photon extraction, XRONOS 5.19 for variability, and XSPEC 11.2 for spectral modeling. events were extracted in the keV band from a circular region of radius (in arcsec). gives the fraction of a point spread function lying within that radius at the source’s location in the ACIS field333These values are derived from the memo ‘An analysis of the ACIS-HRMA point response function’ by A. Ware and B. R. McNamara (1999) available at http://cxc.harvard.edu/cal/Acis/Cal_prods/psf/Memo/abstract.html and its associated data products. The subarcsecond on-axis values were derived from calibration run H-IAI-CR-1.001 and are not very certain because the point spread function under in-flight conditions may differ slightly from that seen during ground calibration..
The distribution of photon energies were modeled as emission from a thermal plasma with energy based on MEKAL emissivities (Kaastra & Mewe, 2000). For two of the stronger sources, a two-temperature plasma model was needed. For the weaker sources with counts, the derived values are unreliable and are provided only to indicate how broadband luminosities were derived. With one exception (HD 104237 E), successful fits were found without intervening absorption by interstellar or circumstellar material. While the derived plasma energies are often imprecise, broad-band fluxes integrated over the best-fit model are insensitive to spectral fitting uncertainties and have roughly errors. X-ray luminosities, in the soft keV band and in the total keV band, are obtained from these fluxes by multiplying by using the distances in Table 1 and dividing by .
Variability information is limited by our short exposures. No source exhibited significant variations within an observation, as measured with a Kolmogorov-Smirnov one-sample test. Virtually all stellar sources observed in the two widely separate exposures of the Cha/HD 104237 field showed long-term variability. Table 5 gives these luminosities separately assuming no variations in spectral shape.
4 Optical observations
4.1 Color-magnitude photometric study of the Cha/HD 104237 field
Optical color-magnitude diagrams are a powerful tool aiding the discovery and characterization of PMS stellar populations (Walter et al., 2000; Lawson et al., 2001). For nearby compact, coeval and codistant groups, PMS stars form an isochrone that is elevated in magnitude above the vast majority of field stars owing to a combination of youth, proximity and (for groups dispersed from their parent molecular cloud) the absence of significant reddening. For X-ray discovered groups of PMS stars such as the Cha cluster (Mamajek, Lawson, & Feigelson, 1999) and the Cha group announced here, optical photometric study also permits an independent evaluation of completeness within the X-ray field (except for low-mass stars located very close to the bright A and B stars). X-ray-faint stars with similar photometric properties to X-ray selected cluster members can be identified and subsequently observed using spectroscopy for confirmation of membership; e.g. for the Cha cluster, we identified two X-ray faint late-type members residing within the High-Resolution Imager discovery field including the strongest disk source in the cluster (Lawson et al., 2002; Lyo et al., 2003a).
We made a map covering most of the Chandra Cha/HD 104237 field in the Cousins VI photometric bands using the 1.0-m telescope and SITe CCD detector at the Sutherland field station of the South African Astronomical Observatory (SAAO) during 2002 January. Some later VRI observations were made in 2002 April and 2003 April to complete coverage of the field. A total field of square arcmin centered on HD 104237 was surveyed under photometric conditions in 1.5″ seeing, with the observations transformed to the standard system using observations of southern photometric standard stars. Exposure times in the VRI bands of 90 s, 60 s and 30 s, respectively, permits detection – for Myr-old PMS stars at pc distance – down to M6 spectral type cluster members with and () . For the central regions of the Chandra field, we also obtained exposures of shorter duration ( s) to minimize saturation effects from the bright Cha and HD 104237 on photometry of several spatially proximate late-type stars. Finally, we obtained deeper exposures (VRI exposures of 900s, 600s and 300s) to characterize the optical counterparts of the faintest Chandra sources.
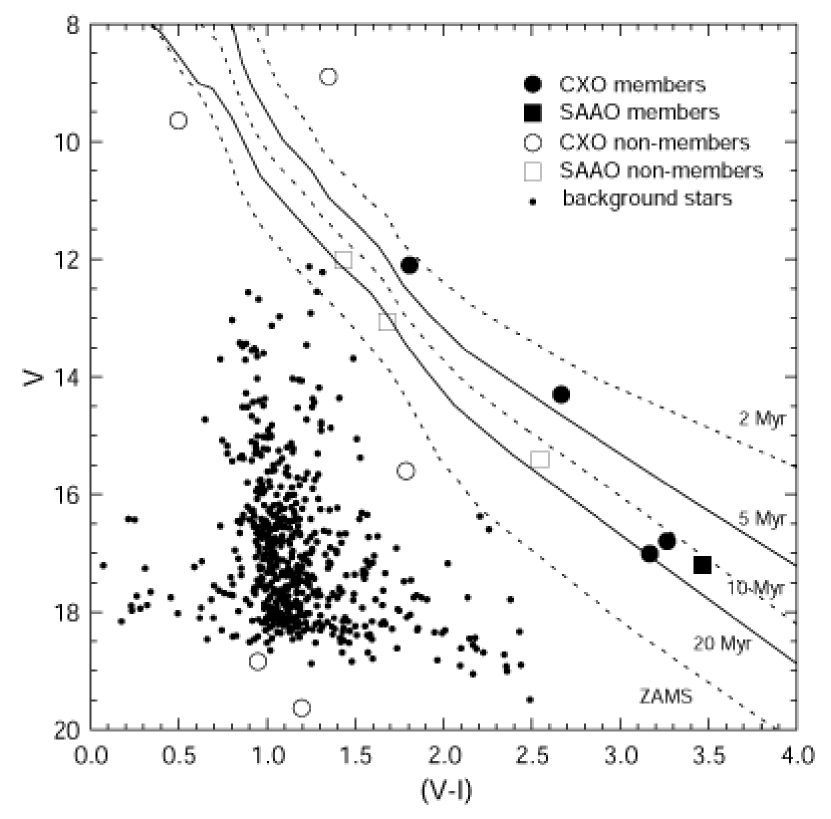
Figure 2 shows the placement of X-ray selected stars from the Chandra field (Table 3) in the () color-mag diagram (open and filled circles) along with several hundred X-ray-faint field stars representative of background sources in the shallow VI survey. The symbols used for these and other stars reflect the outcomes of photometric and spectroscopic studies that we detail in the following sections. We compare the location of these stars to isochrones from the PMS evolutionary models of Siess, Dufour, & Forestini (2000) scaled to a distance of 114 pc; the mean of Hipparcos distances to Cha ( pc) and HD 140237 ( pc). The location of the Chandra stellar counterparts in the color-mag diagram is our first evidence for stellar youth in the X-ray bright stars located nearby Cha and HD 140237, with many of these sources (open and filled circles in Figure 2) located between the 2- and 20-Myr isochrones. This is consistent with an independently estimated age for HD 104237 itself, of around Myr (Table 1).
From Figure 2, we identify two groups of stars for follow-up spectroscopic characterization for signs of stellar youth such as Li 6707 absorption and enhanced optical activity: (i) the X-ray-selected stars; and (ii) field stars with photometry broadly consistent with that of the Chandra counterparts (defined as stars with mags within magnitude, for a given color, of the sequence of Chandra sources proximate to Cha and HD 104237). These latter stars are indicated by the open and filled squares in Figure 2.
4.2 Spectroscopic confirmation
Optical spectroscopy of most of the Chandra stellar counterparts and optical photometric candidates were obtained during 2002 March and 2003 April using the 2.3-m telescope and dual-beam spectrograph (DBS) at Mount Stromlo & Siding Spring Observatories (MSSSO). Using the 1200 line mm-1 grating in the red beam resulted in spectra with coverage from Å at a 2-pixel resolution of 1.1 Å, with the slit projecting 2″ on the sky. For the late-type stars, exposure times of s yielded continuum signal-to-noise ratios of near H. The spectra were reduced using dome flats, bias and Fe-Ar arc frames, making use of standard IRAF routines such as ccdproc.
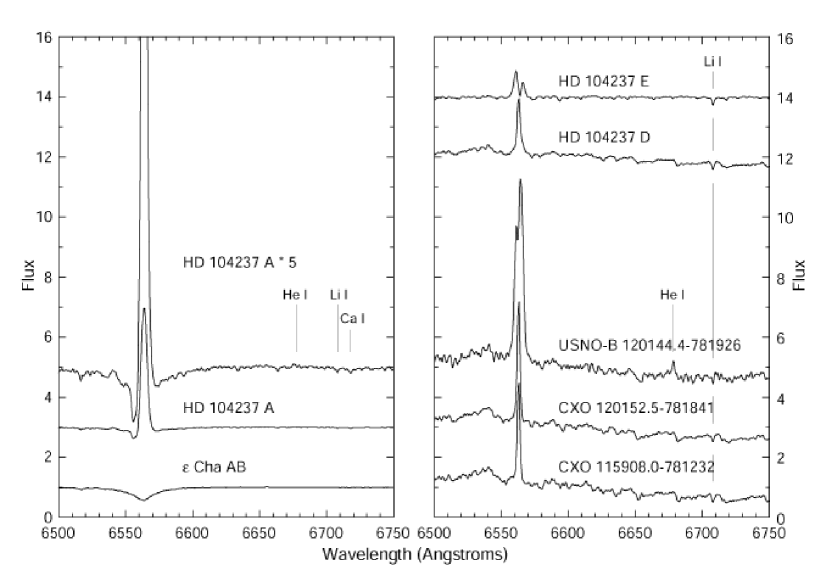
Analysis of the spectra showed four of the Chandra-selected stars were active, lithium-rich late-type objects (Figure 3). An additional T Tauri star not detected by Chandra was identified from the list of photometric candidates. The two optically-bright Chandra sources in the field with proper motions discordant with Cha and HD 104237, CPD 773 and CPD 775, lack detectable Li 6707 (equivalent widths Å), as do the several field stars observed with the DBS that were either detected by Chandra or have photometric properties similar to the Cha/HD104237 group stars. We did not obtain spectroscopy of three very faint Chandra counterparts following the analysis of optical colors showing them not to be late-type stars.
The resulting H and Li-region normalized spectra for Cha, HD 104237 and the five T Tauri stars located within the Chandra field are shown in Figure 3, with H and Li ’s listed in Table 3. Surprisingly, for HD 104237 itself we detect Li I 6707 and nearby lines such as Ca I 6718 that are indicative of a late-type star; we discuss these spectra further in §5.1.
4.3 Rotation and variability studies
For several the candidate stars identified by Chandra and confirmed to be PMS in our early ground-based studies, we obtained multi-epoch differential photometry using the 1.0-m telescope at SAAO during 2002 April and May. Observations were made in the Cousins VRI bands for the central regions of the HD 104237 field, and two distant fields containing late-type sources. For each field, epochs were obtained over 10 nights in ″ conditions. The differential magnitudes for each of the T Tauri stars were determined with respect to local ‘standard stars’ within each CCD field which were found to remain constant to mag. A few of the nightly datasets were also transformed to the standard system via the observation of southern photometric standard stars. Results from this study are presented in 5.1.
5 The Cha young stellar group
We describe here individual stars in the Cha field found by these X-ray and/or optical methods. The running star number, positions, names and optical properties are given in Table 3. The ‘ID Type’ in column 2 summarizes whether a given star is selected as a PMS group member by virtue of its X-ray emission, its location on the PMS photometric isochrone (Figure 2), the presence of H or Li 6707 spectroscopic indicators (Figure 3), and/or Hipparcos astrometric association with Cha/HD 104237 and the OSCA. The ‘Class’ in the final column of Table 3 gives our assessment distinguishing accreting classical T Tauri (CTT) stars from non-accreting stars weak-lined T Tauri (WTT) stars based on the strength and width of the H emission line.
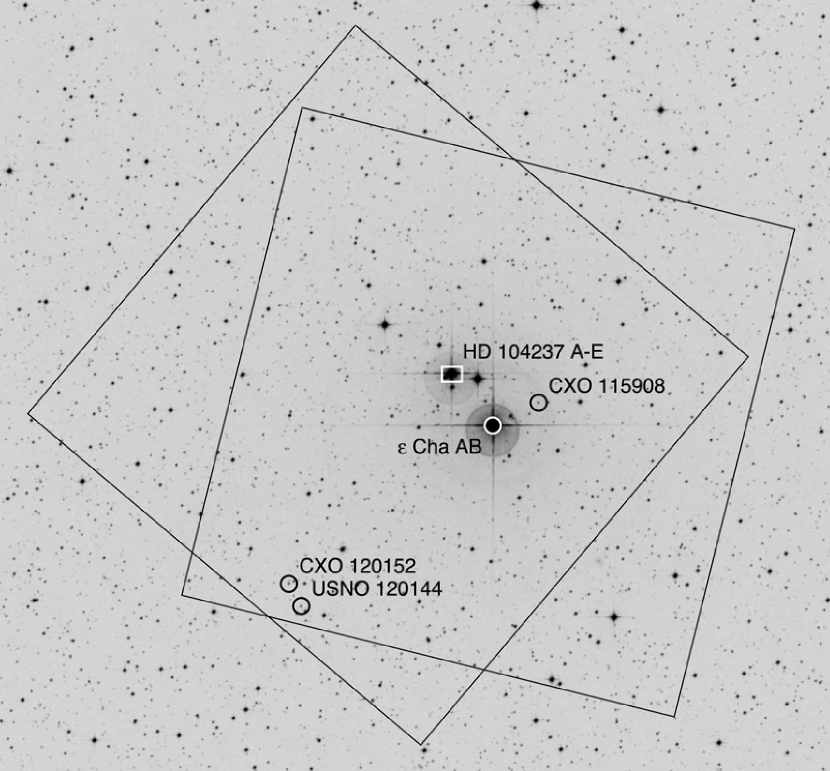
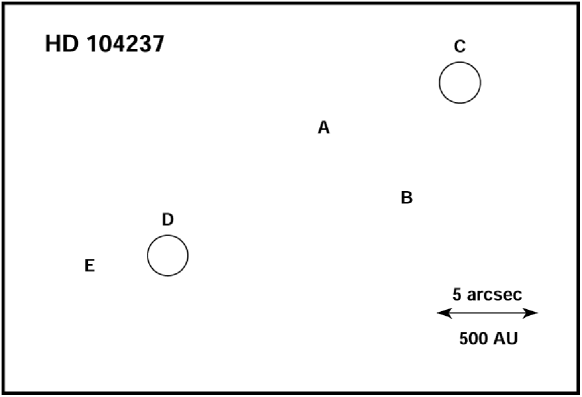
Figure 4 shows the large-scale optical field, and Figure 5 shows the X-ray sources in the immediate vicinity of Cha and HD 104237. X-ray spectra, variability and luminosities are given in Table 5. We give rough mass estimates based on the correlation between X-ray luminosity and mass seen in the large sample of Orion Nebula Cluster stars (see Figure 4 of Feigelson et al. 2003). Stars probably associated with Cha and HD 104237 (confirmed members) and non-members are listed in separate sections of Table 3 and are described below.
5.1 Confirmed members
#1: CXOU 115908.2-781232 Located 2′ WNW of HD 104237 A, red beam DBS spectroscopy shows the star is of M5 spectral type (with an uncertainty of subtype) with Å H emission and very prominent Li 6707 absorption. Its photometric colors () = 1.42 and () = 3.16 are consistent with this spectral type without reddening, and its low X-ray luminosity around erg s-1 is typical for M-type PMS stars. The soft X-ray spectrum with most of the counts below 1 keV is reminiscent of the ultrasoft spectrum of the TW Hya brown dwarf TWA 5B (Tsuboi et al., 2003). Multi-epoch differential photometry obtained at SAAO during 2002 April was inconclusive; the -band data was found to be variable at the 2 level compared to stars of similar brightness within the CCD field (1 mag at ).
#2: Cha AB The star shows strong H absorption ( Å) and has photometry consistent with the established spectral type of B9V given in the SIMBAD database. The star is a cataloged binary consisting of components with visual magnitudes of 5.4 (A) and 6.1 (B) with separation variously reported between 0.45″ and 1.9″ (ESA, 1997; Worley & Douglass, 1997; Dommanget & Nys, 2002). Assuming Cha A is spectral type B9 without significant reddening, then Cha B is an early-A star (and we adopt here A1). The projected separation of AU implies a many century-long period. However, the star is a radial velocity variable on far shorter timescales, inferring a higher order of multiplicity. Buscombe (1962) lists four velocities obtained over 120 days that vary between and km s-1, and an older measurement of km s-1. As further evidence of multiplicity, HR diagram placement of Cha A (Figure 6) suggests the star is over-luminous compared to other group members (see §5.3). The absence of any X-ray emission gives a very low limit of erg s-1 ( ACIS counts). This strongly suggests the Cha system contains no late-type PMS companions above mid-M. This conclusion is supported by inspection of the DBS red spectrum; no late-type stellar features are evident in the H region. With its over-luminosity and absence of late-type companion, we suggest that Cha A is an unresolved binary between two BA-type stars, and thus the Cha system in its entirety may have three BA-type stars.
#3: HD 104237 C This and the following source lie within 5″ of HD 104237 A and could not be seen with the acquisition camera of the MSSSO 2.3-m in grey conditions in ″ seeing. They are also not listed in either the USNO-B1.0 or 2MASS catalogs. We therefore provide here no optical information for these sources. Component C, lying 5″ to the NW, was variable in X-rays: all 6 of its events appeared during the second epoch exposure. Its low X-ray luminosity is consistent with a PMS M-type star or brown dwarf.
#4: HD 104237 B Component B lies in the wings on the W side of HD 104237 A’s point spread function. Its X-ray luminosity of erg s-1 is typical of a late-K or early-M star. This star may be the origin of the K-type spectral features seen in HD 104237 A (see below). An additional X-ray component may also be present; a weak source to the North of components A and B residing within A’s point spread function. In this particular case, we can not be confident of its existence or properties and do not assign it a component letter. A longer exposure giving sufficient signal for subarcsecond deconvolution (see, for example, the procedures in Tsuboi et al. 2003) might clearly resolve this close component.
#5: HD 104237 A Spectroscopy of the HD 104237 primary shows H in emission as expected for an HAeBe star, with Å. van den Ancker et al. (1997) finds mag for the star. Given the lack of absorption in most of the other Cha members described here, we suggest this absorption arises in the immediate environment (e.g., inflow, outflow or disk) of this star. Surprisingly, we also detect cool star features indicative of a K-type T Tauri star: Li I 6707 and Ca I 6718 are clearly detected in the expanded spectrum of Figure 3. Assuming a typical Ca I equivalent width for K-type stars of Å, we find a similar for the Li I 6707 line. The DBS spectrum was obtained along Position Angle (PA) = 182∘ with a slit projection on the sky of 2″. It seems likely that we have detected component B (or possibly a closer component). We tentatively associate a ‘K:’ spectral type to component B for this reason in Table 3.
#6: HD 104237 D This star, 10″ ESE of the HAeBe star, is also invisible in on-line Digital Sky Surveys, but was clearly distinguished with the acquisition cameras of the 1.0-m telescope at SAAO and the 2.3-m telescope at MSSSO. DBS spectroscopy indicates a spectral type of M3 with weak H emission and strong Li I 6707 absorption. SAAO colors are () = 1.19 and () = 2.66 with uncertainties of mag because of the strongly variable background from HD 104237 A. The 2MASS photometry for this star carries confusion flags due to the proximity of HD 104237 A, and is therefore not listed in Table 3. Within the uncertainty in the spectral type and the photometry, reddening is negligible for HD 104237 D. Multi-epoch photometry from SAAO during 2002 April provides little information on the variability of the star; the nearby bright HAeBe star spoiled most of the photometric observations which typically suffered ″ seeing. However, several epochs obtained in ″ conditions suggested low photometric variability over the 10 day time interval of the observations. The X-ray emission also did not change between our two widely-spaced observations. Its luminosity of erg s-1 is consistent with that expected from an early-M PMS star, and its spectrum (as with member #1) appears unusually soft.
#7: HD 104237 E The star is clearly resolved from HD 104237 A in POSS-2 scans of the field. Spectroscopy obtained with the MSSSO 2.3-m telescope and both the red ( at H; see Figure 3) and blue beams ( at 4500 Å) of the DBS spectrograph show the star is an early K-type star. We adopt here a spectral type of K3. The red beam spectrum shows strong Li I 6707 absorption with Å and weak but broad H with strong self-absorption. The H Å, and is Å if we ‘correct’ for the self-absorption signature. While the unabsorbed H is below the historical 10 Å separator WTT and CTT stars, it lies above the Å boundary suggested by White & Basri (2003) for accreting K-type stars. The velocity width is km s-1 at the level 10 percent above the surrounding continuum, strongly suggestive of on-going accretion from a circumstellar disk.
Photometry obtained at SAAO shows the star is highly variable on a 2.45 day period with VRI values at maximum light of , () = 0.83 and () = 1.80. Adopting intrinsic colors (for main sequence stars) from Kenyon & Hartmann (1995) and the extinction corrections of Bessell & Brett (1988), we find mag. (We plot the measured colours of the star in Figure 2, and the de-reddened luminosity in Figure 6.) In this respect, HD 104237 E is distinct from all the other T Tauri stars associated with Cha and HD 104237 A which show little or no optical reddening, including the very nearby HD 104237 D. Similarly, the X-ray spectrum of HD 104237 E uniquely shows significant soft X-ray absorption (Table 5). The best fit gives cm-2, equivalent to . The star was also highly variable in X-rays with an 8-fold difference between the first to second epochs. At its peak and corrected for absorption, its X-ray luminosity exceeded that of the HAeBe primary HD 104237 A.
The optical reddening and X-ray absorption for this star suggests that we are viewing the surface of HD 104237 E through local intervening material. While it could be associated with patchy interstellar cloud material (dust emitting weakly at 100 is seen with within 10′ of HD 104237; Knee & Prusti 1996), we suspect it arises from material within the stellar system. The 2MASS photometry for this star has either upper limits or confusion flags, and is not listed in Table 3. A future study will detail the variability and nature of this star.
#8: USNO-B 120144.7-781926 The star was outside the original photometric field surveyed at SAAO during 2002 January, but was found during 2002 April in a field centered on nearby CXOU 120152.8-781840.9. The star resides near the edge of the Chandra field, but was undetected in X-rays, indicating log erg s-1. It was observed spectroscopically because it has photometric properties similar to several of the Chandra-selected late-type members. DBS spectroscopy obtained in 2003 April confirms the star is an active M5 spectral type PMS star with optical classical T Tauri star characteristics such as strong H ( Å) and He I emission at 6678 Å. Lithium is present as levels typical for T Tauri stars ( Å). Analysis of the optical and 2MASS photometry suggests no significant -band excess. Multi-epoch photometry obtained in 2002 April indicates the star is highly variable with amplitude of mag but with no detected periodicity probably due to undersampling of the light curve.
#9: CXOU 120152.8-781840 DBS spectroscopy shows the star is of M5 spectral type with moderately strong H emission and Li I 6707 absorption. VRI photometry indicates () = 1.49 and () = 3.26, consistent with the spectral type estimate. Our multi-epoch photometric observations indicate no significant level of variability compared to field stars of similar magnitude. The X-ray emission was low, typical for PMS M stars, but probably variable with 14 of 21 events arriving in the first epoch.
5.2 Non-members
CPD -77o773 The H line is seen weakly in absorption and Li I 6707 is undetected, indicating this star is not PMS. Our DBS spectroscopy and SAAO photometric color ( = 1.34) is consistent with the star being a early K-type giant. The SIMBAD lists a spectral type of K0.
CPD -77o775 The H line is strongly in absorption and Li I 6707 is undetected, again indicating the star is older than PMS. Our spectroscopy and color ( = 0.49) indicates the star is a (possibly mildly reddened) early F-type dwarf, supporting the SIMBAD spectral type of F0.
CXOU 120118.2-780252 Located near the North edge of the Chandra field, the star is a weak but highly variable X-ray source; all 17 of its photons arrived during the second Chandra snapshot. DBS spectroscopy shows the star is a late K-type star, with weak H emission ( Å) and no detection of lithium. For its spectral type, the star is mag too faint to be associated with the Cha PMS stellar group. If the star is main-sequence, it lies at a distance of pc.
Three faint Chandra counterparts Optical CCD study of the faint counterparts associated with CXOU 115942.2-781836, CXOU 120101.4-780618 and CXOU 120135.3-780427 shows none have photometric properties consistent with late-M stars or brown dwarfs associated with Cha and HD 104237. VRI photometry obtained for these objects at SAAO during 2003 April indicate colours consistent with early K-type dwarfs. None of these objects were observed with the DBS spectrograph. If main-sequence K stars, they must lie at distances of kpc inferring unrealistically high log erg s-1. If instead these objects are active galaxies, they are unresolved at the 1.5″ resolution of the SAAO CCD images.
Three additional photometric candidates The final three stars in Table 3 have magnitudes that, for their () colour, fell within mag (fainter) of the sequence of Chandra-detected late-type stars in the Cha/HD 104237 field. We observed them with the DBS spectrograph and found two early K and one early M star. None were active, lithium-rich objects; all are likely field giants.
5.3 An HR diagram for the Cha group
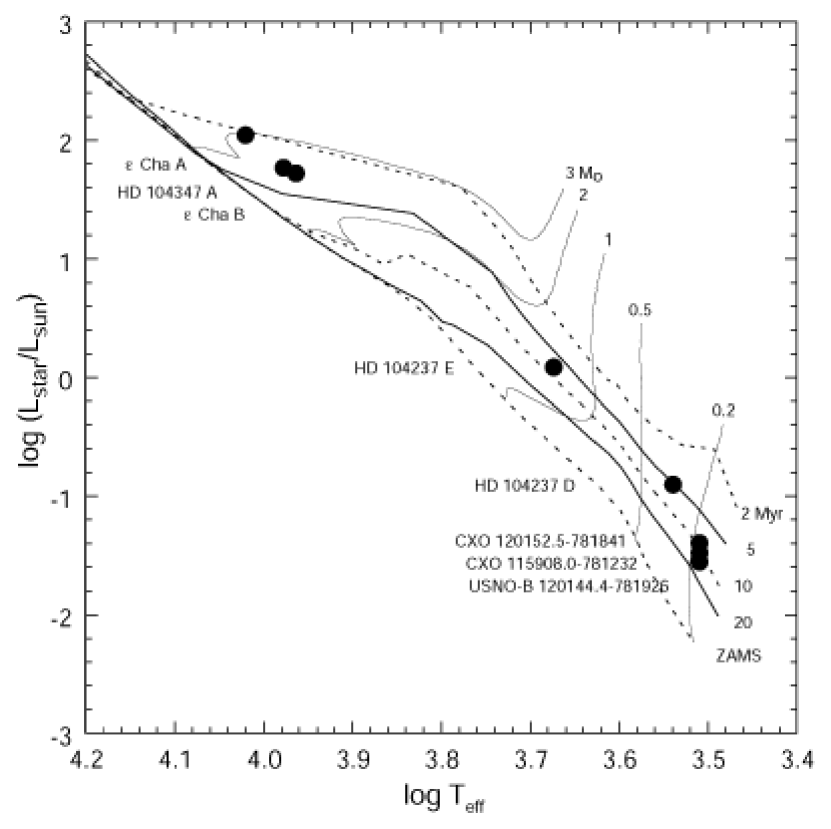
Based on these photometric and spectroscopic characterizations of the PMS stars associated with Cha and HD 104237, we produce in Figure 6 an HR diagram of group members. The spectral type- and bolometric correction sequences for main-sequence stars given by Kenyon & Hartmann (1995) are used. Locations of the Cha group stars are compared to the PMS evolutionary grids of Siess, Dufour, & Forestini (2000) from which several isochrone and isomass lines are shown.
We find that the HAeBe star HD 104237 A and Cha B lie near the 3 Myr isochrone, and the two well-characterised companions to HD 104237 A, HD 104237 D and E, lie near the 5 Myr isochrone. Since Chandra imaging and DBS optical spectroscopy for HD 104237 A shows evidence for one (or maybe two) very nearby late-type companions, its position in the HR diagram is likely slightly elevated. It is also dependent on the quality of the reddening estimate ( mag) given by van den Ancker et al. (1997) which we have applied to HD 104237 A444 Our Myr estimate for Cha B and the HD 104237 A-E system using Siess, Dufour, & Forestini (2000) tracks can be compared to the 2 Myr estimate given by van den Ancker et al. (1997) for HD 104237A using Palla & Stahler (1993) tracks. Along with the observational considerations discussed above, the age difference is also likely model dependent. Comparing several sets of PMS evolutionary grids to the HR diagram location of members of the Myr-old Cha cluster, Lawson & Feigelson (2001) found the more-recent Palla & Stahler (1999) models gave factor of younger inferred ages for early-type stars compared to the Siess, Dufour, & Forestini (2000) models..
In Figure 6, we show Cha AB as an B9+A1 system with a 0.7 mag brightness difference. As noted in §5.1, Cha A appears to be elevated in luminosity (and therefore appears younger) compared to the isochronal locus of Cha B, HD 104237 A, HD 104237 D and HD104237 E. The discrepant position of Cha A may be grid dependent or, as discussed in §5.1, that it is a close binary itself with detected radial velocity variations. We thus suspect that Cha A consists of two components which fall near the Myr isochrones.
The three active, lithium-rich M5 stars (CXOU 115908.2-781232, USNO-B 120144.7-781926 and CXOU 120152.8-781840) appear systematically older than the stars of earlier spectral type. Their HR diagram placement implies an age of Myr. In considering the ages of these stars compared to other group members, we discuss two possibilities:
-
1.
The star-grid comparison may be flawed for late-M stars. Here comparison with the Myr-old Cha cluster stars is valuable. Lawson & Feigelson (2001) found the grids of Siess, Dufour, & Forestini (2000) best achieved coevality across the then-known Cha cluster population ranging from spectral types B8–M3. Since then, on-going study of the cluster stellar population has discovered several M4–M5 stars residing ′ of the cluster center that appear older than earlier-type cluster members when compared to Siess, Dufour, & Forestini (2000) tracks (Lyo et al., 2003b). In the Cha cluster, the age discrepancy appears rapidly for stars with () ; i.e. for stars later than M3 (or K). The same phenomenon appears in the late-type Cha stars. We suggest a variety of possible causes: a deficient temperature calibration, either in the models or in the application of the Kenyon & Hartmann (1995) main-sequence temperature calibration to PMS stars; an incorrect treatment of the stellar luminosities perhaps due to the large bolometric corrections required to transform the observations; or theoretical errors in the treatment of opacities in the M star models.
-
2.
It is likely that the rich Myr old OSCA subgroups have evaporated members into the Chamaeleon vicinity (Blaauw, 1991; de Geus, 1992). If we make the hypothetical and optimistic assumption that half of subgroup members have dispersed into a halo across the region of the sky shown in Figure 1, then a typical Chandra ACIS observation will contain on average only OSCA PMS stars. This explanation is clearly inadequate to explain three M stars in the Cha/HD 104237 ACIS field. We conclude that these three stars are probably Cha group members and thus coeval with the higher mass members.
In summary, the Cha PMS stellar group currently consists of: Cha with two confirmed, and quite possibly a third, late-B/early-A stars within AU; HD 104237 with an A stars and four confirmed (and possibly a fifth) late-type companions within AU; and three mid-M stars distributed over pc. Our best estimate for the group age is Myr.
6 PMS stars around the other Herbig Ae/Be stars
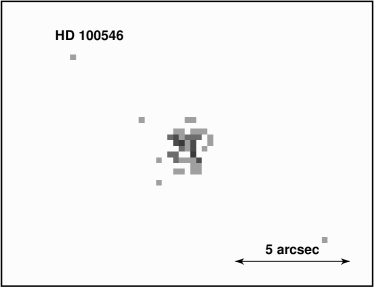
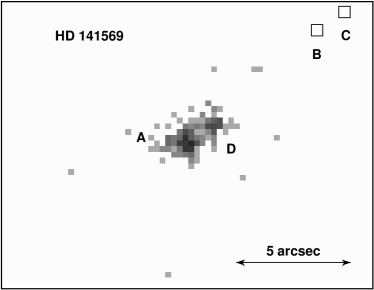
Figure 7 and Table 5 summarize the X-ray results within 1000 AU of the four other HAeBe targets, and Table 4 gives X-ray sources likely associated with stars in the full ACIS fields. We have not made any optical study of these fields.
Table 4 shows that three of the four HAeBe stars each have several likely stellar X-ray sources dispersed in the ACIS fields; i.e. with projected distances AU and pc of the targeted HAeBe star. HD 141569 is the exception with no additional stellar X-ray sources. This is easily interpretable by reference to their global positions with respect to the OSCA shown in Figure 1: HD 100546, HD 150193 and HD 152404 lie within the traditional boundaries of the rich OSCA subgroups while HD 141569 does not. These new X-ray stars are thus likely members of the OSCA, and we suspect they are not dynamically linked to the HAeBe stars.
Details on these proposed OSCA X-ray stars are given Table 4 and its notes. They include: several unstudied late-type stars with around HD 100546 in LCC subgroup; the CTT star CXOU 163945.5-240202 = IRAS 16367-2356 in the Ophiuchi cloud complex; the late-type star CXOU 164031.3-234915 and its (probably) intermediate-mass companion also in the Ophiuchi cloud complex; CXOU 165430.7-364924 = HD 152368 (B9V) and a probable late-type companion in the UCL subgroup.
Stars in the immediate vicinity of the HAeBe targets are as follows. Recall that we have made ″ alignments of the images assuming the brightest source is coincident with the primary, which may not always be correct.
HD 100546 The image shows a single source with modest emission around erg s-1 typical of PMS K stars (Feigelson et al., 2003). The photon distribution appears slightly extended from the usual point spread function, but any multiplicity must lie within 1″ of the primary555The disk of HD 100546 is seen in scattered light out to 4″ and in millimeter emission out to ″, extended in the SE-NW direction (Clampin et al., 2003; Henning et al., 1998).. Several non-X-ray-emitting stars lies within 10″ of the primary, but these are most likely background stars unrelated to the HAeBe star (Grady et al., 2001).
HD 141569 This system is clearly resolved into two components separated by 1.5″ along PA = 300∘ where the secondary to the NW is only slightly fainter than the primary666There is a hint of a third component 0.7″ from the primary along P.A. 90∘ with around 10 photons, but it can not be clearly discriminated from the wings of the primary point spread function.. The projected separation is 150 AU. We call this component ‘D’ because two other companions ‘B’ and ‘C’, established to share the primary’s proper motion, have been found in optical images (Weinberger et al., 2000). From their HR diagram locations, the estimated masses of components B and C are 0.45 M⊙ and 0.22 M⊙ respectively with age of 3 Myr. The high X-ray luminosity of HD 141569 D, erg s-1, suggests a mass around . The absence of components B and C from the Chandra image is not surprising, as a large fraction of the Orion Nebula M-type stars fall below the erg s-1 sensitivity limit of the brief exposure available here (Feigelson et al., 2003).
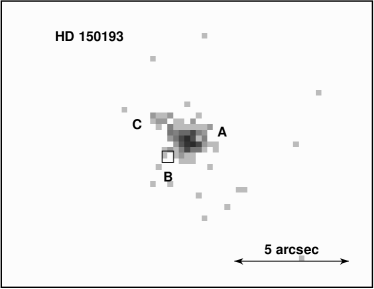
HD 150193 This source is also double with a component ‘C’ lying 1.5″ from the primary along PA = 55∘. The projected separation is 220 AU. Although its X-ray emission is times fainter than that of the primary, the luminosity is still consistent with a M⊙ PMS star. The Chandra image does not show component ‘B’ (unknown spectral type) 1.1″ to the SW of the primary reported from K-band imagery (Pirzkal, Spillar, & Dyck, 1997).
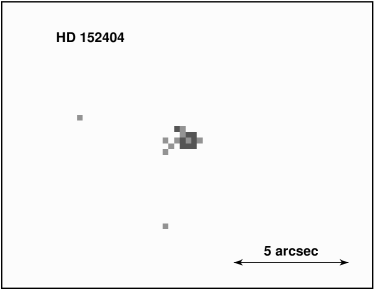
HD 152404 This source is weak and unresolved in the image. It is a double-lined spectroscopic binary with period 13.6 days and eccentricity 0.47 (Andersen et al., 1989). The spectral type is F5 IVe and the components have equal masses around 1.5 M⊙.
7 Discussion and Concluding Remarks
7.1 The multiplicity and X-ray emission of Herbig Ae/Be stars
Chandra imagery is clearly a useful complement to high-resolution optical and near-infrared imagery and spectroscopy in the study of the multiplicity (i.e. companions within AU) of intermediate-mass PMS stars. In the X-ray band, the primary is not orders of magnitude brighter than the companions so that coronographic methods are not necessary. Combining the results of § with optical-infrared studies, we find a quintet (or possibly sextet) in HD 104237, a quartet in HD 141569, a triple in HD 150193, a double in HD 100546, and a single in HD 152404. Half of these companions were discovered in the Chandra images. If the primary’s X-ray emission arises from an unresolved lower mass companion (see below), then the multiplicity of each star is increased by at least one. imagery is limited in two respects: it detects only a fraction of PMS M-type and brown dwarfs (though it should be nearly complete for higher mass stars if sensitivities reach erg s-1; Feigelson et al. 2003); and it can not resolve companions closer than ″ from the primary.
The X-ray emission from intermediate-mass HAeBe stars, and AB stars in general, has been a long-standing puzzle as stars without outer convection zones should not have a magnetic dynamo of the type known in lower mass stars. Recent images of nearby main sequence B stars have confirmed that, in at least 4 of 5 cases, that the emission arises from late-type companions (Stelzer et al., 2003). For HAeBe stars, it has been debated whether the X-rays are from companions or are produced by the primary through star-disk magnetic interaction (Zinnecker & Preibisch, 1994; Skinner & Yamauchi, 1996).
Our results do not clearly solve this puzzle. The five primary HAeBe stars observed here have X-ray luminosities in the range erg s-1 in the keV band with plasma energies in the range keV. These properties are consistent with intermediate-mass Orion Nebula Cluster A- and B-type stars, most of which are probably not actively accreting, as well as solar-mass PMS stars (Feigelson et al., 2002). Our images show that some of the X-rays attributed to HAeBe stars from low resolution and studies are produced by resolved stellar companions, but most of the emission still arises from within 1″ of the primary. This could be either a close unresolved companion or the accreting primary itself. In the former case, the companion must have roughly M⊙ because substantially lower mass stars are fainter with X-ray luminosites in the to erg s-1 range (Feigelson et al., 2003). In the latter case, the mechanism of HAeBe X-ray production must give X-ray properties essentially indistinguishable from those of solar-mass PMS stars.
7.2 HD 104237 as a bound high multiplicity stellar system
At least a quintet, HD 104237 is the highest multiplicity HAeBe star known. The majority of HAeBe stars lie in binaries (Leinert, Richichi, & Haas, 1997; Pirzkal, Spillar, & Dyck, 1997; Corporon & Lagrange, 1999) and a few are in triple systems (TY CrA, Casey et al. 1995; NX Pup, Brandner et al. 1995). Several quartet of lower-mass PMS stars have been found including GG Tau, UZ Tau, UX Tau, V773 Tau, HD 98800 and BD +26∘718B. It is very unlikely that any of the companions HD 104237 B-E seen in the image appears projected so close to the primary by chance: % for a randomly located PMS star or (for components B and C without optical spectroscopic confirmation) % for a randomly located extragalactic X-ray source.
The system must be bound. If the stars were formed independently with the km s-1 velocity dispersion characteristic of small molecular clouds (Efremov & Elmegreen, 1998), it would disperse within a few thousand years. Unlike many other multiple systems (like HD 98800, GG Tau and Castor), the HD 104237 components do not exhibit a hierarchical orbital structure of two or three close binary pairs. Due to the fragility of its orbits, we can infer that the HD 104237 system as a whole has not been ejected from some larger stellar aggregate but rather was born in a dynamically quiescent environment (Kroupa, 1998).
Perhaps of greatest interest, the HD 104237 quintet has apparently not suffered from serious internal dynamical instabilities during the orbits of its Myr lifetime. Instabilities leading to ejection of some members are thought to be common in multiple PMS systems (e.g. Sterzik & Durisen 1995, 1998; Reipurth 2000). In their dynamical calculations of stellar systems with realistic mass distributions, Sterzik & Durisen (1998) find that 98% of quintiple systems with an intermediate-mass primary will eject two or more members within 300 orbits. Also, the disks of at least two of its constituent stars – HD 104237 A and E – have not been destroyed as expected from close dynamical encounters (Armitage & Clarke, 1997). HD 104237 thus appears to be an unusually stable high multiplicity system, probably born under quiescent conditions in the low density environment of a small molecular cloud.
7.3 Large-scale environment of the Cha group
On a scale, the interstellar environment is relatively free of molecular material between the Cha I and Cha II clouds, which have 1000 M⊙ and 1900 M⊙ of molecular gas and lie at distances of 160 pc and 180 pc respectively (Mizuno et al., 2001). The Cha group lies in front of a dusty screen that covers the entire Chamaeleon/Musca region at a distance of 150 pc (Franco, 1991; Knude & Hog, 1998). On a smaller (10′) scale, three small clumps of CO and far-infrared emission are found between and west of Cha and HD 104237 (Knee & Prusti, 1996). These cloudlets are probably translucent with masses below 0.5 M⊙.
Recent studies report young stars on large-scales that may be associated with the compact Cha group discussed here. Sartori, Lépine, & Dias (2003) place Cha and HD 104237 on the near edge of a proposed new Chamaeleon OB association with 21 identified B- and A-type stars spread over ( pc). This new grouping appears as a nearly continuous extension of the well-known US-UCL-LCC OSCA subgroups. Mamajek (2003) criticizes this finding on the grounds that there is no overdensity of B stars in this region and the derived velocity dispersion is consistent with random field stars. Blaauw (1991) had earlier suggested an extension of the LCC subgroup B stars into the Carina-Volans region next to Chamaeleon. From an extensive spectroscopic survey of later-type southern stars, Quast et al. (2003) define a stellar association called “ Cha A” with at least 15 K-type members spanning in Chamaeleon. These stars are Li-rich with ages around 10 Myr. Here again, it is difficult to distinguish between members of the proposed new grouping and an extended or evaporating LCC subgroup. Frink et al. (1998) previously reported 7 comoving T Tauri stars over a subregion of this association around Cha, but with different kinematic properties.
We do not derive a clear view of the large-scale young stellar environment of Cha from these confusing reports. Many young stars are present, but it is difficult or impossible to distinguish distinct clusters from the profusion of outlying and evaporated stars likely to surround the rich Oph-US-UCL-LCC OSCA concentrations. For the brighter B- and A-type stars, it is also difficult to distinguish Myr stars physically associated with the OSCA from somewhat older field stars unless late-type companions can be found and characterized.
7.4 Origin of the Cha group
The link between the brightest members Cha and HD 104237 as comoving, likely coeval PMS stars has been repeatedly discussed in the past (Hu et al., 1991; Knee & Prusti, 1996; Shen & Hu, 1999; Mamajek, Lawson, & Feigelson, 2000). But there has been debate regarding their origin. Writing before Hipparcos parallactic measurement of 114 pc was available for the group, Knee & Prusti (1996) suggested the system lies around 140 pc away and the nearby interstellar cloudlets were part of the Cha II star forming region. Writing after the release of measurements, Eggen (1998) showed that the system is more likely a member of the Local Association (which includes the OSCA), though he does not list it as a OSCA member. We establish (Mamajek et al. 2000 and Table 1) that the extrapolated motions of HD 104237 and Cha lie within 10 pc of (within measurement errors, consistent with exact coincidence with) the centroid of OSCA subgroups in the past Myr.
We believe that this kinematic link between the Cha group and the OSCA is reasonably convincing evidence that they originated in the same giant molecular cloud. The question then arises why HD 104237 is judged from its HR diagram location to have an age far younger than the nearest OSCA subgroup: based on isochrones in the HR diagram, we find an age of Myr for the Cha group (§5.3) while the UCL subgroup has age of 17 Myr (Mamajek, Meyer, & Liebert, 2002). The same question can be raised about the Cha cluster which, with age no older than 9 Myr (Lawson et al., 2001; Lawson & Feigelson, 2001), is younger than the nearest OSCA subgroup, the LCC with age of 16 Myr.
Such age discrepancies can be explained within the dispersal scenario outlined by Feigelson (1996). The scenario is based on the dispersion of different portions of a giant molecular cloud along velocity vectors established by turbulence processes. Some portions of the cloud complex form rich stellar clusters relatively early and dissipate their molecular material soon afterwards (Kroupa, 2000). Other portions of the complex remain as gaseous clouds as they disperse, forming stars at different times and far from the OB-rich environments of the larger clusters. This corresponds to the supervirial cloudlet regime, where and cloudlets fly apart without collisions, in the recent hydrodynamical study by Gittins, Clarke, & Bate (2003). Thus relatively young sparse groups, like those around Cha and Cha, may be found in the vicinity of older clusters like the OSCA subgroups. Some of these dispersed groups may be compact (like the Cha and Cha groups) due to smaller local values of , while other groups with higher may themselves appear widely dispersed (like the TW Hya Association and Pic moving group; see §2 and Figure 1). However, all of these systems would share space motions converging onto the same ancestral giant molecular cloud.
7.5 Comparison of the Cha and Cha groups
We have now made considerable progress in characterizing the populations of two nearby sparse PMS stellar clusters dominated by intermediate-mass stars and lying on the outskirts of a large and rich OB association:
-
1.
The Cha cluster has three intermediate-mass systems: the B8 star Cha probably (due to its ROSAT X-ray detection) with a low mass companion; RS Cha, a A7+A8 hard binary with a likely lower mass companion; and the single A1 star HD 75505 (Mamajek, Lawson, & Feigelson, 2000). These three systems have projected separations pc. They are accompanied by 14 late-type primaries of which several are binaries (Lyo et al., 2003b). Disks are prevasive in the cluster: two of the intermediate-mass systems ( Cha and HD 75505) have weak -band excesses; of the late-type members have both IR excesses and optical signatures of active accretion; and additional late-type members have weak -band excesses (Lawson et al., 2002; Lyo et al., 2003a).
-
2.
The Cha group has two intermediate-mass systems: Cha with two or three A0 stars, and HD 104237 with at least 4 lower-mass companions. Due to the absence of X-ray emission, we infer that Cha does not have any lower-mass companions above M⊙. These high-multiplicity systems have a projected separation of 0.07 pc. The group also has three M5 stars distributed over 0.5 pc. Three members – HD 104237 A, HD 104237 E and USNO-B 120144.4-782936 – have CTT-type optical emission lines indicating active accretion. This group has not been surveyed in the band like Cha, so the apparent lower disk fraction may not be real.
These stellar systems are quite similar, and together paint a portrait of member groups several million years after their formation. In each group, the total stellar mass is about M⊙ and the size is pc, giving an escape velocity of km s-1. As this is about the expected velocity dispersion inherited from the molecular material (§7.2), the outlying members of the groups could be unbound. It is likely that the original census was considerably higher and many members of the original clusters have already escaped into the stellar field. The survival of so many high-multiplicity systems and disks in these sparse groups implies that little or no close dynamical interactions have occurred among the stars.
Acknowledgements: We thank A-R. Lyo (UNSW@ADFA) for her very capable assistance with the optical spectroscopy, and L. Crause (Cape Town) for her expert reduction of the optical photometry. J. Skuljan (Canterbury) and E. Mamajek (Arizona) provided helpful assistance with kinematical calculations, and P. Broos and L. Townsley (Penn State) developed critical Chandra data analysis tools. E. Mamajek (Arizona), C. Torres (LNA Brazil) and an anonymous referee suggested helpful improvements to the manuscript. We thank the SAAO and MSSSO Telescope Allocation Committees for observing time, and EDF appreciates the University of New South Wales and Australian Defence Force Academy for hospitality during much of this work. We greatly benefitted from the SIMBAD, 2MASS and USNO databases. This study was supported by NASA contract NAS-8-38252 (GPG, PI) and UNSW@ADFA URSP, FRG and SRG research grants (WAL, PI).
References
- Adams & Myers (2001) Adams, F. C. & Myers, P. C. 2001, ApJ, 553, 744
- Andersen et al. (1989) Andersen, J., Lindgren, H., Hazen, M. L., & Mayor, M. 1989, A&A, 219, 142
- Armitage & Clarke (1997) Armitage, P. J. & Clarke, C. J. 1997, MNRAS, 285, 540
- Aspin & Barsony (1994) Aspin, C. & Barsony, M. 1994, A&A, 288, 849
- Barbier-Brossat & Figon (2000) Barbier-Brossat, M. & Figon, P. 2000, A&AS, 142, 217
- Blaauw (1964) Blaauw, A. 1964, ARA&A, 2, 213
- Blaauw (1991) Blaauw, A. 1991, in The Physics of Star Formation and Early Stellar Evolution, C. J. Lada & N. D. Kylafis eds., NATO ASI, Dordrecht:Kluwer, 125
- Bodenheimer et al. (2000) Bodenheimer, P., Burkert, A., Klein, R. I., & Boss, A. P. 2000, in Protostars and Planets IV, 675
- Bonnell & Clarke (1999) Bonnell, I. A. & Clarke, C. J. 1999, MNRAS, 309, 461
- Bonnell (2000) Bonnell, I. A. 2000, ASP Conf. Ser. 198: Stellar Clusters and Associations: Convection, Rotation, and Dynamos, 161
- Boss (2002) Boss, A. P. 2002, ApJ, 568, 743
- Bouvier et al. (1993) Bouvier, J., Cabrit, S., Fernandez, M., Martin, E. L., & Matthews, J. M. 1993, A&A, 272, 176
- Brandner et al. (1995) Brandner, W., Bouvier, J., Grebel, E. K., Tessier, E., de Winter, D., & Beuzit, J.-L. 1995, A&A, 298, 818
- Brandner & Koehler (1998) Brandner, W. & Koehler, R. 1998, ApJ, 499, L79
- Buscombe (1962) Buscombe, W. 1962, MNRAS, 124, 16
- Casey et al. (1995) Casey, B. W., Mathieu, R. D., Suntzeff, N. B., & Walter, F. M. 1995, AJ, 109, 2156
- Clampin et al. (2003) Clampin, M. et al. 2003, AJ, 126, 385
- Clarke, Bonnell, & Hillenbrand (2000) Clarke, C. J., Bonnell, I. A., & Hillenbrand, L. A. 2000, in Protostars and Planets IV, V. Mannings et al. eds., Tucson:University of Arizona Press, 151
- Corporon & Lagrange (1999) Corporon, P. & Lagrange, A.-M. 1999, A&AS, 136, 429
- de Bruijne (1999) de Bruijne, J. H. J. 1999, MNRAS, 310, 585
- de Geus (1992) de Geus, E. J. 1992, A&A, 262, 258
- de Zeeuw et al. (1999) de Zeeuw, P. T., Hoogerwerf, R., de Bruijne, J. H. J., Brown, A. G. A., & Blaauw, A. 1999, AJ, 117, 354
- Dommanget & Nys (2002) Dommanget, J., & Nys, O. 2002, Observations et Travaux, 54, 5 (available at http:/vizier.u-strasbg.fr)
- Duquennoy & Mayor (1991) Duquennoy, A. & Mayor, M. 1991, A&A, 248, 485
- Efremov & Elmegreen (1998) Efremov, Y. N. & Elmegreen, B. G. 1998, MNRAS, 299, 588
- Eggen (1998) Eggen, O. J. 1998, AJ, 116, 1314
- Elmegreen & Lada (1977) Elmegreen, B. G. & Lada, C. J. 1977, ApJ, 214, 725
- Elmegreen et al. (2000) Elmegreen, B. G., Efremov, Y., Pudritz, R. E., & Zinnecker, H. 2000, in Protostars and Planets IV, V. Mannings et al. eds., Tucson:University of Arizona Press, 179
- ESA (1997) ESA 1997, in The Hipparcos and Tycho Catalogues, SP-1200 (available at http:/vizier.u-strasbg.fr)
- Feigelson (1996) Feigelson, E. D. 1996, ApJ, 468, 306
- Feigelson & Lawson (1997) Feigelson, E. D. & Lawson, W. A. 1997, AJ, 113, 2130
- Feigelson & Montmerle (1999) Feigelson, E. D. & Montmerle, T. 1999, ARA&A, 37, 363
- Feigelson et al. (2002) Feigelson, E. D., Broos, P., Gaffney, J. A., Garmire, G., Hillenbrand, L. A., Pravdo, S. H., Townsley, L., & Tsuboi, Y. 2002, ApJ, 574, 258
- Feigelson et al. (2003) Feigelson, E. D., Gaffney, J. A., Garmire, G., Hillenbrand, L. A., & Townsley, L. 2003, ApJ, 584, 911
- Franco (1991) Franco, G. A. P. 1991, A&A, 251, 581
- Freeman et al. (2002) Freeman, P. E., Kashyap, V., Rosner, R., & Lamb, D. Q. 2002, ApJS, 138, 185
- Frink et al. (1998) Frink, S., Roeser, S., Alcala, J. M., Covino, E., & Brandner, W. 1998, A&A, 338, 442
- Gittins, Clarke, & Bate (2003) Gittins, D. M., Clarke, C. J., & Bate, M. R. 2003, MNRAS, 340, 841
- Grady et al. (2001) Grady, C. A. et al. 2001, AJ, 122, 3396
- Henning et al. (1998) Henning, T., Burkert, A., Launhardt, R., Leinert, C., & Stecklum, B. 1998, A&A, 336, 565
- Hillenbrand et al. (1995) Hillenbrand, L. A., Meyer, M. R., Strom, S. E., & Skrutskie, M. F. 1995, AJ, 109, 280
- Hollenbach, Yorke, & Johnstone (2000) Hollenbach, D. J., Yorke, H. W., & Johnstone, D. 2000, in Protostars and Planets IV, V. Mannings et al. eds., Tucson:University of Arizona Press, 401
- Hoogerwerf & Aguilar (1999) Hoogerwerf, R. & Aguilar, L. A. 1999, MNRAS, 306, 394
- Hu et al. (1991) Hu, J. Y., Blondel, P. F. C., The, P. S., Tjin A Djie, H. R. E., de Winter, D., Catala, C., & Talavera, A. 1991, A&A, 248, 150
- Kaastra & Mewe (2000) Kaastra, J. S. & Mewe, R. 2000, in Atomic Data Needs for X-ray Astronomy, NASA/CP-2000-209968, 161
- Kenyon & Hartmann (1995) Kenyon, S. J. & Hartmann, L. 1995, ApJS, 101, 117
- Klessen (2001) Klessen, R. S. 2001, ApJ, 556, 837
- Knee & Prusti (1996) Knee, L. B. G. & Prusti, T. 1996, A&A, 312, 455
- Knude & Hog (1998) Knude, J. & Hog, E. 1998, A&A, 338, 897
- Kroupa (1998) Kroupa, P. 1998, MNRAS, 298, 231
- Kroupa (2000) Kroupa, P. 2000, in Massive Stellar Clusters (A. Lancon & C. Boily, eds.), ASP Conf. 211, 233
- Kroupa & Boily (2002) Kroupa, P. & Boily, C. M. 2002, MNRAS, 336, 1188
- Larson (2002) Larson, R. B. 2002, MNRAS, 332, 155
- Lawson et al. (2001) Lawson, W. A., Crause, L. A., Mamajek, E. E., & Feigelson, E. D. 2001, MNRAS, 321, 57
- Lawson & Feigelson (2001) Lawson, W. & Feigelson, E. D. 2001, in From Darkness to Light: Origin and Evolution of Young Stellar Clusters, ASP Conf. 243, T. Montmerle & P. André eds., 591
- Lawson et al. (2002) Lawson, W. A., Crause, L. A., Mamajek, E. E., & Feigelson, E. D. 2002, MNRAS, 329, L29
- Leinert, Richichi, & Haas (1997) Leinert, C., Richichi, A., & Haas, M. 1997, A&A, 318, 472
- Loren (1989) Loren, R. B. 1989, ApJ, 338, 902
- Lyo et al. (2003a) Lyo, A.-R., Lawson, W. A., Mamajek, E. E., Feigelson, E. D., Sung, E., & Crause, L. A. 2003, MNRAS, 338, 616
- Lyo et al. (2003b) Lyo, A.-R., Lawson, W. A., Feigelson, E. D. & Crause, L. A. 2003, MNRAS, submitted
- Mamajek, Lawson, & Feigelson (1999) Mamajek, E. E., Lawson, W. A., & Feigelson, E. D. 1999, ApJ, 516, L77
- Mamajek, Lawson, & Feigelson (2000) Mamajek, E. E., Lawson, W. A., & Feigelson, E. D. 2000, ApJ, 544, 356
- Mamajek & Feigelson (2001) Mamajek, E. E. & Feigelson, E. D. 2001, in Young Stars Near Earth: Progress and Prospects, R. Jayawardana & T. Greene eds., San Francisco:ASP Conf. 244, 104
- Mamajek, Meyer, & Liebert (2002) Mamajek, E. E., Meyer, M. R., & Liebert, J. 2002, AJ, 124, 1670
- Mamajek (2003) Mamajek, E. E., in Open Issues in Local Star Formation and Early Stellar Evolution, astro-ph/0305209
- Martin (1998) Martin, E. L. 1998, AJ, 115, 351
- Mathieu (1994) Mathieu, R. D. 1994, ARA&A, 32, 465
- Mizuno et al. (1998) Mizuno, A. et al. 1998, ApJ, 507, L83
- Mizuno et al. (2001) Mizuno, A., Yamaguchi, R., Tachihara, K., Toyoda, S., Aoyama, H., Yamamoto, H., Onishi, T., & Fukui, Y. 2001, PASJ, 53, 1071
- Monet et al. (2003) Monet, D. G. et al. 2003, AJ, 125, 984
- Ortega et al. (2002) Ortega, V. G., de la Reza, R., Jilinski, E., & Bazzanella, B. 2002, ApJ, 575, L75
- Palla & Stahler (1993) Palla, F., & Stahler, S. W. 1993, ApJ, 418, 414
- Palla & Stahler (1999) Palla, F., & Stahler, S. W. 1999, ApJ, 525, 772
- Pirzkal, Spillar, & Dyck (1997) Pirzkal, N., Spillar, E. J., & Dyck, H. M. 1997, ApJ, 481, 392
- Preibisch et al. (1999) Preibisch, T., Balega, Y., Hofmann, K., Weigelt, G., & Zinnecker, H. 1999, New Astronomy, 4, 531
- Preibisch et al. (2002) Preibisch, T., Brown, A. G. A., Bridges, T., Guenther, E., & Zinnecker, H. 2002, AJ, 124, 404
- Quast et al. (2003) Quast, G. R., Torres, C. A. O., Melo, C. H. F., Sterzik, M., de la Reza, R., & da Silva, L. 2003, in Open Issues in Local Star Formation and Early Stellar Evolution, astro-ph/0306266
- Reipurth (2000) Reipurth, B. 2000, AJ, 120, 3177
- Sartori, Lépine, & Dias (2003) Sartori, M. J., Lépine, J. R. D., & Dias, W. S. 2003, A&A, 404, 913
- Sciortino et al. (1998) Sciortino, S., Damiani, F., Favata, F., & Micela, G. 1998, A&A, 332, 825
- Shatsky & Tokovinin (2002) Shatsky, N. & Tokovinin, A. 2002, A&A, 382, 92
- Shen & Hu (1999) Shen, C.-J. & Hu, J.-Y. 1999, Acta Astrophysica Sinica, 19, 292
- Siess, Dufour, & Forestini (2000) Siess, L., Dufour, E., & Forestini, M. 2000, A&A, 358, 593
- Simon, Close, & Beck (1999) Simon, M., Close, L. M., & Beck, T. L. 1999, AJ, 117, 1375
- Skinner & Yamauchi (1996) Skinner, S. L. & Yamauchi, S. 1996, ApJ, 471, 987
- Stelzer et al. (2003) Stelzer, B., Huelamo, N., Hubrig, S., Zinnecker, H., Micela, G., 2003, A&A, in press (astro-ph/0306401)
- Sterzik & Durisen (1995) Sterzik, M. F. & Durisen, R. H. 1995, A&A, 304, L9
- Sterzik & Durisen (1998) Sterzik, M. F. & Durisen, R. H. 1998, A&A, 339, 95
- Song, Bessell, & Zuckerman (2002) Song, I., Bessell, M. S., & Zuckerman, B. 2002, A&A, 385, 862
- Testi et al. (1997) Testi, L., Palla, F., Prusti, T., Natta, A., & Maltagliati, S. 1997, A&A, 320, 159
- Testi, Palla, & Natta (1999) Testi, L., Palla, F., & Natta, A. 1999, A&A, 342, 515
- Townsley et al. (2003) Townsley, L. et al. 2003, ApJ, in press (astro-ph/0305133)
- Tsuboi et al. (2003) Tsuboi, Y., Maeda, Y., Feigelson, E. D., Garmire, G. P., Chartas, G., Mori, K., & Pravdo, S. H. 2003, ApJ, 587, L51
- van den Ancker et al. (1997) van den Ancker, M. E., The, P. S., Tjin A Djie, H. R. E., Catala, C., de Winter, D., Blondel, P. F. C., & Waters, L. B. F. M. 1997, A&A, 324, L33
- Vieira, Pogodin, & Franco (1999) Vieira, S. L. A., Pogodin, M. A., & Franco, G. A. P. 1999, A&A, 345, 559
- Walter et al. (2000) Walter, F. M., Alcala, J. M., Neuhauser, R., Sterzik, M., & Wolk, S. J. 2000, in Protostars and Planets IV, 273
- Webb et al. (1999) Webb, R. A., Zuckerman, B., Platais, I., Patience, J., White, R. J., Schwartz, M. J., & McCarthy, C. 1999, ApJ, 512, L63
- Weinberger et al. (2000) Weinberger, A. J., Rich, R. M., Becklin, E. E., Zuckerman, B., & Matthews, K. 2000, ApJ, 544, 937
- Weintraub (1990) Weintraub, D. A. 1990, ApJS, 74, 575
- Weisskopf et al. (2002) Weisskopf, M. C., Brinkman, B., Canizares, C., Garmire, G., Murray, S., & Van Speybroeck, L. P. 2002, PASP, 114, 1
- White & Basri (2003) White, R. J. & Basri, G. 2003, ApJ, 582, 1109
- Worley & Douglass (1997) Worley, C. E. & Douglass, G. G. 1997, A&AS, 125, 523 (available at http:/vizier.u-strasbg.fr)
- Zinnecker & Preibisch (1994) Zinnecker, H. & Preibisch, T. 1994, A&A, 292, 152
- Zinnecker & Mathieu (2001) Zinnecker, H. & Mathieu, R. (eds.) 2001, The Formation of Binary Stars, IAU Symp. 200, San Francisco:ASP
- Zuckerman et al. (2001) Zuckerman, B., Song, I., Bessell, M. S., & Webb, R. A. 2001, ApJ, 562, L87
| HD | Name | R.A. | Dec. | SpTy | Mass | Age | Cloud | ||
|---|---|---|---|---|---|---|---|---|---|
| (J2000) | pc | Myr | pc | ||||||
| 100546 | KR Mus | 11 33 25.44 | -70 11 41.2 | B9Vne | 103 | 2.5 | 10 | Yes | 2 |
| 104237 | DX Cha | 12 00 05.08 | -78 11 34.5 | A0Vpc | 116 | 2.5 | 2 | Yes | 9 |
| 141569 | … | 15 49 57.75 | -03 55 16.4 | B9.5e | 99 | No | 35 | ||
| 150193 | MWC 863 | 16 40 17.92 | -23 53 45.2 | A1Ve | 150 | 2.3 | 2 | No | 5 |
| 152404 | AK Sco | 16 54 44.85 | -36 53 18.6 | F5 IVe | 145 | 1.5+1.5 | No | 29 | |
Note. — Properties are obtained from the SIMBAD database except as follows. Masses and ages for HD 100547, 104237 and 150193 are obtained from their HR diagram locations by van den Ancker et al. (1997). The age for HD 141569 is from the HR diagram of its low mass companions by Weinberger et al. (2000). Spectral types, mass and age estimates for AK Sco are obtained from the binary orbit analysis of Andersen et al. (1989). The cloud indicator denotes whether an optical dark cloud or molecular material is found near the star. gives the closest approach of the star to the UCL or LCC subgroups of the OSCA during the past Myr. These last two columns are discussed in §2.
| HD | Obs Date | Exp |
|---|---|---|
| ks | ||
| 100546 | 4 Feb 2002 | 5.2 |
| 104237 | 5 Jun 2001 | 3.0 |
| 4 Feb 2002 | 2.8 | |
| 141569 | 23 Jun 2001 | 2.9 |
| 150193 | 19 Aug 2001 | 2.9 |
| 152404 | 19 Aug 2001 | 3.1 |
| Mem | ID | R.A. | Dec. | Ref | Name | V | R | I | J | H | K | SpTy | H | Li | Class | ||
|---|---|---|---|---|---|---|---|---|---|---|---|---|---|---|---|---|---|
| # | Type | ″ | ″ | Å | Å | ||||||||||||
| Confirmed members | |||||||||||||||||
| 1 | psx | 11 59 08.0 | -78 12 32.2 | 1 | CXOU 115908.2-781232 | +0.0 | +0.0 | 16.99 | 15.57 | 13.83 | 12.01 | 11.45 | 11.17 | M5 | +0.9 | WTT | |
| 2 | a | 11 59 37.6 | -78 13 18.6 | 2 | Cha AB | 4.90bbBright star data from SIMBAD. | 5.02 | 5.04 | 4.98 | B9VnaaA second X-ray source is present 8″ to the SE of this source. | +13 | AB | |||||
| 3 | x | 12 00 03.6 | -78 11 31.0 | 3 | HD 104237 C | ||||||||||||
| 4 | x | 12 00 04.0 | -78 11 37.0 | 3 | HD 104237 B | K: | |||||||||||
| 5 | asx | 12 00 05.1 | -78 11 34.6 | 2 | HD 104237 A | 0.0 | 0.0 | 6.59bbBright star data from SIMBAD. | 5.81 | 5.25 | 4.59 | A0VpeaaA second X-ray source is present 8″ to the SE of this source. | HAeBe | ||||
| 6 | psx | 12 00 08.3 | -78 11 39.5 | 1 | HD 104237 D | +0.0 | +0.0 | 14.28 | 13.09 | 11.62 | M3 | +0.6 | WTT | ||||
| 7 | psx | 12 00 09.3 | -78 11 42.4 | 1 | HD 104237 E | +0.0 | +0.1 | 12.08vvVariable star. Maximum light values listed. | 11.25vvVariable star. Maximum light values listed. | 10.28vvVariable star. Maximum light values listed. | K2 | +0.5 | CTT | ||||
| 8 | ps | 12 01 44.4 | -78 19 26.7 | 1 | USNO-B 120144.7-781926 | 17.18vvVariable star. Maximum light values listed. | 15.61vvVariable star. Maximum light values listed. | 13.72vvVariable star. Maximum light values listed. | 11.68 | 11.12 | 10.78 | M5 | +0.6 | CTT | |||
| 9 | psx | 12 01 52.5 | -78 18 41.3 | 1 | CXOU 120152.8-781840 | -0.9 | +0.4 | 16.78 | 15.29 | 13.52 | 11.63 | 11.04 | 10.77 | M5 | +0.6 | WTT | |
| Non-members | |||||||||||||||||
| x | 11 59 48.1 | -78 11 45.0 | 2 | CPD | -0.1 | +0.0 | 8.87 | 7.53 | 6.59 | 5.98 | 5.85 | K0 | +1.2 | 0.05 | |||
| x | 12 00 49.5 | -78 09 57.2 | 2 | CPD | -0.2 | +0.2 | 9.62 | 9.13 | 8.77 | 8.61 | 8.54 | F0 | +10 | 0.05 | |||
| x | 12 01 18.1 | -78 02 52.2 | 1 | CXOU 120118.2-780252 | +0.6 | +1.4 | 15.58 | 14.62 | 13.80 | 12.53 | 11.84 | 11.61 | K7 | 0.05 | |||
| x | 11 59 42.0 | -78 18 36.6 | 1 | CXOU 115942.2-781836 | +0.6 | +1.1 | 18.25 | 17.74 | 17.22 | 16.46 | 15.85 | 16.08 | |||||
| x | 12 01 01.4 | -78 06 18.0 | 4 | CXOU 120101.4-780618 | +2.4 | 18.82 | 18.35 | 17.88 | |||||||||
| x | 12 01 35.3 | -78 04 27.6 | 4 | CXOU 120135.3-780427 | -0.3 | +1.1 | 19.61 | 19.07 | 18.42 | ||||||||
| p | 11 58 16.0 | -78 08 24.5 | 1 | USNO-B 115816.0-780824 | 12.00 | 10.57 | 9.51 | 8.84 | 8.72 | K0 | +1.0 | 0.05 | |||||
| p | 11 58 40.3 | -78 12 29.2 | 1 | USNO-B 115840.3-781229 | 13.04 | 11.37 | 10.19 | 9.47 | 9.24 | K2 | +1.1 | 0.05 | |||||
| p | 12 02 23.1 | -78 05 44.6 | 1 | USNO-B 120223.1-780544 | 15.38 | 12.84 | 11.26 | 10.32 | 10.04 | M3 | +1.2 | 0.05 | |||||
Note. —
Member #: Running number used in §5.
ID Type: a = astrometric; p = photometric; s = spectroscopic; x = X-ray.
Position reference: 1 = 2MASS all-sky catalog; 2 = and Tycho catalogs; 3 = X-ray position aligned to the Hipparcos position of HD 104237 A; 4 = USNO-B1.0 catalog.
Positional offsets: and are 2MASS (or USNO-B1.0 or 2MASS is unavailable) positions minus X-ray positions. For positive offsets, the X-ray source is SW of the star.
VRI : Our photometry from SAAO, except where noted.
JHK : 2MASS photometry.
Spectral types: Evaluated from our MSSSO spectroscopy, except where noted.
H, Li: Equivalent widths in Å of H and Li 6707, where a negative value is in emission, obtained from our MSSSO spectroscopy (Figure 3).
Class: AB = A or B non-emission line star; HAeBe = Herbig AB emission line star; CTT = classical emission-line T Tauri star; WTT = weak-lined T Tauri star
| Catalog Photometry | Notes | ||||||||||||
|---|---|---|---|---|---|---|---|---|---|---|---|---|---|
| Field | R.A. | Dec. | Cts | B | R | I | J | H | K | ||||
| HD 100546 | 11 33 39.6 | -70 08 05.5 | +0.5 | -0.2 | 99 | 13.9 | 13.7 | 12.2 | 11.33 | 10.68 | 10.54 | ||
| 11 33 42.6 | -70 21 09.4 | +0.6 | -0.4 | 82 | 13.6 | 12.9 | 11.8 | 11.27 | 10.86 | 10.78 | a | ||
| 11 33 43.7 | -70 16 25.9 | -0.1 | -1.4 | 17 | 15.7 | 14.7 | 14.0 | 12.68 | 12.09 | 11.93 | |||
| 11 34 11.8 | -70 19 37.7 | +0.7 | -1.0 | 13 | 15.3 | 14.1 | 12.9 | 12.04 | 11.47 | 11.36 | |||
| 11 34 27.4 | -70 13 21.5 | -0.3 | +0.2 | 21 | 13.6 | 13.3 | 12.9 | 11.74 | 11.38 | 11.26 | |||
| HD 141569 | |||||||||||||
| HD 150193 | 16 39 45.5 | -24 02 02.7 | -1.0 | -1.3 | 111 | 18.0 | 14.0 | 14.3 | 10.17 | 8.66 | 7.63 | b | |
| 16 40 31.3 | -23 49 15.1 | +2.3 | -1.4 | 27 | 17.7: | 15.6 | 13.7 | c | |||||
| HD 152404 | 16 54 16.9 | -36 56 22.0 | -1.4 | +2.3 | 4 | 16.6 | 14.8 | 13.5 | 12.80 | 12.06 | 11.87 | d | |
| 16 54 30.8 | -36 49 24.4 | +0.3 | +0.6 | 54 | 10.4 | 10.0 | 9.8 | 9.41 | 9.33 | 9.28 | e | ||
| 16 55 10.2 | -36 51 20.2 | +4.5 | -4.9 | 8 | 16.7 | 14.2 | 13.8 | 12.42 | 11.56 | 11.29 | f | ||
Note. — R.A. and Dec. are from the wavelet-based source detection algorithm applied to the ACIS image after astrometric alignment of the field to the HAeBe star. Sources should be designated CXOU 113339.6-700805, and so forth. and are offsets in arcseconds between the 2MASS position and the X-ray source. are ACIS counts in a % extraction region. photometry is from the USNO-B1.0 catalog, and photometry is from the 2MASS All Sky Catalog. Mean values are listed when two epochs are given in the USNO-B1.0 catalog.
| Mem | Source | Epoch | ||||||
|---|---|---|---|---|---|---|---|---|
| # | ″ | keV | erg s-1 | erg s-1 | ||||
| (a) Cha/HD 104237 field | ||||||||
| 1 | CXOU 115908.0 | 1 | 10 | 4.0 | 0.90 | 0.3 | 28.6 | |
| -781232 | 2 | 4 | 28.2 | |||||
| 3 | HD 104237 C | 1 | 0 | 1.0 | 0.60 | 0.9 | 28.2 | |
| 2 | 6 | 28.5 | ||||||
| 4 | HD 104237 B | 1 | 18 | 0.50 | 0.15 | 1 | 29.1 | |
| 2 | 26 | 29.2 | ||||||
| 5 | HD 104237 A | 1 | 299 | 0.75 | 0.40 | 0.7/5.2 | 30.2 | 30.4 |
| 2 | 340 | 30.2 | 30.5 | |||||
| 6 | HD 104237 D | 1 | 37 | 1.0 | 0.60 | 0.6 | 29.4 | |
| 2 | 33 | 29.3 | ||||||
| 7 | HD 104237 E | 1 | 25 | 1.0 | 0.60 | 2.0aaThis spectrum showed significant soft X-ray absorption with cm-2. The inferred intrinsic luminosities corrected for this absorption is 6 (3) times higher in the () keV band than the observed values given here. | 28.6aaThis spectrum showed significant soft X-ray absorption with cm-2. The inferred intrinsic luminosities corrected for this absorption is 6 (3) times higher in the () keV band than the observed values given here. | 29.9aaThis spectrum showed significant soft X-ray absorption with cm-2. The inferred intrinsic luminosities corrected for this absorption is 6 (3) times higher in the () keV band than the observed values given here. |
| 2 | 198 | 29.5aaThis spectrum showed significant soft X-ray absorption with cm-2. The inferred intrinsic luminosities corrected for this absorption is 6 (3) times higher in the () keV band than the observed values given here. | 30.8aaThis spectrum showed significant soft X-ray absorption with cm-2. The inferred intrinsic luminosities corrected for this absorption is 6 (3) times higher in the () keV band than the observed values given here. | |||||
| 9 | CXOU 120152.5 | 1 | 14 | 7.5 | 0.75 | 1 | 28.5 | |
| -781841 | 2 | 7 | 28.2 | |||||
| (b) Other fields | ||||||||
| HD 100546 | 1 | 59 | 2.5 | 0.75 | 2.5 | 29.2 | 29.4 | |
| HD 141569A | 1 | 161 | 1.0 | 0.60 | 0.7/4.5 | 29.9 | 30.1 | |
| HD 141569D | 1 | 49 | 0.5 | 0.15 | 1.0 | 29.9 | ||
| HD 150193A | 1 | 152 | 1.0 | 0.60 | 5.0 | 30.2 | 30.7 | |
| HD 150193C | 1 | 13 | 0.5 | 0.15 | 0.8 | 29.6 | ||
| HD 152404 | 1 | 17 | 2.5 | 0.75 | 0.4 | 29.1 | ||