Near-infrared spectroscopy of powerful compact steep-spectrum radio sources
Abstract
We have obtained near-infrared spectroscopy of a small sample of powerful Compact Steep-Spectrum (CSS) radio sources mainly, but not exclusively, from the 3CR sample. We find no differences between the distributions in the equivalent width and luminosity of the [Oiii]5007 line for our sample and other larger, presumably older, high-redshift 3C objects, suggesting that the underlying quasar luminosity remains roughly constant as quasars age. We also find a possible broad line in 3C 241, adding to recent evidence for broad lines in some radio galaxies.
keywords:
galaxies: active – galaxies: individual: 3C 237, 3C 241 – galaxies: quasars: individual: 3C 147, 3C 186, 3C 190, 4C 31.38, 3C 286, 3C 298, OQ 172 – infrared: galaxies1 INTRODUCTION
Compact Steep-Spectrum (CSS) radio sources are an important subclass of radio sources, which form around 15 – 30 per cent of radio source surveys (e.g. Peacock & Wall 1982; Fanti et al. 1990; O’Dea 1998). They are characterised by a small projected linear size (typically 15 kpc) and a steep high-frequency radio spectrum ( where ).
Fanti et al. (1990) presented an important catalogue of CSS sources still in use by many authors, by selecting from the earlier catalogues of Peacock & Wall (1982) and the 3CR catalogue of Jenkins, Pooley & Riley (1977). They analysed the statistics of CSS sources compared to normal, larger radio sources and concluded that there are too many CSS sources observed in complete samples to be consistent with the hypothesis that they are normal sources seen in projection. Neither are they likely to be an intrinsically faint, and hence numerous, population of normal radio sources seen in projection and amplified by Doppler boosting into the sample. This result follows because the majority of their radio luminosity originates from twin radio lobes, which cannot be Doppler boosted as such an effect would cause large and unobserved asymmetries between the brightnesses of the two lobes. It is therefore likely that CSS sources are a class of source whose difference from larger sources needs to be explained by physical or evolutionary models. A comprehensive review (O’Dea 1998) summarises their properties and the state of observational knowledge about these objects.
CSS sources may be small either because they are young (Phillips & Mutel 1982; Carvalho 1985) or because they exist in a dense environment which prevents propagation of the radio jets (van Breugel et al. 1984). Large bends in CSS radio jets suggest interaction with such an environment (e.g. Fanti et al., 1986, 1989). However, there are several observations which do not favour denser environments in CSS than normal radio sources. ISO far-infrared fluxes of CSS objects are broadly consistent with those of larger radio sources (Fanti et al. 2000) suggesting similar dust content in the circumnuclear environment. Near-infrared nuclear continuum properties are also similar (de Vries et al. 1998) and optical spectroscopy reveals little difference in [OII] fluxes for a given radio flux in low-redshift CSS and extended objects (Morganti et al. 1997). Moreover, direct VLBI observations of compact symmetric objects (CSOs) which have structure on the sub-kiloparsec scale, reveal young dynamical ages (Owsianik & Conway 1998) and imply a natural evolutionary connection between CSO and CSS sources. Such connections have been modelled by number of authors (Bicknell, Dopita & O’Dea 1997; O’Dea & Baum 1997; Snellen et al. 2000) who deduce the evolution of luminosity and radio source size with source age along the evolutionary sequence. The end result of CSO and CSS evolution is not clear; O’Dea & Baum suggest that such sources may eventually evolve into low-power (Fanaroff & Riley class I) sources rather than edge-brightened, powerful “classical-double” radio sources. It is also possible that in addition there may exist a population of small sources which never reach the stage of classical-double radio sources; Alexander (2000) uses such an extra population to fit the density of sources in the power–linear size plane.
Emission-line properties of CSS sources have been the subject of a number of optical studies, usually involving spectroscopy or narrow-band imaging both with ground-based telescopes and the Hubble Space Telescope. Imaging reveals that CSS have much of their optical emission (between 30% and 90%) within the central 3 kiloparsecs,the same dimensions as the typical radio source (Axon et al. 2000). In addition, faint extended line emission was seen beyond the radio source in four out of five cases for which sufficiently deep observations were available (Axon et al. 2000). It seems likely that at least some of the emission near the centre is associated with the radio jets, as there are many examples where the optical line emission is either cospatial with the radio jets or at least elongated in the same direction (de Vries et al. 1999; Axon et al. 2000), or where complex moderately broad ( km s-1) line profiles (Gelderman & Whittle 1994) are seen close to the radio lobes (O’Dea et al. 2002; Morganti et al. 1997) suggesting that the radio lobes are exciting the line-emitting gas by driving shocks into it. The fainter line emission beyond the radio sources (Axon et al. 2000) may be produced by photoionization by anisotropically escaping photons emitted by a central active galactic nucleus. The twin roles of radiative shocks and accretion disks as sources of photoionizing photons have been discussed recently by Inskip et al. (2002).
In large, non-CSS radio sources, much work has been done on the luminosities of narrow optical emission lines, in particular [Oii]3727Å and [Oiii]5007Å . There appears to be a distinction between radio galaxies and quasars in that the [Oiii] line may be stronger for quasars than radio galaxies of the same radio luminosity (Jackson et al. 1990). This could be due to orientation-dependent obscuration extending into the narrow-line region; models of such effects have been made by Hes, Barthel & Fosbury (1996), di Serego Alighieri et al. (1997) and Baker & Hunstead (1995). On the other hand, [Oii] luminosities of radio galaxies appear to be similar to those of quasars (Hes et al. 1996). At higher redshift, where the [Oiii] line is shifted into the near infra-red, Jackson & Rawlings (1997) failed to find a significant difference in its luminosity between radio galaxies and quasars. One can speculate that this may be because the greater radio power of these high-redshift objects’ jets leads directly to the removal of obscuration of [Oiii] (Lawrence 1991). Alternatively there may be subtle reasons, as suggested by Simpson (1998), why one expects emission-line luminosity differences between radio galaxies and quasars which are dependent on the line studied and the ranges of redshift and radio luminosity probed. Based on simple photoionization models, Simpson (1998) also suggests that “[Oiii] is a better indicator than [Oii] of the strength of the underlying [quasar] continuum”.
If there is a connection between CSS and larger sources, either because CSS are destined to evolve into larger objects or because they contain a denser environment which prevents them so evolving, we may be able to learn about this connection by studying the narrow lines which are produced within the host galaxy of the CSS which also completely contains the radio source. Baker & Hunstead (1995) found that the optical continuum of CSS quasars was reddened compared to that of larger sources and that the equivalent widths of narrow emission lines was correspondingly high, although they were not able clearly to disentangle suppression of the continuum from enhancement of the narrow lines. Morganti et al. (1997) have studied this problem for low-redshift objects and conclude that [Oiii] and [Oii] luminosities are similar to those of larger sources.
This paper is a continuation of earlier work (Jackson & Rawlings 1997) in which we carried out infra-red spectroscopy of the [Oiii] emission line in larger 3CR radio sources and found that this emission line in radio galaxies and quasars has approximately the same strength for a given redshift. Here we extend the programme to CSS sources. Our aims are (i) to test whether the Morganti et al. (1997) result (similar emission-line luminosities in CSS and larger sources) also holds at high redshift, and (ii) to investigate whether CSS radio galaxies and quasars at high redshift have similar emission-line luminosities. The results have implications for the physical conditions in high-redshift CSS sources, and have implications for evolutionary models in which CSS sources eventually expand to become large radio sources. A subsidiary aim is to investigate whether any of the objects hitherto classified as CSS galaxies possess infra-red broad lines and should therefore be reclassified as quasars; we have therefore taken spectra of the region around H where this is possible. For the main part of the work we use [Oiii] as it is generally stronger than [Oii] and also because there are suggestions (Best, Röttgering & Longair 2000; Inskip et al. 2002) that [Oii] luminosities may be more affected by shock excitation. In section 2 we describe the sample, observations and data reduction; in section 3 we present the results and in section 4 discuss the relation between our results and other previous work. Section 5 contains a brief discussion of the implications of these results.
2 SAMPLE SELECTION, OBSERVATIONS AND DATA REDUCTION
2.1 Sample selection
Fanti et al. (1990) selected a complete sample of objects from the 3CR (Jenkins et al. 1977) and Peacock & Wall (1982) samples with the following selection criteria:
-
1.
Linear size of 15 kpc or less, assuming =100 km s-1 Mpc-1 and =1
-
2.
178-MHz radio power, , of WHz-1 or greater
-
3.
178-MHz flux density of 10 Jy or greater. Since the radio spectra of CSS sources often turn over at frequencies of a few hundred MHz, sources were included if the extrapolation of their high-frequency radio spectra exceeded 10 Jy at 178 MHz.
-
4.
High-frequency radio spectral index 0.5 [where , and following Peacock & Wall (1982) the high-frequency spectral index is taken between 2.7 GHz and 5 GHz by most subsequent studies].
Table 1 gives the basic characteristics of the objects which were observed. In all, seven CSS quasars and two CSS radio galaxies were observed.
Our original sample contained all seven CSSs from Fanti et al. (1990) with RAs in the range 05:30 – 15:00 with , declination for accessibility to UKIRT and with [Oiii] lines away from any strong atmospheric sky line. Six of these were observed, the exception being 3C 287. Of these, two (OQ172 and 4C31.38) were included, following Fanti et al. (1990), because the extrapolation of their high-frequency radio spectra exceeded 10 Jy at 178 MHz although their actual Jy. Three slightly lower redshift sources, 3C 147, 3C 237 and 3C 286 from Fanti et al. (1990) were also observed, picked entirely because of RA accessibility. Note that we assume =50 km s-1 Mpc-1 and =0 throughout, which gives linear sizes a factor of 3 greater than Fanti et al. (1990) for a redshift 1 object. Redshifts in the table are from the compilation of Spinrad et al. (1985) except for 4C 31.38 from Fanti et al. (1990) and OQ 172 from Morton et al. (1989). values (the fraction of radio flux from the core of the source, see Orr & Browne 1982) are at an emitted frequency of 8GHz, assuming radio spectral indices, of 0 and -1 for the nuclear and extended emission, from Saikia et al. (1995). We do not quote an value for OQ 172 as it is difficult to determine the radio morphology and core identification from radio maps of this source in the literature (e.g. Udomprasert et al. 1997). OQ 172 is a gigahertz peaked spectrum (GPS) source (e.g. O’Dea, Baum & Stanghellini 1991). Linear sizes are taken from the compilation of Fanti et al. (1990) which in turn are derived mostly from MERLIN and VLA maps of Spencer et al. (1989) at wavelengths of 18cm, 6cm and 2cm, and correcting to our assumed cosmology. Such maps have typical resolutions of between 02 and 05, which is sufficient to derive linear sizes and core fluxes unambiguously in the large majority of cases. 178-MHz radio flux densities are taken from Kellerman, Pauliny-Toth & Williams (1969) except for 1153+31 (Pilkington & Scott 1965) and 1442+10 (Kühr et al. 1981; only the 365-MHz flux was available).
| Object | IAU name | Type | log | ||||
|---|---|---|---|---|---|---|---|
| (B1950) | /kpc | /kpc | /log10WHz-1) | ||||
| (50,0) | (100,1) | ||||||
| 3C 147 | 0538+498 | Q | 0.545 | 0.15 | 5.9 | 2.4 | 29.10 |
| 3C 186 | 0740+380 | Q | 1.063 | 0.052 | 24 | 8.2 | 29.20 |
| 3C 190 | 0758+143 | Q | 1.197 | 0.093 | 46 | 14.1 | 29.37 |
| 3C 237 | 1005+077 | G | 0.877 | 0.00097 | 12 | 4.5 | 29.15 |
| 3C 241 | 1019+222 | G | 1.617 | 0.0063 | 15 | 2.8 | 29.63 |
| 4C 31.38 | 1153+317 | Q | 1.56 | 0.005 | 11 | 3.1 | 29.39 |
| 3C 286 | 1328+307 | Q | 0.849 | 0.82 | 39 | 14.2 | 29.18 |
| 3C 298 | 1416+067 | Q | 1.439 | 0.094 | 31 | 9.1 | 30.09 |
| OQ 172 | 1442+101 | Q | 3.544 | 1 | 0.4 | 30.01 |
2.2 Observations
The observations were carried out using the short focal length camera in the CGS4 spectrometer (Mountain et al. 1990) on the United Kingdom Infrared telescope (UKIRT) on Mauna Kea, Hawaii. At the time, the spectrograph used a 5862-pixel detector array. Flux and wavelength calibrated , and band spectra were obtained of the [Oiii] and H regions of a sample of 9 objects at medium to high redshifts. Observations in J-band were taken using a 75 lines mm-1 grating in second order, giving wavelength coverage of 0.17 m. Two grating settings were used in order to give wavelength coverage of 1.00-1.17 m or 1.16-1.34 m, according to the redshift of the object. In -band a 150 lines mm-1 grating was used in second order, giving a wavelength coverage of 0.09 m and in -band a 75 lines mm-1 grating was used in first order, giving wavelength coverage of 0.4 m. A slit projecting to one pixel at the detector (31 on the sky) was used in all cases. This led to a resolving power of about 400 in J-band, 500 in H-band and 300 in K-band (about 800, 600 and 1000 km s-1 respectively). In the observations, the detector was stepped in a four-point, half-pixel step-size pattern in wavelength in order to provide good sampling of the spectral resolution and redundancy over bad pixels. The detector was also stepped 10 pixels across the sky on alternate integrations in an ABBAABBA pattern.
Observations were carried out over a period of 3 nights beginning on 1994 March 15. Conditions were mainly spectrophotometric, although thin cirrus was observed during the observation of OQ172. The radio galaxy observations were all made using blind offsets as they were too faint to see on the telescope monitor system.
| Source | Exp. | Band | Grating | Res. |
|---|---|---|---|---|
| time | /Order | (nm) | ||
| /s | /l mm-1 | |||
| 3C 147 | 360 | J (1.00–1.18m) | 75 / 2 | 2.8 |
| 3C 186 | 240 | J (1.00–1.18m) | 75 / 2 | 2.8 |
| 3C 190 | 320 | J (1.00–1.18m) | 75 / 2 | 2.8 |
| 3C 237 | 360 | J (1.16–1.35m) | 75 / 2 | 2.8 |
| 3C 241 | 320 | J (1.16–1.35m) | 75 / 2 | 2.8 |
| 3C 241 | 240 | H (1.68–1.78m) | 150 / 2 | 3.5 |
| 4C 31.38 | 400 | J (1.16–1.35m) | 75 / 2 | 3.3 |
| 3C 286 | 160 | J (1.16–1.35m) | 75 / 2 | 3.3 |
| 3C 298 | 120 | H (1.56–1.66m) | 150 / 2 | 3.3 |
| OQ 172 | 2530 | K (2.0–2.4m) | 75 / 1 | 6.5 |
2.3 Data reduction
Data reduction followed the standard procedures described by Eales & Rawlings (1993). Bias subtraction and flat fielding were carried out by the online telescope data reduction system. Subsequent steps were carried out using the Image Reduction and Analysis Facility (IRAF) package distributed by the National Optical Astronomy Observatory (NOAO), and analysis of the one-dimensional spectra was performed using software written by one of us (NJ). Wavelength calibration was performed using argon arc lines, or atmospheric OH lines in the case where an arc spectrum was not available. The lines were identified using the IRAF identify task, and a set of 2-D transformation parameters were generated using the IRAF reidentify task and applied using IRAF transform to correct for geometric distortion across the chip. Background sky lines were subtracted from the corrected frames by subtracting the B spectra from the A spectra in the ABBAABBA chopping pattern described above. The resulting difference frames contained a “negative” channel containing the object as seen in the B exposures and a “positive” channel from the A exposures; the spectra were then extracted. They were flux calibrated using observations of stars from the UKIRT list of standard stars, which were assumed to emit black body spectra of a temperature determined from their published spectral type. Error frames representing the standard deviation on each pixel were also propagated through the reduction process, the expected standard deviation being determined using photon count statistics, assuming a Poisson distribution for the number of photons arriving at each pixel. Flux calibration errors can be estimated by the dispersion of the flux calibration curves for different standard stars observed during the programme, and are approximately 20%.
The luminosities given in Table 3 have been calculated from fluxes taken by directly integrating the flux under the line in the spectra. Continua were fitted to the data by eye, and the adopted continuum fit in each case is shown on the right-hand panel of each figure. Errors on the line fluxes are of the order of 10–20% based on photon statistics, together with a larger systematic error due to continuum fitting. In typical cases, moving the continuum within a plausible range gives changes at the 10-20% level in the flux of the [Oiii] 500.7-nm line and at the 30% level in the weaker lines of [Oiii] 495.9 nm and H. We note, however, that the [Oiii] lines at 495.9 nm and 500.7 nm have been fitted separately, and in all cases the ratio of fluxes in these lines is close to the 1:3 ratio which is expected theoretically. For the two galaxies, an additional error may be introduced due to the blind offsetting, although the large slit width (3″) compared to the likely 05 accuracy of the offset stars implies that this error is relatively small. In the case of good signal-to-noise spectra (3C 147, 3C 286, 3C 298) the widths of the emitted lines have been deduced from the width of Gaussian fits to the observed lines using , being the width of the spectral point spread function of the spectrometer, taken from the quoted spectral resolution of the CGS4 configuration in use, and checked by comparison with the argon arc lines used for wavelength calibration, which have full widths at half-maximum (FWHM) of 80050 km s-1.
In the case of spectra with poor signal-to-noise the fitting routine was also used to estimate the parameters of each line (centroid, FWHM and intensity) and the emitted width of the line, , was inferred as above. In each case, 1000 artificial spectra were then made which had the same signal-to-noise and line strength as each individual spectrum being measured but using different random number seeds; this procedure was repeated for different intrinsic FWHM in order to assess the likelihood of each different intrinsic FWHM reproducing our measurement. For conservatism, a 20% greater than that inferred from the CGS4 manual was used in the simulations. As an example, we show in Fig. 1 the result of simulations for an intrinsically very narrow line and different S:N ratios. We quote in Table 3 the probability that the line we have measured is consistent with zero, based on these simulations. We also quote the upper and lower 1- bounds on the intrinsic FWHM, although the error distribution is not Gaussian on the intrinsic widths because this quantity is calculated as where does have a Gaussian error distribution. We discuss the interpretation of the narrow-line widths further in section 4.1.

| Object | Line | log | FWHM | EW |
| /W | /km s-1 | /nm | ||
| 3C 147 | H+[Nii] | 36.90 | 2570 | |
| 150 | ||||
| [Sii] | 35.84 | |||
| 3C 186 | [Oiii]5007 | 37.03 | 1100 | 4.6 |
| 400 (0.1%) | 2.0 | |||
| [Oiii]4959 | 36.57 | * | ||
| H | 36.68 | 3500 | ||
| 1800 | ||||
| 3C 190 | [Oiii]5007 | 36.96 | 950 | 6.9 |
| 400 (1%) | 3.0 | |||
| [Oiii]4959 | 36.49 | * | ||
| H | 36.04 | 2100 | ||
| 1000 | ||||
| 3C 237 | H + [Nii] | 36.71 | 2000 | |
| 500 | ||||
| [Sii] | 36.26 | |||
| 3C 241 | [Oiii]4959 | 36.67 | * | |
| [Oiii]5007 | 37.08 | 1000 | 4.9 | |
| 400 (3%) | 2.0 | |||
| H | 36.76* | 1200 | ||
| 700 (1%) | ||||
| H | 37.16 | 2000 | ||
| 900 (0.5%) | ||||
| [Nii]6583 | det? | * | ||
| 4C 31.38 | [Oiii]5007 | 36.46 | * | 0.67 |
| [Oiii]4959 | det? | |||
| 3C 286 | H + [Nii] | 37.52 | 2600 | |
| 120 | ||||
| det? | ||||
| 3C 298 | H + [Nii] | 38.27 | 3500 | |
| 170 | ||||
| OQ 172 | [Oiii]5007 | 38.00 | 2200 | 5.0 |
| 600 | 2.0 | |||
| [Oiii]4959 | 37.56* | * | ||
| H | 37.93 | 3700 | ||
| 1000 |
We have no definite evidence for extended emission from these objects; spectra can be extracted from pixel rows adjacent to the object rows, which show more flux than expected from the spill-over as determined from the standard star observations, though these are better explained as poor-positioning of the slit; the calibration stars are obviously much brighter and thus easier to centre the slit on.
3 RESULTS AND NOTES ON INDIVIDUAL OBJECTS
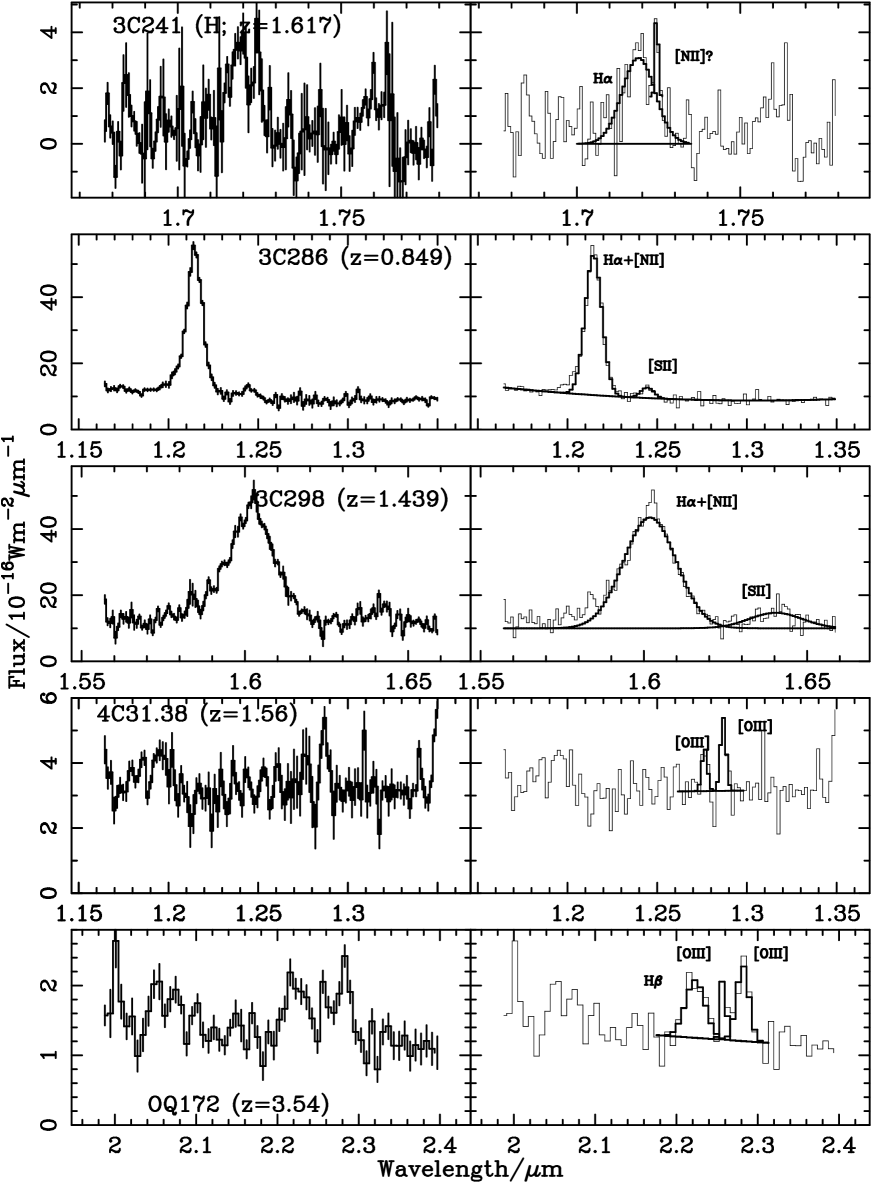
Fig. 2 shows the spectra obtained. The parameters for identified lines are given in Table 3.
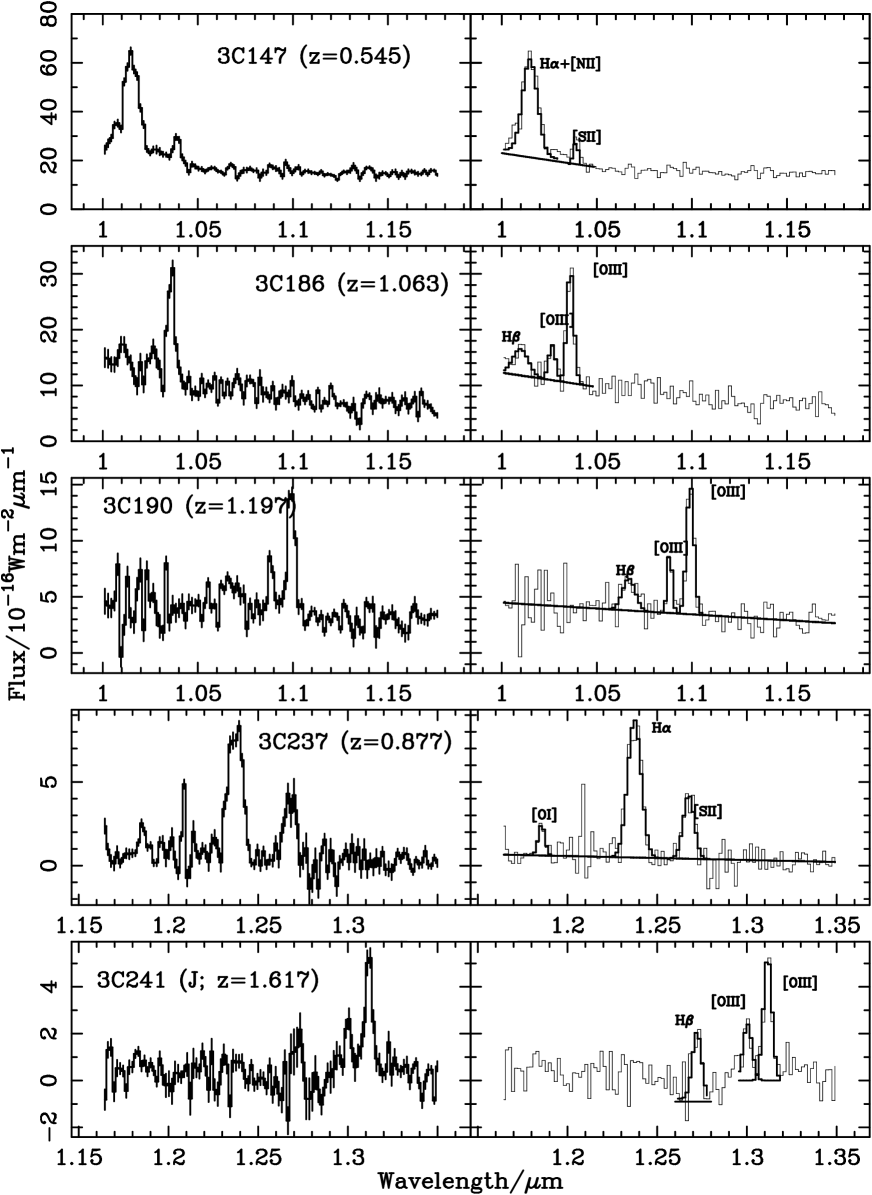 |
- 3C 147
-
It is unclear if the very broad feature surrounding the H line is real, and if so, what its origin is. It is possible that it is simply an artefact generated by failure of the flux calibration process near the band edges; on the other hand, it may be a broad wing of H. The error on the total H flux is larger than usual (probably 30-40%) due to difficulty in fitting to the continuum at the blue end of the spectrum. The noise to the red end of the optical part of the composite is due to coincidence with a set of strong sky emission lines. We can join our 3C 147 spectrum to the optical spectrum of Jackson & Browne (1991) giving us confidence in the flux calibration of our IR data - the power law optical continuum matches up in both spectral index and magnitude between the two spectra. The composite spectrum thus obtained is shown in Figure 3.
- 3C 186
-
Although the spectrum is rather noisy, the continuum and [Oiii] lines are clearly detected, along with H at the blue end of the spectrum. Continuum fitting is difficult in this object because of the lack of continuum to the blue of H.
- 3C 190
-
The poor signal-to-noise ratio of the broad H line in our 3C 190 spectrum makes it difficult to determine an accurate flux for this line.
- 3C 237
-
In our 3C 237 spectrum, it is doubtful whether the [Sii] doublet lines have really been resolved - the signal-to-noise ratio is not good, and the doublet separation would be expected to be about equal to the minimum resolvable by the spectrometer. In any case, the errors on the pixels concerned make it impossible to determine any useful results from the relative fluxes of the doublet components. The spike near 1.2m appears as a single-pixel bright spot in the negative channel, and is likely to be a cosmic ray.
- 3C 241
-
We have both J- and H-band spectra of 3C 241. In the J band spectrum, the noticeable ‘dip’ surrounding the base of the H line is due to unfortunate co-incidence with a broad atmospheric absorption line and may also be due to poor sky subtraction. This prevents us from determining accurately the Balmer decrement for this source and the error on the flux is greater than usual (probably around 50%). Each line in the [Sii] doublet is marginally resolved. Even though 3C 241 is classified as a narrow-line radio galaxy, our H-band spectrum shows continuum and the possibility of broad H emission. In the following scatter diagrams, 3C 241 continues to be marked as a radio galaxy, and is readily identifiable as the only high-redshift CSS radio galaxy for which we have [Oiii] line data.
- 4C 31.38
-
The spectrum is noisy, but there is a detection of [Oiii] 5007Å and a probable detection of [Oiii] 4959Å. The continuum is relatively strong.
- 3C 286
-
H is clearly detected, but the [Nii] lines at 6548Å and 6584Å are too weak to be seen clearly. The [Sii] 6717, 6731Å lines are detected but not clearly resolved.
- 3C298
-
The H line is clearly detected, and [Nii] is just visible on the blue wing. There is some indication of the presence of [Sii] lines but they are not securely detected. The H line may well contain a narrow component which accounts for the failure to fit all the flux in the centre of the line (e.g. Jackson & Eracleous 1995). Alternatively the broad line may have a profile which is more peaked than a Gaussian; a Lorentzian profile gives a good fit to the profile including the central region.
- OQ 172
-
Barthel et al. (1990) present an optical spectrum of OQ 172, which shows a continuum flux consistent with extrapolation of our data. The width of the [Oiii] 5007Å line in OQ172 is severely affected by blending with the red wing of the strong H line and the width may be much lower than that quoted.

4 COMPARISON WITH OTHER RESULTS
Our aim is to study the strengths of the [Oiii] emission lines and the properties of the Balmer lines in the CSS objects and to compare them with non-CSS objects at similar redshift, for which spectra were presented in Jackson & Rawlings (1997) and with other CSS objects at lower redshift and radio luminosity.
4.1 Line profiles
4.1.1 Broad lines
We note that the broad permitted lines in our spectra (H and H) tend to have quite narrow widths, as compared to non-CSS quasars at lower redshift – an effect noted previously by Baker & Hunstead (1996). It is not easy to find a comparison sample of non-CSS objects which is of comparable radio power and redshift; the only really comparable sample are 3CR quasars with for which there are not many spectra yielding measurements of Balmer line widths. Baker et al. (1994) took spectra of six high-redshift quasars, three radio-quiet and three radio-loud, whose Balmer line widths are not significantly different from those of our quasars, although the comparison is complicated by the very much lower extended radio fluxes of the Baker et al. quasars and by the fact that Baker et al. find that their emission lines decompose naturally into a broad and a narrow component111Formally, a Kolmogorov-Smirnov test is unable to distinguish our sample of FWHMs from those of Baker et al. (1994) at the 10% significance level if we take the mean of Baker et al.’s broad and narrow component widths as the comparison FWHM, or if we just take the narrow component widths.. Lacking ideal comparison data, we compare with samples at lower redshift and radio luminosity; the Molonglo Quasar Survey (MQS) for which line-width measurements are presented by Baker et al. (1999) and the compilation of line-widths collated by Wills & Browne (1986). In the former case, we exclude objects listed as CSS by Kapahi et al. (1998) and in the latter case we use only the quasars whose radio structure is dominated by radio lobes in order to be consistent with the 3CR (and predominant MQS) selection.
A Kolmogorov-Smirnov test using our three measurements in quasars of H widths and our three measurements of H widths yields probabilities of 5% and 4% of being drawn from the same distribution as those of Baker et al. (1999) and an 11% significance compared to Wills & Browne’s (1986) H measurements. Although it is not yet clear why this effect occurs, Baker & Hunstead (1996) suggest it could either be due to partial reddening or intrinsically narrower broad-line-region lines. In principle, [Nii] contamination could affect this comparison, although this is unlikely because of the relative weakness of the [Nii] line and the fact that narrow lines are may be visible in the spectra (e.g. 3C 298) and do not affect the broad line fit.
In 3C 241 the H line may be broad. We discuss the implications of this and similar observations further in section 5.
4.1.2 Narrow lines
Although the simulations suggest that the [Oiii] lines are broader than would be expected from the theoretical resolutions and the widths of the arc lines, a combination of continuum fitting problems and sky subtraction residuals mean that it is difficult to make firm statements about the [Oiii] line widths and whether some of them are marginally resolved; all are consistent at the 1 level with standard 500–600 km s-1 intrinsic line widths. This is also true of the study of Jackson & Rawlings (1997) of larger sources which was performed with similar resolution and in which only one object (3C 191) clearly had [Oiii] broader than a few hundred km s-1. At lower redshift, where high signal-to-noise observations are easily available, Gelderman & Whittle (1994) note “broad structured [Oiii]5007Å line profiles” in optical spectra of a sample of 19 lower-redshift CSS objects.
It is also possible that contaminating blends of Feii could be responsible for broad wings to the [Oiii] lines (see e.g. the spectra of radio-quiet quasars analysed by Kuraszkiewicz et al. 2000). In the case of radio-loud, and particularly radio-loud, lobe-dominated quasars, however, the Feii strength tends to be smaller than in radio-quiet quasars (e.g. Miley & Miller 1979; Heckman 1980).
4.2 [Oiii] properties versus radio luminosity
In Figure 4 we plot [Oiii] luminosity against 178-MHz radio luminosity for the complete subset of the 3CR sources presented by Laing, Riley & Longair (1983, hereafter the “3CRR sample”) and which have published [Oiii] fluxes. For the line strengths we take data from our observed CSS sample and the samples of lower redshift CSS objects from Gelderman & Whittle (1994) and Jackson & Browne (1991), and the larger sample of non-CSS quasars and high-excitation radio galaxies from Jackson & Rawlings (1997). We have also included fluxes from the literature (references given in Table 3 of Jackson & Rawlings 1997 and in Table 4 of this paper) when these are available. The Gelderman et al. (1994) sample includes some 3CRR sources but follows the selection of Spencer et al. (1989), which consists of sources from the Peacock & Wall (1982) and 3CR surveys with radio structure confined to 30kpc, radio spectra steeper than between 2.7 and 5 GHz, but with an additional optical magnitude cut .
In addition to existing 3CRR data, Morganti et al. (1997) present observations of a low-redshift southern sample which is selected on the same basis as our higher-redshift sample, by following the Fanti et al. (1990) selection criteria, but with a redshift limit to allow spectroscopy of [Oiii] in the optical. We do not plot their data on Fig. 4, but its inclusion does not significantly change any of the conclusions which follow. It is also difficult to be consistent in extrapolating the radio fluxes of their sample to 178 MHz.
We do not plot the low-excitation radio galaxies, which are characterised by weak line emission associated with FRII radio structure (e.g. Laing et al. 1994) as there do not appear to be any CSS LEGs. We only use the standard high-excitation radio galaxies (HEGs) which show strong narrow line emission. We include as quasars the so-called “broad-line radio galaxies”, which were referred to as “weak quasars” by Jackson & Rawlings (1997) and are defined as objects for which at least one broad line has been observed and whose optical continuum luminosity is W Hz-1. The 178-MHz luminosities in all objects arise from extended emission which is unaffected by relativistic beaming. A least-squares fit to all the objects where [Oiii] is detected yields the relation log([Oiii]) = 13.71+0.791. If we compare the scatter about this line of [Oiii] luminosities of CSS and non-CSS objects, a Kolmogorov-Smirnov test gives no difference in the distributions222Using the Morganti et al. (1997) sources and extrapolating the radio fluxes of their sample down to 178 MHz gives a difference significant only at the 15% level. This modest difference is likely to be due to the extrapolation to 178 MHz of the CSS fluxes producing an overestimate of the for these objects due to the real spectral shape being curved and concave rather than a single power law. Dividing the fluxes by the likely factor of 2–3 for the overestimate removes this difference. We conclude that there is no firm evidence for a significant difference between the distributions of CSS and non-CSS sources in this diagram.

In figure 5 we plot rest-frame [Oiii] equivalent width versus 178-MHz radio luminosity for the same sources as in figure 4, separating quasars and radio galaxies. A Kolmogorov-Smirnov test is again unable to distinguish the distribution of equivalent width in either subsample as a whole. It seems that CSS quasars have the same [Oiii] equivalent widths and luminosities as larger radio quasars. If we take only the low-luminosity, low-redshift galaxies, we cannot make a definite statement about the equivalent widths of CSS galaxies unless we include the Morganti et al. (1997) data; in this case the CSS galaxies have higher equivalent widths at the 0.5% confidence level, the result previously found by Baker & Hunstead (1995).

In Table 4 we present a summary of [Oii] and [Oiii] line fluxes for the CSS subsample of 3C. This table is a supplement to that given by Jackson & Rawlings (1997) for the non-CSS paper of the 3CR sample and is given in the same format.
| Object | Class | Classification | Redshift | Optical | Radio | [Oii] | [Oii] | [Oiii] | [Oiii] |
|---|---|---|---|---|---|---|---|---|---|
| Name | Reference | Magnitude | Flux | Luminosity | Reference | Luminosity | Reference | ||
| 3C43 | Q | SDMA | 1.47 | 20 | 11.6 | ||||
| 3C48 | Q | SDMA | 0.367 | 16.2 | 55.0 | 35.50 | JB91 | 36.37 | JB91 |
| 3C49 | HEG | SDMA | 0.621 | 21 | 10.3 | ||||
| 3C67 | WQ | L94 | 0.310 | 18.0 | 10.0 | 35.51 | GW94 | 36.08 | GW94 |
| 3C93.1 | HEG | SDMA | 0.244 | 19.0 | 9.9 | 35.28 | GW94 | ||
| 3C99 | HEG? | SDMA | 0.426 | 19.1 | 10.8 | ||||
| 3C119 | HEG | SDMA | 0.408 | 20 | 15.7 | ||||
| 3C138 | Q | SDMA | 0.759 | 17.9 | 22.2 | 35.82 | JB91 | 36.71 | JB91 |
| 3C147 | Q | SDMA | 0.545 | 16.9 | 60.5 | 36.69 | JB91 | 37.03 | JB91 |
| 3C186 | Q | SDMA | 1.063 | 17.6 | 14.1 | 37.03 | HJR | ||
| 3C190 | Q | SDMA | 1.197 | 20 | 15.0 | 36.96 | HJR | ||
| 3C216 | Q | SDMA | 0.67 | 18.48 | 20.2 | 35.68 | JB91 | 35.71 | JB91 |
| 3C237 | HEG | SDMA | 0.877 | (R)21 | 20.9 | ||||
| 3C241 | HEG | SDMA | 1.617 | 23.5 | 11.6 | 37.08 | HJR | ||
| 3C268.3 | WQ | L94 | 0.371 | 20.0 | 10.7 | 35.74 | MSvB | ||
| 3C277.1 | Q | SDMA | 0.320 | 17.93 | 8.5 | 35.80 | GW94 | 36.26 | GW94 |
| 3C286 | Q | SDMA | 0.849 | 17.25 | 24.0 | 35.95 | GW94 | ||
| 3C287 | Q | SDMA | 1.055 | 17.67 | 16.0 | ||||
| 3C298 | Q | SDMA | 1.439 | 16.79 | 47.5 | ||||
| 3C299 | HEG | SDMA | 0.367 | 19.48 | 11.8 | 35.91 | MSvB | ||
| 3C303.1 | HEG | SDMA | 0.267 | 19 | 12.4 | 36.06 | MSvB | ||
| 3C305.1 | HEG | SDMA | 1.132 | 21.37 | 12.4 | 36.81 | MSvB | ||
| 3C309.1 | Q | SDMA | 0.904 | 16.78 | 22.7 | ||||
| 3C318 | Q | WRJ | 1.574 | 20.3 | 12.3 | 37.51 | WRJ | ||
| 3C343 | Q | SDMA | 0.988 | 20.61 | 12.4 | ||||
| 3C343.1 | HEG | SDMA | 0.750 | 20.71 | 11.5 | 35.69 | MSvB | 35.96 | GW94 |
| 3C346 | HEG | SDMA | 0.161 | 17.2 | 10.9 | 34.59 | GW94 | ||
| 3C380 | Q | SDMA | 0.691 | 16.81 | 59.4 | 36.24 | GW94 | 37.01 | GW94 |
| 3C454 | Q | SDMA | 1.757 | 18.47 | 11.6 | ||||
| 3C454.1 | HEG | SK96 | 1.841 | 22.0 | 9.8 | ||||
| 3C455 | Q | SDMA | 0.543 | 19.7 | 12.8 | 36.05 | GW94 | 36.31 | GW94 |
5 DISCUSSION
5.1 Quasar fractions among small sources
We find possible evidence for broad H in 3C 241, which has previously been classed as a galaxy. This continues a trend seen in some other 3C radio galaxies which have been examined by infrared spectroscopy or intensively with optical spectroscopy, and in which an obscured or faint broad line region appears. Examples are 3C 318 (Willott, Rawlings & Jarvis 2000) which has been reclassified as a =1.57 quasar, 3C 22 (Rawlings et al. 1995), 3C 67 and 3C 268.3 (Laing et al. 1994) in which spectroscopy revealed broad-line regions obscured by . Hill, Goodrich & Depoy (1996) found broad Pa in a further three radio galaxies (3C 184.1, 3C 219 and 3C 223). This is the major reason for the removal of radio galaxies from the 3CRR sample with respect to earlier studies such as Saikia et al. (2001).
The significance of this can be seen by examination of Fig. 6, which is a plot of radio power at 178 MHz against linear size of the radio source . The striking feature of this plot is that compact sources [15 kpc for =100 km s-1Mpc-1, =1; Fanti et al. (1990)] are predominantly (12/15) quasars. Including 3C 241 (marked on Fig. 6) as a galaxy, the hypothesis that CSS and larger sources have the same quasar fraction can be rejected at the 0.1% level. If 3C 241 really contains a broad line, this increases the power of the rejection to below 0.001%. This result appears to be independent of radio power effects. If we exclude objects with WHz-1, we still obtain 0.1% significance for an excess of quasars among small sources, and again we obtain much higher significance if 3C 241 is regarded as a quasar.
 |
 |
Two of the remaining powerful CSS galaxies, 3C 43 and 3C 343.1, lack any published modern spectra at optical wavelengths, and any near-infrared spectra. Given the compact features visible in HST images of these objects (de Vries et al. 1999) it is plausible that modern spectra would reveal broad Balmer lines in these objects. We therefore find it plausible that all the 3CR CSS sources have naked or lightly-reddened quasar nuclei. This must be compared with a robust quasar fraction of only 0.4 for the larger sources (Willott et al. 2000). The 3.5-m study of powerful 3C double radio galaxies of Simpson, Rawlings & Lacy (1999) proves that any quasar nuclei in such objects are hidden by an obscuring column corresponding to more than magnitudes of visual extinction: any quasar nuclei in these objects are not lightly reddened and are presumably hidden by something more akin to an obscuring torus.
The nearest comparable sample to the 3CRR is the 408-MHz sample of equatorial sources defined by Best, Röttgering & Lehnert (1999) with a limiting flux Jy. This sample is virtually spectroscopically complete and, like the 3CRR (e.g. Blundell et al. 2003, in preparation), has radio information that is good enough to make the angular size information unambiguous in most cases, from VLA radio imaging by Best et al. (1999) and from other information (e.g. Gower & Hutchings 1984; Reid, Kronberg & Perley 1999; Jeyakumar et al. 2000). It does not show the same effect. Either the 3CRR result is a fluke, or further investigation of the 408-MHz Best et al. sample has yet to reveal broad lines in some of the smaller sources. It may also be that some of the Best et al. sources are somewhat younger objects with a higher turnover frequency, which would be preferentially selected at 408 MHz, and in which the quasar nucleus is still too deeply buried to exhibit broad Balmer lines.
Fanti et al. (1990) conclude on statistical grounds that only a small fraction of apparently small quasars are seen foreshortened by projection; hence a high quasar fraction among small sources could be a combination of a luminosity:size anticorrelation and a flux-limited sample picking out only the brightest sources at high redshift. Alternatively, in the popular model in which the jet-triggering event is a galaxy-galaxy merger or interaction in which substantial gas and dust are delivered into a region around a supermassive black hole, it is dynamically plausible (Willott et al. 2001) that, during the first after the jet-triggering event, this material is distributed as a relatively extended mist of translucent gas/dust clouds. These clouds might be capable of lightly obscuring the nucleus, but incapable of blocking the light completely so that one would expect all CSS sources to have visible quasar nuclei, albeit with a small amount of reddening by the extended dust. As the central region dynamically relaxes, and the radio source expands, the standard optically-thick obscuring torus can form, and observations of the quasar nuclei of these larger double sources will then be in accord with the standard unified scheme for radio sources.
5.2 Luminosity and equivalent width of [Oiii]
We have found that [Oiii] line luminosities of objects at high redshift for CSS are not significantly different from those of larger radio sources.
This confirms a number of previous results at low redshift by Baker and Hunstead (1995) and also Morganti et al. (1997); the latter authors however suggest tentative evidence for slightly lower line luminosity for CSS. It also agrees with the same result for Ly by Jarvis et al. (2001). There are several implications of this result. The direct inference is that the underlying quasar luminosity, which is responsible for emission-line excitation, either by photoionization (e.g. Davidson & Netzer 1979) or by driving shocks into the surrounding gas (Sutherland, Dopita & Bicknell 1993), remains roughly constant as quasars age. It also makes the “frustration” scenario, in which CSSs are viewed as radio sources which have been prevented from escaping from the galactic medium (van Breugel et al. 1984) difficult to sustain as in this case increased line emission would be expected corresponding to the increased level of interaction between the radio jet and its surroundings (Morganti et al. 1997).
We also find that there is no tendency for CSS galaxies or quasars to have different equivalent widths at high redshift from their larger cousins. In Fig. 7 we plot the [Oiii] equivalent width against the degree of radio core-dominance , defined as the emitted-frame ratio of core and extended radio flux, in order to separate out the tendency of quasars to have higher values of .
This is a more interesting result, because at low redshift and in a larger sample, Baker & Hunstead (1995) find a higher equivalent width for CSSs and suggest that this is due to suppression of the optical continuum in CSS by reddening. We can perhaps understand why there is a difference between the [Oiii] equivalent widths of CSS and non-CSS sources at low redshift, but may not be at high redshift. Blundell & Rawlings (1999) have pointed out that the highest-redshift objects in any flux-limited sample, like 3C, will inevitably be young, short radio sources. Hence there is much less difference between the CSS sources and their larger counterparts in terms of both time since the jet-triggering event and the radii to which radio-source shocks could have propagated.

6 CONCLUSIONS
We have presented new near-infrared spectra of nine radio-loud, compact steep-spectrum objects, six radio galaxies and two quasars. The narrow-line [Oiii] luminosities in these mostly high-redshift sources are comparable to those in larger sources, suggesting that whether the excitation mechanism for the lines is mechanical energy input via shocks or input of high-energy photons from the central engine, it remains of roughly constant power as the radio sources expand and age. The H line in one radio galaxy may be broad; even without this object, the quasar fraction of small sources in the 3CRR complete sample is now very high.
Acknowledgements
The United Kingdom Infrared Telescope is operated by the Joint Astronomy Centre on behalf of the U.K. Particle Physics and Astronomy Research Council. We thank the support staff at this telescope. This research has made use of the NASA/IPAC Extragalactic Database (NED) which is operated by the Jet Propulsion Laboratory, California Institute of Technology, under contract with the National Aeronautics and Space Administration. We thank an anonymous referee for useful comments on the paper.
References
Alexander P., 2000, MNRAS, 319, 8
Axon D.J., Capetti A., Fanti R., Morganti R., Robinson A., Spencer R.E., 2000, AJ, 120, 2284
Baker A.C., Carswell R.F., Bailey J.A., Espey B.R., Smith M.G., Ward M.J., 1994, MNRAS, 270, 575
Baker J.C., Hunstead R.W., 1995, ApJ, 452, L95
Baker J.C., Hunstead R.W., 1996, in Proc. 2nd Workshop on GPS and CSS sources, Leiden, ed. I. Snellen
Baker J.C., Hunstead R.W., Kapahi V.K., Subrahmanya C.R., 1999, ApJS, 122, 29
Barthel P.D., Tytler D.R., Thomson B., 1990, A&AS, 82, 339
Best P., Röttgering H.J.A., Longair M.S., 2000, MNRAS, 311, 23
Best P., Röttgering H.J.A., Lehnert M.D., 1999, MNRAS, 310, 223
Bicknell G.V., Dopita M.A., O’Dea C.P., ApJ, 485, 112
Blundell K.M., Rawlings S., 1999, Nature, 399, 330
van Breugel W., Miley G., Heckman T., 1984, AJ, 89, 5
Carvalho J.C. 1985, MNRAS, 215, 463
Davidson K., Netzer H., 1979, Rev. Mod. Phys., 51, 715
Eales S.A., Rawlings S. 1993, ApJ, 411, 67
Fanti C., Fanti R., Schilizzi R.T., Spencer R.E., van Breugel W.J.M., 1986, A&A, 170, 10
Fanti C., et al., 1989, A&A, 217, 44
Fanti R., Fanti C., Schilizzi R.T., Spencer R.E., Rendong N., 1990, A&A, 231, 333
Fanti C., et al., 2000, A&A, 358, 499
Gelderman R., Whittle M., 1994, ApJS, 91, 491
Gower A., Hutchings J., 1984, AJ, 89, 1658
Heckman T.M., 1980, A&A, 88, 311
Hes R., Barthel P.D., Fosbury R.A.E., 1996, A&A, 313, 423
Hill G.J., Goodrich R.W., Depoy D.L., 1996, ApJ, 462, 163
Inskip K.J., Best P.N., Rawlings S., Longair M.S., Cotter G., Röttgering H.J.A., Eales S., 2002, MNRAS, 337, 1381
Jackson N., et al., 1990, Nature, 343, 43
Jackson N., Browne I.W.A., 1991, MNRAS, 250, 422
Jackson N., Eracleous M., 1995, MNRAS, 276, 1409
Jackson N., Rawlings S., 1997, MNRAS, 286, 241
Jarvis M., et al., 2001, MNRAS, 326, 1563
Jenkins C.J., Pooley G.G., Riley J.M., 1977, MemRAS, 84, 61
Jeyakumar S., Saikia D.j., Pramesh Rao A., Balasubhramanian V., 2000, A&A, 362, 27
Kapahi V.K., Athreya R.M., Subrahmanya C.R., Baker J.C., Hunstead R.W., McCarthy P.J., van Breugel W., 1998, ApJS, 118, 327
Kellerman K.I., Pauliny-Toth I.I.K., Williams P.J.S., 1969, ApJ, 157, 1
Kühr H., Witzel A., Pauliny-Toth I.I.K., Nauber U., 1981, A&AS, 45, 367
Kuraszkiewicz J., Wilkes B.J., Brandt W.N., Vestergaard M., 2000, ApJ, 542, 631
Laing R.A., Jenkins C.R., Wall J.V., Unger S.W., 1994, in Proc. First Stromlo Symposium “The physics of active galaxies”, ASP Conf. Ser. vol. 54, eds. Bicknell G.V. et al., p. 201
Laing R.A. Riley J., Longair M.S., 1983, MNRAS, 204, 151
Lawrence A., 1991, MNRAS, 252, 586
McCarthy P., Spinrad H, van Breugel W.J.M., 1995, ApJS, 99, 27
Miley G.K., Miller J.S., 1979, ApJ, 228, L55
Morganti R., Tadhunter C.N., Dickson R., Shaw M., 1997, A&A, 326, 130
Morton D.C.; Peterson B.A., Chen J-S, Wright A.E., Jauncey, D.L., 1989, MNRAS, 241, 595
Mountain C.M., Robertson D.J., Lee T.J., Wade R., 1990, Proc SPIE
O’Dea C.P., Baum S.A., Stanghellini C., 1991, ApJ, 380, 66
O’Dea C.P., Baum S.A., 1997, AJ, 113, 148
O’Dea C.P., 1998, PASP, 110, 493
O’Dea C.P., et al. 2002, AJ, 123, 2333
Orr M.J.L., Browne I.W.A., 1982, MNRAS, 200, 1067
Owsianik I., Conway J.E., 1998, A&A, 337, 69
Peacock J.A., Wall J.V., 1982, MNRAS, 198, 843
Phillips R.B., Mutel R.L., 1982, A&A, 106, 21
Pilkington J.D.H., Scott P.F., 1965, MemRAS, 69, 183
Rawlings S., Lacy M., Sivia D.S., Eales S.A., 1995, MNRAS, 274, 428
Reid R.I., Kronberg P.P., Perley R.A., 1999, ApJS, 124, 285
di Serego Alighieri S., Cimatti A., Fosbury R.A.E., Hes R., 1997, A&A, 328, 510
Saikia D.J., Jeyakumar S., Wiita P.J., Sanghera H.S., Spencer R.E., 1995, MNRAS, 276, 1215
Saikia D.J., Jeyakumar S., Salter C.J., Thomasson P., Spencer R.E., Mantovani F., 2001, MNRAS, 321, 37
Simpson C. 1998, MNRAS, 297, L39
Simpson C., Rawlings S., Lacy M., 1999, MNRAS, 306, 828
Snellen I.A.G., Schilizzi R.T., Miley G.K., de Bruyn A.G., Bremer M.N., Röttgering H.J.A., 2000, MNRAS, 319, 445
Spencer R.E., McDowell J.C., Charlesworth M., Fanti C., Parma P., Peacock J.A., 1989, MNRAS, 240, 657
Spinrad H., Djorgovski G., Marr J., Aguilar L., 1985, PASP, 97, 932
Stickel M., Kühr H., 1996, A&AS, 115, 1
Sutherland R.S., Bicknell G.V., Dopita M.A., 1993, ApJ, 414, 510
Udomprasert P.S., Taylor G.B., Pearson T.J., Goberts D.H., 1997, ApJ, 483, L9
de Vries W.H., et al. 1998, ApJ, 503, 138
de Vries W.H., O’Dea C.P., Baum S.A. Barthel P.D., 1999, ApJ, 526, 27
Willott C., Rawlings S., Blundell K., Lacy M., 2000, MNRAS, 316, 449
Willott C., Rawlings S., Jarvis M., 2000, MNRAS, 313, 237
Willott C., Rawlings S., Blundell K.M., Lacy M., Eales S.A., 2001, MNRAS, 322, 536
Wills B., Browne I.W.A., 1986, ApJ, 302, 56