The AST/RO Survey of the Galactic Center Region
Abstract
AST/RO is a 1.7m diameter submillimeter-wave telescope at the geographic South Pole. A key AST/RO project is the mapping of C I and CO and emission from the inner Milky Way (Martin et al. 2003). These data are released for general use.
Smithsonian Astrophysical Observatory, 60 Garden St. MS 12, Cambridge, MA 02138 USA
The Antarctic Submillimeter Telescope and Remote Observatory (AST/RO) is a 1.7 m diameter single-dish instrument which has been observing in the submillimeter-wave atmospheric windows for eight years (Stark et al. 2001, Stark 2003). Essential to AST/RO’s capabilities is its location at Amundsen-Scott South Pole Station, an exceptionally cold, dry site which has unique logistical opportunities and challenges. Observing time on AST/RO is available on a proposal basis.
The distribution of molecular gas in the Galaxy is known from extensive and on-going surveys in CO and 13CO and ; these are spectral lines which trace molecular gas. These lines alone do not, however, determine the excitation temperature, density, or cooling rate of that gas. Observations of C I and the mid- lines of CO and 13CO provide the missing information, showing a more complete picture of the thermodynamic state of the molecular gas, highlighting the active regions, and looking into the dense cores. AST/RO can measure the dominant cooling lines of molecular material in the interstellar medium: the (492 GHz) and (809 GHz) fine-structure lines of atomic carbon (C I) and the (461 GHz) and (807 GHz) rotational lines of carbon monoxide (CO). These measurements can then be modelled using the large velocity gradient (LVG) approximation, and the gas temperature and density thereby determined. Since the low- states of CO are in local thermodynamic equilibrium (LTE) in almost all molecular gas, measurements of mid- states are critical to achieving a model solution of the radiative transfer by breaking the degeneracy between beam filling factor and excitation temperature.
Among the key AST/RO projects is mapping of the Galactic Center Region. Sky coverage as of 2002 is , with spacing, resulting in spectra of 3 transitions at 24,000 positions on the sky. Kim et al. (2002) and Martin et al. (2003) describe the data, which are available on the AST/RO website111http://cfa-www.harvard.edu/ASTRO for general use.
The emission has a spatial extent similar to the low- CO emission, but is more diffuse. The CO emission is also found to be essentially coextensive with lower- transitions of CO, indicating that even the state is in LTE most places; in contrast, the CO emission is spatially confined to far smaller regions. Applying an LVG model to these data together with data from the Bell Labs 7-m (Bally et al. 1988) yields maps of gas density and temperature as a function of position and velocity for the entire region. Kinetic temperature is found to decrease from relatively high values ( K) at cloud edges to lower values ( K) in the interiors. Typical pressures in the Galactic Center gas are .
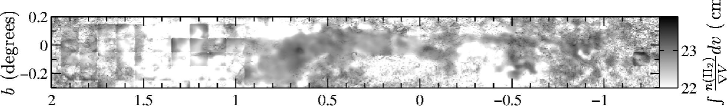
Above is a map of molecular hydrogen column density. It is often assumed that molecular hydrogen column density is proportional to the brightness of the CO line. The column densities estimated using AST/RO data deviate in places by two orders of magnitude from this simple assumption. These discrepancies are caused by variations in excitation and optical depth.
Galactic Center gas that Binney et al. (1991) identify as being on orbits has a density near , which renders it only marginally stable against gravitational coagulation into one or two giant clouds (Elmegreen 1994). This suggests a relaxation oscillator mechanism for starbursts, where inflowing gas accumulates in a ring at 300 pc radius for approximately 400 million years, until the critical density is reached, and the resulting instability leads to the sudden deposition of of gas onto the Galactic Center.
Acknowledgments.
Support was provided by NSF grant OPP-0126090.
References
- 1 Bally, J., Stark, A. A., Wilson, R. W. & Henkel, C. 1988, ApJ, 324, 223
- 2 Binney, J., Gerhard, O. E., Stark, A. A., Bally, J. & Uchida, K. I. 1991, MNRAS, 252, 210
- 3 Elmegreen, B. G. 1994, ApJ, 425, L73
- 4 Kim, S., Martin, C. L., Stark, A. A. & Lane, A. P. 2002, ApJ, 580, 896
- 5 Martin, C. L., Walsh, W. M., Xiao, K., Lane, A. P., Walker, C. K. & Stark, A. A. 2003, ApJS, in press (astro-ph0211025)
- 6 Stark, A. A., et al. 2001, PASP, 113, 567
- 7 Stark, A. A. 2003, in “The Future of Small Telescopes in the New Millennium, Vol. II”, ed. T. D. Oswalt (Kluwer Academic Publishers: Dordrecht), 269