High Resolution Images of Orbital Motion in the Trapezium Cluster: First Scientific Results from the MMT Deformable Secondary Mirror Adaptive Optics System111A portion of the results presented here made use of the of MMT Observatory, a facility jointly operated by the University of Arizona and the Smithsonian Institution.
Abstract
We present the first scientific images obtained with a deformable secondary mirror adaptive optics system. We utilized the 6.5m MMT AO system to produce high-resolution (FWHM=0.07) near infrared (1.6) images of the young ( Myr) Orion Trapezium Ori cluster members. A combination of high spatial resolution and high signal to noise allowed the positions of these stars to be measured to within accuracies. We also present slightly lower resolution (FWHM0.085) images from Gemini with the Hokupa’a AO system as well. Including previous speckle data (Weigelt et al., 1999), we analyze a six year baseline of high-resolution observations of this cluster. Over this baseline we are sensitive to relative proper motions of only /yr (4.2 km/s at 450 pc). At such sensitivities we detect orbital motion in the very tight Ori (52 AU separation) and Ori (94 AU separation) systems. The relative velocity in the Ori system is km/s. We observe km/s of relative motion in the Ori system. These velocities are consistent with those independently observed by Schertl et al. (2003) with speckle interferometry, giving us confidence that these very small (/yr) orbital motions are real. All five members of the Ori system appear likely gravitationally bound ( is moving at km/s in the plane of the sky w.r.t. where km/s for the B group). The very lowest mass member of the Ori system () has and an estimated mass of . There was very little motion ( km/s) detected of w.r.t or , hence is possibly part of the Ori group. We suspect that if this very low mass member is physically associated it most likely is in an unstable (non-hierarchical) orbital position and will soon be ejected from the group. The Ori system appears to be a good example of a star formation “mini-cluster” which may eject the lowest mass members of the cluster in the near future. This “ejection” process could play a major role in the formation of low mass stars and brown dwarfs.
graphicsx
1 Introduction
The detailed formation of stars is still a poorly understood process. In particular, the formation of the lowest mass stars and brown dwarfs is uncertain. Detailed 3D simulations of star formation by Bate et al. (2002) suggest that stellar embryos form into “mini-clusters” which dynamically decay “ejecting” the lowest mass members. Such theories can explain why there are far more field brown dwarfs (BD) compared to BD companions of solar type stars (McCarthy et al., 2003) or early M stars (Hinz et al., 2002). Moreover, these theories which invoke some sort of dynamical decay (Durisen, Sterzik, & Pickett, 2001) or ejection (Reipurth & Clarke, 2001) suggest that there should be no wide ( AU) very low mass (VLM; ) binary systems observed. Indeed, the AO surveys of Close et al. (2003a) and the HST surveys of Reid et al. (2001a); Burgasser et al. (2003); Bouy et al. (2003); Gizis et al. (2003) have not discovered any wide ( AU) VLM systems of the 34 systems known to date. As well, the dynamical biasing towards the ejection of the lowest mass members naturally suggests that the frequency of VLM binaries should be much less ( for ) than for more massive binaries ( for ). Indeed, observations suggest that the binarity of VLM systems with is (Close et al., 2003a; Burgasser et al., 2003) which, although higher than predicted is still lower than that of the of G star binaries Duquennoy & Mayor (1991).
Despite the success of these decay or ejection scenarios in predicting the observed properties of binary stars, it is still not clear that “mini-clusters” even exist in the early stages of star formation. To better understand whether such “mini-clusters” do exist we have examined the closest major OB star formation cluster for signs of such mini-clusters. Here we focus on the Ori stars in the Trapezium cluster. Trying to determine if some of the tight star groups in the Trapezium cluster are gravitationally bound is a first step to determining if bound “mini-clusters” exist. In particular, we will examine the case of the Ori B and A groups.
The Trapezium OB stars ( Ori A, B, C, D, and E) consists of the most massive OB stars located at the center of the Orion Nebula star formation cluster (for a review see Genzel & Stutzki (1989)). Due to the luminous nature of these stars they have been the target of several high-resolution imaging studies. Utilizing only tip-tilt compensation McCaughrean & Stauffer (1994) mapped the region at from the 3.5-m Calar Alto telescope. They noted that Ori B was really composed of 2 components ( & ) about apart. Higher resolutions were obtained from the same telescope by Petr et al. (1998) with speckle holographic observations. At these higher resolutions Petr et al. (1998) discovered that Ori was really itself a system ( & ) and that Ori A was really a binary ( & ). A large AO survey of the inner 6 square arcminutes was carried out by Simon, Close, & Beck (1999), who discovered a very faint (100 times fainter than ) object () located just between and . Moreover, a spectroscopic survey (Abt, Wang, & Cardona, 1991) showed that was really an eclipsing spectroscopic binary ( & ; sep. 0.13 AU; period 6.47 days). As well, Ori was also found to be a spectroscopic binary ( & ; sep. 1 AU; Bossi et al. (1989) ). Weigelt et al. (1999) carried out bispectrum speckle interferometric observations at the larger Russian SAO 6-m telescope (2 runs in 1997 and 1998). These observations showed Ori C was a very tight 0.033 binary. These observations also provided the first set of accurate relative positions for these stars. Schertl et al. (2003) has continued to monitor this cluster of stars and has independently detected an orbital motion (of for Ori around and a of for Ori around over a 5.5 yr baseline). They conclude that this is real orbital motion. We present additional recent AO observations of these binaries as an independent check to confirm that these motions are indeed real.
We first utilized the Gemini telescope (with the Hokupa’a AO system) and then observed Ori B during commissioning of the world’s first secondary deformable mirror at the 6.5-m MMT telescope. In this paper we outline how the observations were carried out, and how the stellar positions were measured. We fit the observed positions to calculate velocities (or upper limits) for the Ori B & A stars. In agreement with Schertl et al. (2003), we find that there is good evidence that the Ori B group may be a bound “mini-cluster” and that the Ori A group is also likely gravitationally bound.
2 OBSERVATIONS
We have utilized the University of Arizona adaptive secondary AO system to obtain the most recent high resolution images of the young stars in the Trapezium cluster (the Ori group).
2.1 The World’s First Adaptive Secondary AO System Scientific Results
The 6.5 m MMT telescope has a unique adaptive optics system. To reduce the aberrations caused by atmospheric turbulence all AO systems have a deformable mirror which is updated in shape at Hz. Until now all adaptive optics systems have located this deformable mirror (DM) at a re-imaged pupil (effectively a compressed image of the primary mirror). To reimage the pupil onto a DM typically requires 6-8 warm additional optical surfaces which significantly increases the thermal background and decreases the optical throughput of the system (Lloyd-Hart, 2000). However, the MMT utilizes a completely new type of DM. This DM is both the secondary mirror of the telescope and the DM of the AO system. In this manner there are no additional optics required in front of the science camera. Hence the emissivity is lower and the possibility of thermal IR AO imaging (Close et al., 2003b; Biller et al., 2003) becomes a reality.
The DM consists of 336 voice coil actuators that push on 336 small magnets glued to the backsurface of a thin (2.0 mm thick) 642 mm aspheric ULE glass “shell” (for a detailed review of the secondary mirror see (Brusa et al., 2003a, b)). We have complete positional control of the surface of this reflective shell by use of a capacitive sensor feedback loop. This positional feedback loop allows one to position an actuator of the shell to within 4 nm rms (total surface errors amount to only 40 nm rms over the whole secondary). The AO system samples at 550 Hz using 108 active subapertures. For a detailed review of the MMT AO system see Wildi et al. (2003a, b) and references within.
2.2 MMT AO Observations
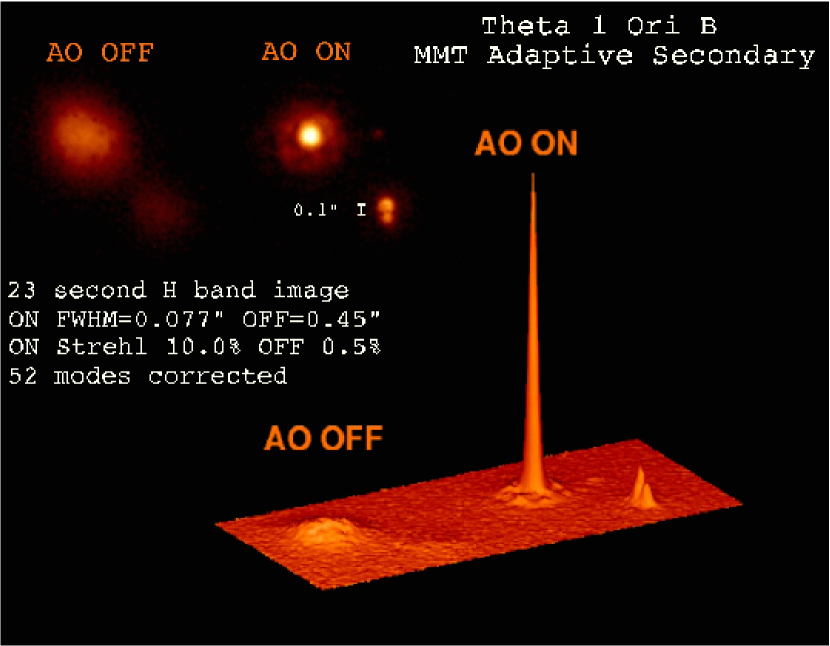
During our second engineering run we observed the Ori B group on the night of Jan 20, 2003 (UT). The AO system corrected the lowest 52 system modes and was updated at 550 Hz. The closed loop bandwidth was estimated at 30 Hz 0 dB. Without AO correction our images had FWHM=, after AO correction our 23 second images had improved to FWHM= (close to the diffraction limit of in the H-band). A detailed analysis suggested that during our engineering run a 40 Hz vibration in the MMT telescope increased our FWHM by and decreased our Strehl by a factor of two. We are in the process of identifying and decreasing the effect of this 40 Hz vibration. In any case, as Figure 1 clearly shows, there is a large improvement in image quality (the Strehl increases by 20 times) with the adaptive secondary AO system.
2.2.1 The Indigo Near-IR Video Camera
Since these observations were carried out during the engineering run we utilized a commercially available 320x256 InGaAs 0.9-1.68 “Merlin-NIR” video camera. Although this commercial camera (produced by the Indigo company) is not nearly as sensitive as our facility AO camera (AIRES; McCarthy et al. (1998)) it still provides excellent dynamical information about the performance of the AO system on bright objects (it will be replaced by the ARIES camera in the fall of 2003). Here we use it as a simple NIR (H band) science camera.
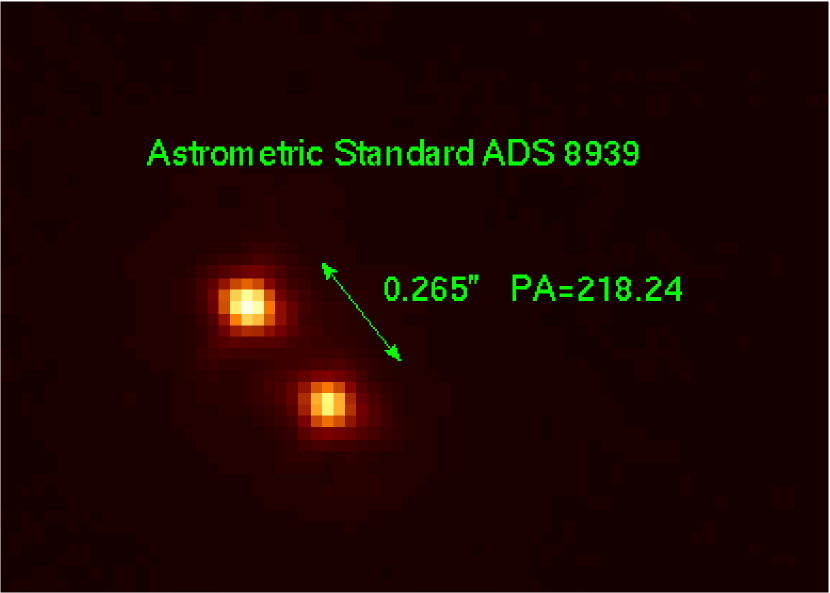
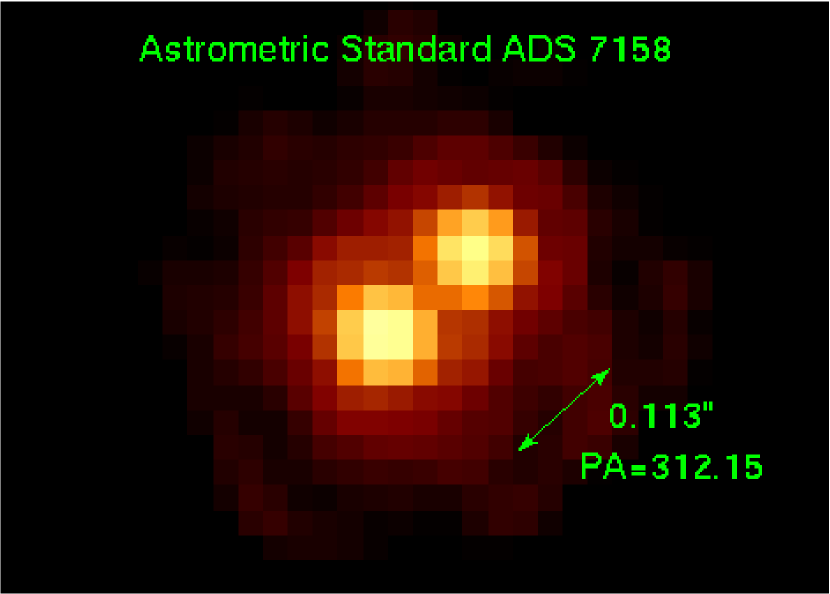
The Indigo camera was fed by a relay lens that converted the f/15 AO corrected beam to a f/39 beam yielding per pixel (providing a FOV). Astrometric standards ADS 8939 and ADS 7158 were observed to calibrate this platescale and error (see Figures 2 & 3). It was found that the direction of north was slightly () east of Indigo’s Y axis (when the parallactic angle was zero (transit) and one is looking towards the south). During this commissioning run we did not observe with the MMT Cassegrain derotator tracking field rotation, hence all images must be rotated by the appropriate parallactic angle (plus ) to have north up and east to the left on the Indigo camera.
The camera was mounted under a high optical quality dichroic which sent the visible light (0.5-1 ) to the 108 subaperture shack-Hartmann wavefront sensor (WFS). The infrared light () was transmitted to the Indigo camera. The camera had a standard H band filter () mounted 3 inches from focus in a light-tight barrel.
To maximize the sensitivity of the Indigo camera we carried out a standard “2-point” calibration on a both a dark (cold) flat field source and on a bright (hot) source to scale the automatic gain control/dynamic range of the camera’s electronics. This appeared to yield images that were auto flat fielded to a few percent in accuracy when the counts were between the linear range defined by the dark and bright calibration flats. The camera was remotely controlled via a serial port. Digital (16 bit) data were streamed to the control PC’s hard drive. Data could be acquired as fast as 50 frames per second (although data in this paper was acquired at 15 frames/sec to sample longer periods on the sky). Integration times can range from 1-16000 . The lack of a longer integration time (since the camera is primarily intended for commercial high-background, high-bandwidth applications) leads to most sources being read-noise limited. However, we found that point sources of could be detected in 3 s of total exposure (200 16 ms frames) with AO correction at the MMT. Although insensitive by most astronomical standards the Indigo camera is able to capture temporal events of durations as short as 1 . In this paper we will focus on the ability of the Indigo camera to produce high resolution () images of the Ori B group.
2.2.2 Reducing the Indigo MMT AO Data
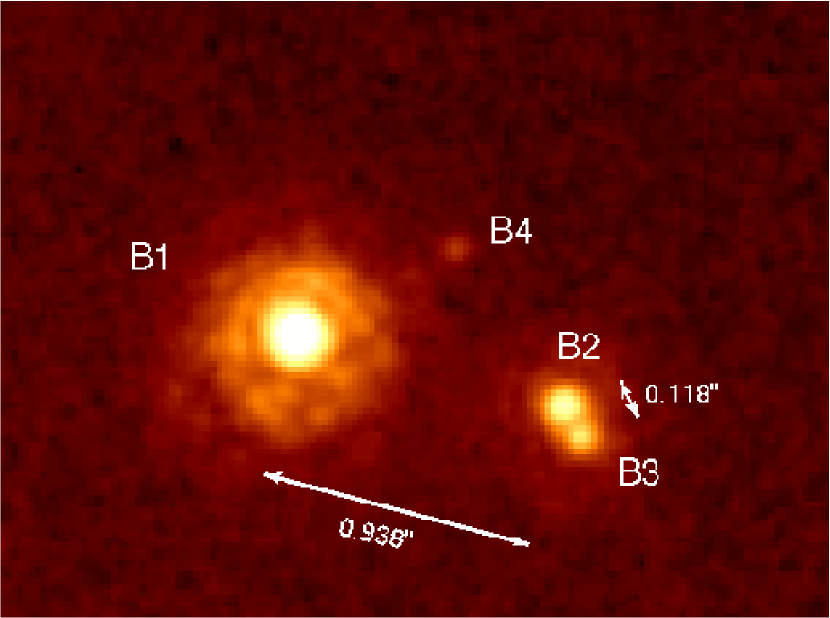
For the Ori B group we obtained 7 series of 200x16 ms data cubes with the Indigo camera. The data from each cube was simply averaged together to produce 7 individual 3.2 second exposures. A similarly reduced cube of “sky” images was subtracted from each data set. These 7 sky-subtracted exposures were then rotated (in IRAF) by the current parallactic angle (plus the offset) so north was aligned with the Y axis, and east is the negative X axis. Then each of the 7 images were cross-correlated and aligned with a cubic spline interpolator. Then the final stack of images were median combined to produce the final image. The final image is displayed in Figure 4.
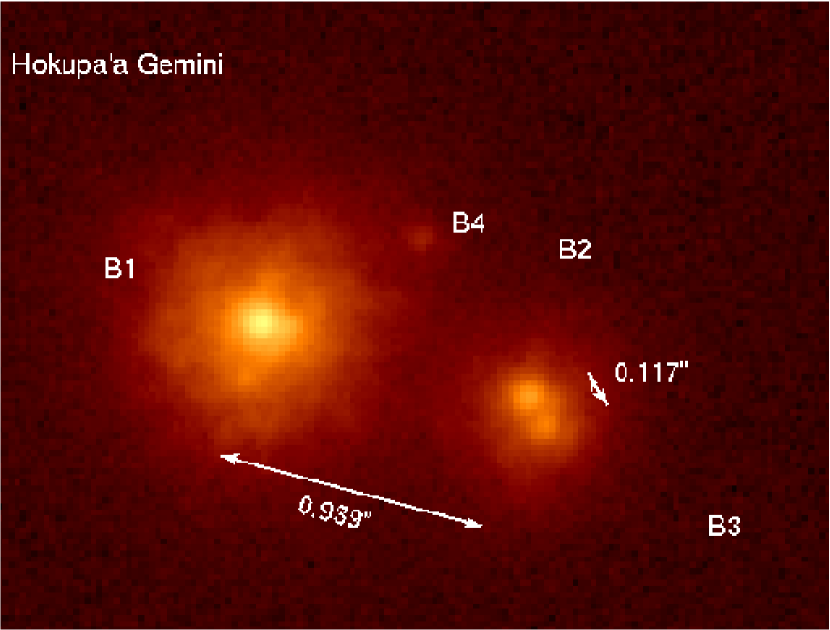
2.3 Hokupa’a/Gemini Images of the Trapezium
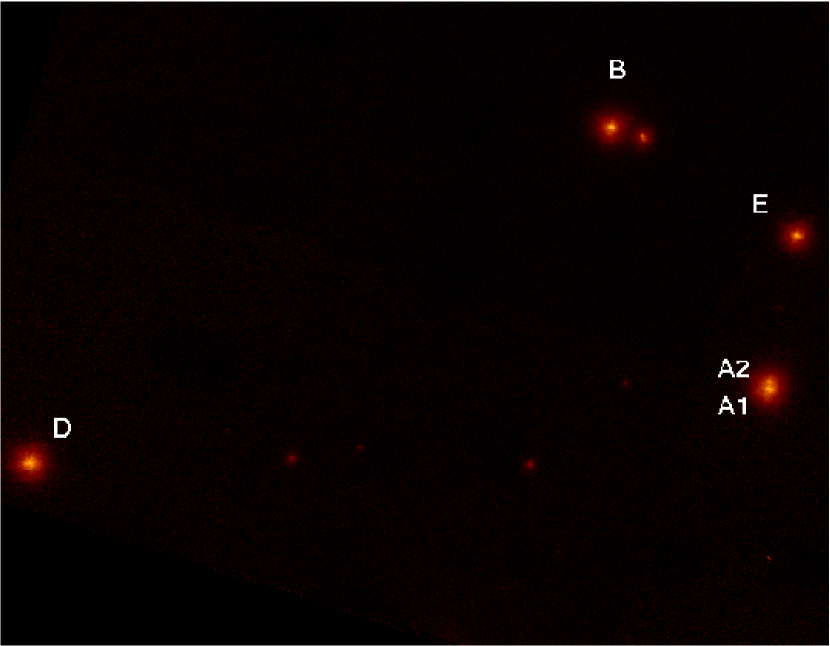
In addition to our excellent MMT images of the Ori B group we also have an epoch of images of the central of the cluster. These Hokupa’a/Gemini (Graves et al., 1998; Close et al., 1998) AO images were taken September 19, 2001. We acquired a series of 10 short (1 s) images and dithered the telescope in a 10x10 box while AO guiding off Ori B itself (as in the case of the MMT AO observations). We utilized the QUIRC IR camera (Hodapp et al., 1996) with a calibrated platescale of /pix (Potter et al., 2002a).
2.3.1 Reducing the Gemini data
We have developed an AO data reduction pipeline in the IRAF language which maximizes sensitivity and image resolution. This pipeline is standard IR AO data reduction and is described in detail in Close et al. (2002a, b).
The pipeline cross-correlates and aligns each image, then rotates each image so north is up (to an accuracy of degrees) and east is to the left, then median combines the data with an average sigma clip rejection at the level. By use of a cubic-spline interpolator the script preserves image resolution to the pixel level. Next the custom IRAF script produces two final output images, one that combines all the images taken (see Figure 5) and another where only the sharpest 50% of the images are combined (this high-Strehl image was very similar to that shown in Figure 5, just a bit noisier – and so was not further analyzed).
The final image (see Figures 5 and 6) has FWHM= which is just slightly worse than the MMT data. Even though Gemini is a larger telescope (8.2-m), Hokupa’a’s fitting error (36 elements over 50 meters2) is worse than that of the MMT (52 modes over 33 meters2), hence higher resolution images can result from the smaller of the two telescopes (Gemini has a diffraction-limit of at similar to that of the MMT at H). However, Hokupa’a’s curvature WFS could guide on much fainter (R) guide stars (Close et al., 2002a, b; Siegler, Close, & Freed, 2002).
3 Reductions
In Table 1 we present the analysis of our MMT and Gemini images in Figures 4 and 5. The photometry was based on DAOPHOT’s PSF fitting photometry task ALLSTARS (Stetson, 1987). The PSF used was Ori itself. Since all the members of the Ori group are located within of Ori the PSF fit is excellent (there is no detectable change in PSF morphology due to anisoplanatic effects inside the Ori B group (Diolaiti et al., 2000)).
Since the PSF model was so accurate and the data had such high signal to noise (and high resolution) it was possible for DAOPHOT to measure relative positions to within . We estimate this error based on the scatter of the Ori separation (which should be very close to a constant since the system has an orbital period of yr). The lack of any motion between and is also confirmed by Schertl et al. (2003). Our data is summarized in Table 1. Linear (weighted) fits to the data in Table 1 (Figures 7 to 12) yield the velocities shown in Table 1. The overall error in the relative proper motions observed is /yr in proper motion ( km/s).
4 ANALYSIS
With these accuracies it is now possible to determine whether these stars in the Ori group are bound together, or merely chance projections in this very crowded region. As can be seen from Table 1 and Figures 7 – 12 there is very little relative motion between any of the members of the Ori group. Therefore it is possible that the group is physically bound together.
If we adopt the masses of each star from the Siess Forestini & Dougados (1997); Bernasconi & Maeder (1996) tracks fit by Weigelt et al. (1999) we find masses of: ; ; ; ; ; ; ; and . Based on these masses (which are similar to those adopted by Schertl et al. (2003)) we can comment on whether the observed motions are less than the escape velocities expected for simple face-on circular orbits.
Our combination of high spatial resolution and high signal to noise yields an error in the proper motions of only /yr according to the scatter in the and systems (see Table 1). We have observed orbital motion in the very tight Ori (see Figure 10) and Ori (see Figure 12) systems, with 52 and 94 AU separations; respectively.
4.1 Is the Ori System Physical?
The relative velocity in the Ori system (in the plane of the sky) is km/s (mainly in the azimuthal direction; see Figure 10). This is a reasonable since an orbital velocity of km/s is expected from a face-on circular orbit from a binary system like Ori with a 52 AU projected separation. It is worth noting that this velocity is also greater than the km/s Hillenbrand & Hartmann (1998) dispersion velocity of the cluster. Hence it is most likely that these two and stars (separated by just 0.116) are indeed in orbit around each other. Moreover, there are only 10 stars known to have in the inner (see Figure 6), we can estimate that the chances of finding two bright () stars within is a small probability.
Our observed velocity of /yr is consistent (in both direction and magnitude) with the /yr observed by Schertl et al. (2003). This suggests that the AO and speckle datasets are both detecting real motion. Moreover, since this motion is primarily azimuthal strongly suggests an orbital arc of orbiting .
4.2 Is the Ori System Physical?
We observe km/s of relative motion in the Ori system (mainly in the azimuthal direction; see Figure 12). This is higher than the average dispersion velocity of km/s but still close to an estimated periastron velocity of the system (projected separation of 94 AU). Hence it is highly likely that these two and stars (separated by just 0.21) are indeed in orbit around each other. In addition, there are only 8 stars known to have in the inner (see Figure 6), we can estimate that the chances of finding two bright () stars within is a small probability.
Our observed velocity of km/s is consistent (in both direction and magnitude) with the km/s observed by Schertl et al. (2003). This again suggests that the AO and speckle datasets are both detecting real motion of orbiting .
4.3 Is the Ori B Group Stable?
The pair is moving at km/s in the plane of the sky w.r.t. to the pair where the escape velocity km/s for this system. Hence these pairs are very likely gravitationally bound together. However, radial velocity measurements will be required to be absolutely sure that these 2 pairs are bound together.
4.3.1 Is the Orbit of Ori Stable?
The situation is somewhat different for the faintest component of the group, . It has mag which according to Hillenbrand & Carpenter (2000) suggests a mass of only . Since there are only 20 stars known to have in the inner (see Fig. 6), we can estimate that the chances of finding a star within of is a small probability. Our two AO measurements (and the one speckle detection of Schertl et al. (2003)) did not detect a significant velocity of w.r.t. ( km/s; see Figures 13 & 14). Together with the escape velocity of km/s, this points towards being also a gravitationally bound member of the Ori B group.
On the other hand, its mass and its location w.r.t. to the other four groups members makes it highly unlikely that is on a stable orbit within the group. To reconcile these conflicting observations, one may think of (a) ’s projected distances from the other B group members being considerably smaller than the true distance thus making a stable orbit much more likely, or (b) ’s current motion pointing almost exactly along our line of sight, allowing for a higher true velocity, or (c) being a chance projection of an object not related to the other four members of the B group. Without additional astrometric data, we cannot yet decide which of these three possibilities is the most likely.
4.3.2 Is the orbit of around and of around stable longterm?
, and are two binaries with projected separations of 0.13 AU () and 52 AU (); respectively. The two pairs are separated by a projected distance of 415 AU. The distance and thus the system is stable. Much more interesting is the case of . Their projected distance is not very small compared to their projected distance (D) from the pair:. Thus the stability of the orbit needs a more detailed analysis since it is possible that may be ejected in the future.
Eggelton & Kiseleva (1995) have given an empirical criterion for the long-term stability of the orbits of hierarchical triple systems, based on the results of their extensive model calculations (Kiseleva & Eggelton, 1994; Kiseleva et al., 1994; Eggelton & Kiseleva, 1995). Their analytic stability criterion is good to about , and is meant to indicate stability for another orbits. Given the uncertainties of the masses of the members of the B group, this accuracy is sufficient for our present discussion.
The orbital period of the two binaries w.r.t. each other is yrs, while the orbital period of w.r.t amounts to yrs. For the calculation of both periods, we have assumed the masses as given above, and circular orbits in the plane of the sky. This leads to a period ratio . Eggelton & Kiseleva’s stability criterion requires for the masses in the B group. This means that within the accuracy limits of our investigation, the binary is just at the limit of stability. The stability criterion depends also on the orbits’ eccentricities. In our case, already mild eccentricities of the order of (as can be expected to develop in hierarchical triple systems; see, e.g., Georgakarakos 2002), make the B group unstable. While we cannot decide yet whether the pair orbit each other in a stable way, it is safe to say that that the “triple” , , and is not a simple, stable hierarchical triple system.
The Ori B system seems to be a good example of a highly dynamic star formation ”mini-cluster” which is possibly in the process of ejecting the lowest-mass member through dynamical decay (Durisen, Sterzik, & Pickett, 2001), and breaking up the gravitational binding of the widest of the close binaries (the system). The ”ejection” of the lowest-mass member of a formation ”mini-cluster” could play a major role in the formation of low mass stars and brown dwarfs (Reid et al., 2001a; Bate et al., 2002; Durisen, Sterzik, & Pickett, 2001; Close et al., 2003a). The breaking up of binaries, of course, modifies the binary fraction of main sequence stars considerably as well.
5 Future observations
In our opinion it is most likely that these Ori A & B group stars are bound. We caution, however, that the motion of each of these stars could currently be fit equally well by linear motion (not orbital arcs). Future high resolution observations are required to see if these stars follow true orbital arcs around each other proving that they are interacting. In particular, future observations of the Ori positions would help reduce the scatter in the velocity data and indicate if it is indeed part of the Ori B group.
Future observations should also try to determine the radial velocities of these stars. Once radial velocities are known one can calculate unambiguously if these systems are bound. Such observations will require both very high spatial and spectral resolutions. This might be possible with such future instruments like the future AO fed ARIES instrument.
References
- Abt, Wang, & Cardona (1991) Abt H.A., Wang R., Cardona O., 1991, ApJ, 367, 155
- Bate et al. (2002) Bate, M.R., Bonnell, I.A., Bromm, V. 2002, MNRAS, 332, L65
- Bernasconi & Maeder (1996) Bernasconi P.A., & Maeder A. 1996, A&A, 307, 829
- Biller et al. (2003) Biller, B., et al. 2003, ApJ, submitted.
- Brusa et al. (2003a) Brusa, G., et al. 2003a, Proc. SPIE 4839, 691.
- Brusa et al. (2003b) Brusa, G., et al. 2003b, Proc. SPIE in prep.
- Burgasser et al. (2003) Burgasser, A. et al. 2003a, ApJ, in press
- Burrows et al. (2000) Burrows, A., Hubbard, W. B., Lunine, J. I., Marley, M. S., Saumon, D. 2000, Protostars and Planets IV (Tucson: University of Arizona Press, eds Mannings, V., Boss, A.P., Russell, S. S.), p. 1339
- Bouy et al. (2003) Bouy, H., Brandner W., Martín, E., Delfosse, X., Allard, F., & Basri, G. 2003, AJ, in press
- Bossi et al. (1989) Bossi M., Gaspani A., Scardia M., Tadini M., 1989, A&A, 222, 117
- Chabrier et al. (2000) Chabrier, G., Baraffe, I., Allard, F., & Hauschildt, P. 2000, ApJ, 542, 464
- Close et al. (1998) Close, L.M., Roddier, F.J., Roddier, C.A., Graves, J.E., Northcott, M.J., Potter, D. 1998, Proc. SPIE Vol. 3353, p. 406-416. Adaptive Optical System Technologies, D. Bonaccini, R.K. Tyson, Eds
- Close (2000) Close, L. M. 2000, Proc. SPIE Vol. 4007, p758-772. Adaptive Optical Systems Technology, P.L. Wizinowich, Ed.
- Close et al. (2002a) Close, L.M. et. al. 2002a, ApJ, 566, 1095.
- Close et al. (2002b) Close, L.M. et. al. 2002b, ApJ, 567, L53.
- Close (2003) Close, L.M. 2002, Proc. SPIE Vol. 4834-12 Research Prospects on Large 6.5-10m Telescopes. Aug 2002, Kona. in press
- Close et al. (2003a) Close, L.M., Siegler, N., Freed, M., Biller, B. 2003a ApJ, 587, 407
- Close et al. (2003b) Close, L.M. et al. 2003b ApJ, submitted
- Diolaiti et al. (2000) Diolaiti, E., Bendinelli, O. Bonaccini, D.; Close, L Currie, D. Parmeggiani, G. 2000, A&AS 147, 335
- Durisen, Sterzik, & Pickett (2001) Durisen, R.H., Sterzik, M.F., & Pickett, B.K. 2001, A&A, 371, 952
- Duquennoy & Mayor (1991) Duquennoy, A., Mayor, M. 1991, A&A, 248, 485
- Eggelton & Kiseleva (1995) Eggelton P., Kiseleva L., 1995, ApJ, 455, 640
- Fischer & Marcy (1992) Fischer, D. A., Marcy, G. W. 1992, ApJ, 396, 178
- Freed, Close, & Siegler (2003) Freed, M., Close, L.M., & Siegler, N. 2003, ApJ, 584, 453
- Genzel & Stutzki (1989) Genzel R., Stutzki J., 1989, ARA&A 27, 41
- Graves et al. (1998) Graves, J.E., Northcott, M.J., Roddier, F.J., Roddier, C.A., Close, L.M. 1988, Proc. SPIE Vol. 3353, p. 34-43. Adaptive Optical System Technologies, D. Bonaccini, R.K. Tyson, Eds.
- Gizis et al. (2003) Gizis, J.E. et al. 2003, ApJ, in press
- Hillenbrand & Carpenter (2000) Hillenbrand L.A., & Carpenter J. 2000 ApJ, 540, 236
- Hillenbrand & Hartmann (1998) Hillenbrand L.A., & Hartmann L.W. 1998 ApJ, 492, 540
- Hinz et al. (2002) Hinz J.L., McCarthy D.W., Simons, D.A., Henry T.J., Kirkpatrick J.D., McGuire P.C. 2002, AJ, 123, 2027
- Hodapp et al. (1996) Hodapp, K.-W., Hora, J. L., Hall, D. N. B., Cowie, L. L., Metzger, M., Irwin, E., Vural, K., Kozlowski, L. J., Cabelli, S. A., Chen, C. Y., Cooper, D. E., Bostrup, G. L., Bailey, R. B., Kleinhans, W. E. 1996, New Astronomy, 1, 177
- Kiseleva & Eggelton (1994) Kiseleva L.G., Eggelton P.P., Anosova J.P., 1994, MNRAS 267, 161
- Kiseleva et al. (1994) Kiseleva L.G., Eggelton P.P., Orlov V.V., 1994, MNRAS 270, 936
- Lloyd-Hart (2000) Lloyd-Hart M. 2000, PASP 112, 264
- McCaughrean & Stauffer (1994) McCaughrean M.J, & Stauffer J.R., 1994, AJ, 108, 1382
- McCarthy et al. (2003) McCarthy C. et al. IAU conf. “Brown Dwarfs” Kona in press
- McCarthy et al. (1998) McCarthy D.W. et al. 1998, Proc. SPIE 3354 750
- McDonald & Clarke (1995) McDonald, J. M., & Clarke, C. J. 1993, MNRAS, 262, 800
- Petr et al. (1998) Petr M.G., Du Foresto V., Beckwith S.V.W., Richichi A., McCaughrean M.J. 1998, ApJ, 500, 825
- Potter et al. (2002a) Potter, D. et al. 2002a ApJ, 567, 113
- Reid et al. (2001a) Reid, I. N., Gizis, J.E., Kirkpatrick, J.D., Koerner, D. W. 2001a, AJ, 121, 489
- Reid et al. (2001b) Reid, I. N., Burgasser, A. J., Cruz, K. L., Kirkpatrick, J. D., Gizis, J. E. 2001b, AJ, 121, 1710
- Reipurth & Clarke (2001) Reipurth, B. & Clarke, C. 2001, AJ, 122, 432
- Schertl et al. (2003) Schertl, D., Balega, Y.Y., Preibisch, Th., & Weigelt, G. 2003, A&A, 402, 267
- Siegler, Close, & Freed (2002) Siegler, N., Close, L.M., Freed, M. 2002, SPIE Kona conf. proc., in press
- Siegler et al. (2003) Siegler, N., Close, L.M., Mamajek, E., Freed, M. 2003, ApJ, in press
- Siess Forestini & Dougados (1997) Siess L., Forestini M., Dougados C., 1997, A&A 324, 556
- Simon, Close, & Beck (1999) Simon, M., Close, L.M., & Beck, T. 1999, AJ, 117, 1375
- Sterzik & Durisen (1998) Sterzik, M. F., & Durisen, R. H. 1998 A&A, 339, 95
- Stetson (1987) Stetson, P. B. 1987, PASP, 99, 191
- Wainscoat & Cowie (1992) Wainscoat R. J., & Cowie, L.L. 1992, AJ, 103, 332.
- Weigelt et al. (1999) Weigelt G., Balega, Y., Preibisch T., Schertl D., Scholler M., Zinnecker H. 1999, A&A, 347, L15
- Wildi et al. (2003a) Wildi F., Brusa G., Riccardi A., Lloyd-Hart M., Martin H.M., L.M. Close proc. SPIE 4839, 155
- Wildi et al. (2003b) Wildi F. et al. 2003b JOSA, in prep.
| System | Separation | Separation Vel. | PA | PA Velocity | Telescope | epoch | ||
|---|---|---|---|---|---|---|---|---|
| name | (mag) | (mag) | () | (Sep. /yr) | (∘) | (∘/yr) | (m/d/y) | |
| SAOaaspeckle observations of Weigelt et al. (1999). | 10/14/97 | |||||||
| bbthese low values are possibly due to Ori being in eclipse during the 11/03/98 observations of Weigelt et al. (1999). | SAOaaspeckle observations of Weigelt et al. (1999). | 11/03/98 | ||||||
| GEMINI | 09/19/01 | |||||||
| MMT | 01/20/03 | |||||||
| -0.0006/yr | 0.07/yr | |||||||
| SAOaaspeckle observations of Weigelt et al. (1999). | 10/14/97 | |||||||
| SAOaaspeckle observations of Weigelt et al. (1999). | 11/03/98 | |||||||
| GEMINI | 09/19/01 | |||||||
| MMT | 01/20/03 | |||||||
| /yr | 0.93/yr | |||||||
| SAOccspeckle observations of Schertl et al. (2003). | 02/07/01 | |||||||
| GEMINI | 09/19/01 | |||||||
| MMT | 01/20/03 | |||||||
| /yr | 0.18/yr | |||||||
| Calar Altoddspeckle observations of Petr et al. (1998). | 11/15/94 | |||||||
| SAOaaspeckle observations of Weigelt et al. (1999). | 11/03/98 | |||||||
| GEMINI | 09/19/01 | |||||||
| /yr | 2.13/yr |