Using Multi-Band Photometry to Classify Supernovae
1 Abstract
Large numbers of supernovae (SNe) have been discovered in recent years, and many more will be found in the near future. Once discovered, further study of a SN and its possible use as an astronomical tool (e.g., as a distance estimator) require knowledge of the SN type. Current classification methods rely almost solely on the analysis of SN spectra to determine their type. However, spectroscopy may not be possible or practical. We present a classification method for SNe based on the comparison of their observed colors with synthetic ones, calculated from a large database of multi-epoch optical spectra of nearby events. Broadband photometry at optical wavelengths allows classification of SNe up to , and the use of infrared bands extends it further to . We demonstrate the applicability of this method, outline the observational data required to further improve the usefulness of the method, and discuss prospects for its use on future SN samples. Community access to the tools developed is provided by a dedicated website.111See http://wise-obs.tau.ac.il/dovip/typing
2 Introduction
Once discovered, the study of a particular supernova (SN), and its use as a tool for any application, is almost always based on spectroscopic verification and classification, but this follow-up may not always be a viable option. First, the interesting population of very distant () supernovae (SNe), where the mark of cosmic deceleration should be detected, is usually fainter than 25 mag, the practical limit for spectroscopy. Second, the fast evolution of astronomical archives, toward the realization of the “virtual observatory” concept, is expected to produce a large number of SNe discovered in retrospective studies, for which any follow up is, of course, impossible. And last, spectroscopy is impossible if large numbers (hundreds or thousands) of SNe are detected within a relatively short time.
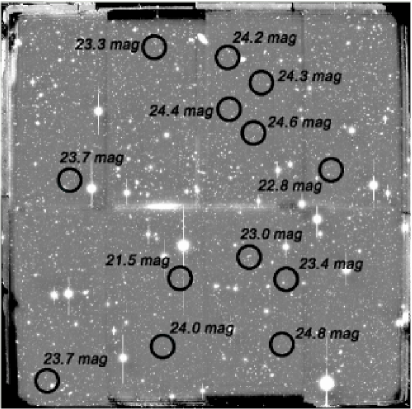
In an example of such occurrence, we have acquired with B. Jannuzi, deep (lim. mag 26) and wide (3636′) images with the mosaic camera mounted on the KPNO 4m telescope, on two epochs. The difference image of these two frames, reveals dozens of candidate SNe of which only the brightest, which can be seen in Figure 1, can be observed spectroscopically. We have confirmation for two of these objects, which are indeeed SNe Ia at redshifts of 0.21 and 0.67 circ . Since these SNe are in a well studied field, we have redshifts for most of the galaxies, and hence for the candidate SNe, and can compute the SN redshift distribution in addition to the faint SN counts. As we will show below, a similar dataset with photometry in more than one band would allow a separation of such an analysis to the different SN types.
The next alternative to spectroscopy is the use of multi-color broadband photometry to classify SNe. In a recent paper P1 we have shown that in the absence of spectral information, much can be gleaned from the broad band colors of the SN. First, most SNe discovered are associated with host galaxies, so their redshift is either known, or can be measured long after the SN has faded (using spectroscopy or photometric redshifts). Second, by comparing the colors of the SN in question to those expected for SNe of various types, at various ages, and at the known redshift, one can determine, or at least constrain, its age and type.
3 Method
In order to compute the expected colors of SNe of all types at a chosen , we have compiled a large database of high signal-to-noise spectra of nearby SNe, mostly from Lick Observatory. We can then derive synthetic photometry from these spectra at any given redshift. The use of synthetic colors is the key that allows the tracing of the color behavior, i.e., the time evolution of the the colors, of the various SN types, at arbitrary redshift. Using color-color diagrams one can then look for areas that are either populated by one type of SNe or not populated by others. Our method allows the classification of SNe up to a redshift of 0.75 using optical bands, while the use of infrared bands increases the range up to .
3.1 Example Diagram & Application
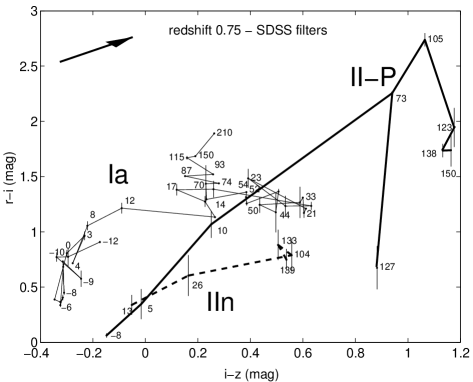
Figure 2 shows an example of the color paths of SNe of type Ia, II-P, and IIn (other types are omitted for clarity), at in the Sloan colors versus . The numbers along the curves represent the time in days relative to maximum -band brightness. One sees that most SNe before maximum light are blue, with mag, but Ia SNe are significantly bluer with mag, while being redder in . Older SNe II-P have the reddest colors of all SNe with mag, and IIn SNe have consistently lower colors than Ia SNe. The arrow shows the reddening effect corresponding to mag of extinction in the host galaxy, assuming the Galactic reddening curve of Cardelli et al. (1989). One can see that the unique colors of young ( days) and very old ( days) SNe Ia cannot be masked even by significant reddening in their host, so that some candidates with appropriate observed colors can be uniquely determined to be SNe Ia. Even when the type of a SN cannot be uniquely determined, it may still be deduced by supplementing the color information with other available data on the SN, such as constraints on its brightness, and information (even if very limited) on its variability (e.g., whether its flux is rising or declining).
Since the classification of a particular SN at a given redshift and with specific observed colors requires the generation of custom diagrams, we have built a dedicated web site (http://wise-obs.tau.ac.il/dovip/typing/) that allows the astronomical community access to the tool have we developed.
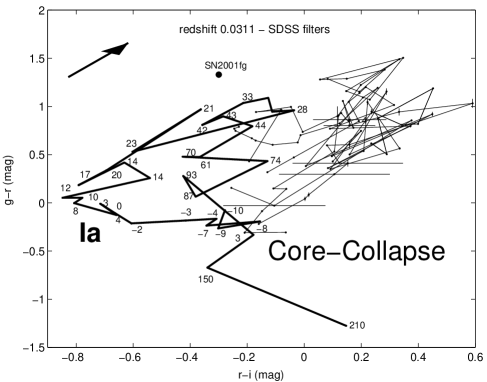
An example of such an application is shown in Figure 3. SN 2001fg was one of the first SNe reported from SDSS data. This event was discovered on 15 October 2001 UT vanden with , , and mag. Inspecting the color-color diagram calculated for the appropriate redshift (, see below), one can see (Figure 3) that the type and approximate age of the SN candidate can be deduced. The diagram clearly indicates this is a SN Ia, about one month old. Followup spectra fili using the Keck II 10-m telescope reveal that the object is indeed a SN Ia, at . The spectrum is similar to those of SNe Ia about two months past maximum brightness. This age, at the time of the spectral observation (18 November UT), implies an age around one month past maximum brightness at discovery, confirming our diagnosis. A fully “blind” application would have, of course, required an independent photometric or spectroscopic redshift for the SN host galaxy.
4 Conclusions and Future Prospects
We have shown that SNe can be classified using broad band colors, so that spectroscopy is not a prerequisite. Such an approach will enable the analysis of larger number of SNe, as expected to be discovered in the coming years, but with limited information. This is important especially at high where spectroscopy becomes almost impossible.
In order to better sample the evolution of the covered SN types, we plan to enrich the spectral database used. This will smooth the current scatter seen, e.g., in Figure 2, which is largely due to variations between individual objects. We also intend to incorporate spectra of 1998bw-like Ic SNe, also called hypernovae ham03 , associated with gamma-ray bursts. Finally, in order to enable classification of higher redshift SNe observed in optical bands, UV spectra, of which only a handful exist pana , will be added to the database.
References
- (1) Filippenko, A. V. & Chornock, R. 2001, IAUC, 7754, 2
- (2) Hamuy, M. 2003, ApJ, 582, 905
- (3) Panagia, N. 2003, to be published in Supernovae and Gamma ray Bursters, ed. K. W. Weiler, Springer-Verlag, Berlin-Heidelberg-New York
- (4) Poznanski, D., Gal-Yam, A., Maoz, D., Filippenko, A. V., Leonard, D. C., & Matheson, T. 2002, PASP, 114, 833
- (5) Poznanski, D., Gal-Yam, A., Sharon, K., Maoz, D., & Jannuzi, B. T. 2003, IAUC, 8058, 1
- (6) Vanden Berk, D., Wilhite, B., Miceli, A., Stubbs, C., & Lawton, B. 2001, IAUC, 7744, 1