Flash Mixing on the White Dwarf Cooling Curve:
FUSE Observations of three He-rich sdB Stars11affiliation: Based on observations made with the NASA-CNES-CSA
Far Ultraviolet Spectroscopic Explorer. FUSE is operated for NASA
by the Johns Hopkins University under NASA contract NAS5-32985.
Abstract
We present Far-Ultraviolet Spectroscopic Explorer (FUSE) spectra of three He-rich sdB stars. Two of these stars, PG1544+488 and JL87, reveal extremely strong C III lines at 977 and 1176 Å, while the carbon lines are quite weak in the third star, LB1766. We have analyzed the FUSE data using Tlusty NLTE line-blanketed model atmospheres, and find that PG1544+488 has a surface composition of 96% He, 2% C, and 1% N. JL87 shows a similar surface enrichment of carbon and nitrogen, but some significant fraction of hydrogen still remains in its atmosphere. Finally, LB1766 has a surface composition devoid of hydrogen and strongly depleted of carbon, indicating that its surface material has undergone CN-cycle processing.
We interpret these observations with new evolutionary calculations which suggest that He-rich sdB stars with C-rich compositions are the progeny of stars which underwent a delayed helium-core flash on the white-dwarf cooling curve. During such a flash the interior convection zone will penetrate into the hydrogen envelope, thereby mixing the envelope with the He- and C-rich core. Such “flash-mixed” stars will arrive on the extreme horizontal branch (EHB) with He- and C-rich surface compositions and will be hotter than the hottest canonical (i.e., unmixed) EHB stars. Two types of flash mixing are possible: “deep” and “shallow”, depending on whether the hydrogen envelope is mixed deeply into the site of the helium flash or only with the outer layers of the core. Based on both their stellar parameters and surface compositions, we suggest that PG1544+488 and JL87 are examples of “deep” and “shallow” flash mixing, respectively. Flash mixing may therefore represent a new evolutionary channel for producing the hottest EHB stars. However, flash mixing cannot explain the abundance pattern in LB1766, which remains a challenge to current evolutionary models.
1 Introduction
The formation mechanisms of subdwarf B (sdB) stars have been the source of considerable interest for decades. In the Galactic field, sdB stars are distinguished by their high effective temperatures, K, and high surface gravities, . In the globular clusters they are identified with the extreme horizontal branch (EHB) stars found at the faint end of the long blue HB tail in such clusters as NGC 6752 and M 13. The range in on the HB comes from the range in envelope mass that lies above the hot helium-burning core. Stars at the cool end of the HB have a large envelope (), while stars at the hot end of the HB have an extremely thin envelope (). This range in envelope mass is the result of a range in mass loss during the red giant branch (RGB) phase, where the hottest HB stars have lost several tenths of a solar mass.
Normally, low-mass stars ignite helium at the tip of the RGB during the helium-core flash. However, if they undergo very high mass loss, stars will leave the RGB and ignite helium while descending the white-dwarf (WD) cooling curve (Castellani & Castellani, 1993). D’Cruz et al. (1996) suggested that such stars might provide another avenue for populating the hot end of the HB. When stars undergo a late helium-core flash on the WD cooling curve, Sweigart (1997) showed that the thin hydrogen envelope will be mixed with the helium- and carbon-rich core. The high helium-burning luminosity at the peak of the flash () drives a temporary convection zone that extends from the site of the flash outward through the core. Ordinarily this flash convection zone does not penetrate into the hydrogen envelope due to the high entropy of the hydrogen-burning shell. However, when the flash happens on the WD cooling curve, it does so in the presence of a much weaker hydrogen-burning shell. The associated entropy barrier is then lower and can be overcome, allowing the flash convection zone to penetrate into the hydrogen envelope. The thin hydrogen envelope is quickly mixed into the helium-burning core. This “flash mixing” produces a hydrogen-deficient, helium-burning star with enhanced helium and carbon in the envelope. A similar process has been proposed to explain the extremely hydrogen-poor R Coronae Borealis stars (also known as “born-again” stars), whereby the surface hydrogen is mixed inward during a helium-shell flash on the WD cooling curve (Renzini, 1990).
Flash-mixed HB stars might explain the anomalies in the hot HB population of the globular cluster NGC 2808 (Brown et al. 2001, hereafter Paper I; Sweigart et al. 2002). Optical color-magnitude diagrams (CMDs) of this cluster show a gap within the EHB (Sosin et al., 1997; Walker, 1999; Bedin et al., 2000), while an ultraviolet CMD shows a significant population of stars lying up to 0.7 mag below the canonical EHB (Paper I). Neither of these anomalies can be explained by canonical HB models. Subluminous EHB stars also appear in the ultraviolet CMD of Centauri (D’Cruz et al., 2000). It remains unclear, however, why we find these subluminous EHB stars in NGC 2808 and in Cen, but not in other globular clusters with extended blue HB morphologies, such as NGC 6752 and M 13.
In order to understand the origin of these hot HB anomalies, Brown et al. (2001) systematically explored the effect of increased mass loss on the evolutionary track of a low-mass star at the metallicity of NGC 2808. They found that the overall properties of the hot HB stars are significantly altered as soon as flash mixing takes place. As long as the stars maintain a thin hydrogen-rich envelope, they will be found at the hot end of the HB at effective temperatures up to K. However, all flash-mixed HB stars with helium-rich envelopes are hotter by about 5 000 to 6 000 K, creating a gap in the predicted HB distribution in optical CMDs. Moreover, model atmosphere calculations show that the flash-mixed stars are fainter in the ultraviolet due to flux redistribution between the extreme-UV and the far-UV. The reduced hydrogen opacity below 912 Å permits more of the flux to be radiated in the extreme UV at the expense of the flux at longer wavelengths. For these reasons Brown et al. (2001) suggested that both the gap within the EHB and the subluminous EHB stars in NGC 2808 are the result of flash mixing on the WD cooling curve.
Extreme HB stars are very faint objects, and consequently the quantitative spectroscopic analyses of these stars remain scarce in the literature. Recently, Moehler et al. (2002) reported on an analysis of low resolution, optical spectra of very hot HB stars in Centauri. Despite the limited quality of the data, Moehler et al. (2002) derived high temperatures and high helium abundances in general support of the flash-mixing scenario. On the other hand, Ahmad & Jeffery (2003) have just completed an analysis of low resolution optical spectra of 17 helium-rich subdwarf (He-sdB) stars in the Galactic field. In general, they derive low surface gravities (), which they argue do not agree with the flash-mixing scenario. The surface gravities of the He-sdB stars thus provide an important diagnostic for deciphering the evolutionary origin of these stars. Quite interestingly, about half of the stars in these two samples show an indication of carbon enrichment (C II 4267), but a quantitative analysis will require higher quality spectra.
One would also expect to find flash-mixed EHB stars in the Galactic field. In this case, we need to identify them spectroscopically. He-sdB stars are likely candidates. Subdwarfs are generally classified according to the He I, He II, and Balmer lines (Green et al., 1986; Saffer et al., 1994; Jeffery et al., 1997). The optical spectrum of most sdB stars reveals strong, broad Balmer lines, indicating high surface gravity, and little or no He I absorption. However, about 5% of the sdB stars exhibit strong helium lines, and weak or even no Balmer lines. PG1544+488 is the prototype of this spectral class, designated originally as sdO(D) stars by Green et al. (1986). The true fraction of sdB stars that are helium-rich is unknown, because surveys of sdB stars are skewed toward the normal subtype as strong Balmer lines are often one of the search criteria.
Because field He-sdB stars can be found at shorter distances than the hot EHB stars in globular clusters, we can more easily obtain high-resolution spectra at high signal-to-noise, appropriate for detailed spectroscopic studies. In this paper we report on the quantitative analysis of the three field He-sdB stars PG1544+488, JL87 and LB1766, using ultraviolet spectra obtained with the Far-Ultraviolet Spectroscopic Explorer (FUSE). Our purpose in selecting these three He-sdB stars was to test the flash-mixing scenario as a new evolutionary channel for producing the hottest HB stars. The far-ultraviolet spectral range is a very rich spectral region, presenting unique opportunities for deriving the surface abundances of hot stars. It is particularly well-suited for confirming the strong enhancement of helium and carbon with respect to other species. Sect. 2 describes the selected stellar sample and the FUSE observations. Our non-LTE (NLTE) line-blanketed model atmospheres are briefly discussed in Sect. 3, while the results of the analysis are presented in Sect. 4. We report on new evolutionary calculations for solar composition stars in Sect. 5, and show that flash mixing can be either deep or shallow, depending on how much of the core is mixed with the hydrogen envelope. We discuss our results and their implication for the formation and evolution of hot HB stars in Sect. 6.
2 FUSE Observations
2.1 Stellar Sample
The observing program was set up from a list of about 50 He-rich sdB stars catalogued by Jeffery et al. (1996). We have selected three relatively bright objects, with an expected low interstellar extinction, in order to obtain good S/N ratio spectra with FUSE that are little contaminated by interstellar H2 absorption.
We have selected the class prototype, PG1544+488, as our primary target. A preliminary analysis that was performed by Heber et al. (1988), and reported in Harrison & Jeffery (1997), indicates that PG1544+488 has an hydrogen-deficient and helium-rich atmosphere with a significant enhancement of carbon (a mass fraction of 1%).
Our second target is JL87 (=EC 21435-7634), with a blue spectrum revealing strong He I lines, Balmer lines (contrary to PG1544+488), and a strong C II 4267 line (Schulz et al., 1991). A coarse analysis by Schulz et al. (1991) found a hydrogen abundance and a helium abundance , indicating a surface enrichment in helium. A fine analysis, in particular of the carbon line, was deferred until better observations become available. Kilkenny et al. (1995) obtained photometry of JL87, showing mild interstellar extinction, mag. Magee et al. (1998) measured an apparent rotational velocity, km/s, from two optical He I lines. JL87 was not part of our original target list proposed for FUSE Cycle 3 observations. However, due to reaction wheel failures in late 2001, it became difficult to observe targets at low declination. Consequently we replaced one of our original targets, PG1127+019, which lies at a declination of nearly 0o, with JL87, at .
Our last program star is LB1766. Low-dispersion Reticon spectra were obtained by Kilkenny & Busse (1992) and show no evidence for hydrogen. Contrary to the other two stars, these spectra do not suggest strong carbon enhancement.
Stark & Wade (2003) have recently revisited the question of binarity among hot subdwarfs. They have used 2MASS colors from a large sample of spectroscopically selected sdB and sdO stars to look for composite colors indicating the presence of late type companions. The three selected stars have 2MASS colors, , that exclude the presence of unresolved cool companions which might contribute to the flux in the FUSE spectral range. We cannot rule out the presence of cooler M-type companions, but any such companions would not affect the stellar parameters that we derive from the analysis of the FUSE spectra.
2.2 Far-Ultraviolet Observations
The three program stars were observed during the prime mission of FUSE between March 2002 and January 2003, as part of Cycle 3 General Observer Program C129. Table 1 provides a log of the observations. PG1544+488 and JL87 were observed in time-tag mode, while LB1766 was observed in histogram mode. Time-tag mode records the position and time of each photon event on the detector, while histogram mode simply provides the final integrated exposure on the detector; although the default mode is time-tag, histogram mode is employed on brighter targets with high count rates. All targets were observed through the large aperture. The observation of PG1544+488 was repeated because the side 2 detector was turned off during the first observation, thus limiting the signal-to-noise ratio and wavelength coverage.
2.3 Data Reduction
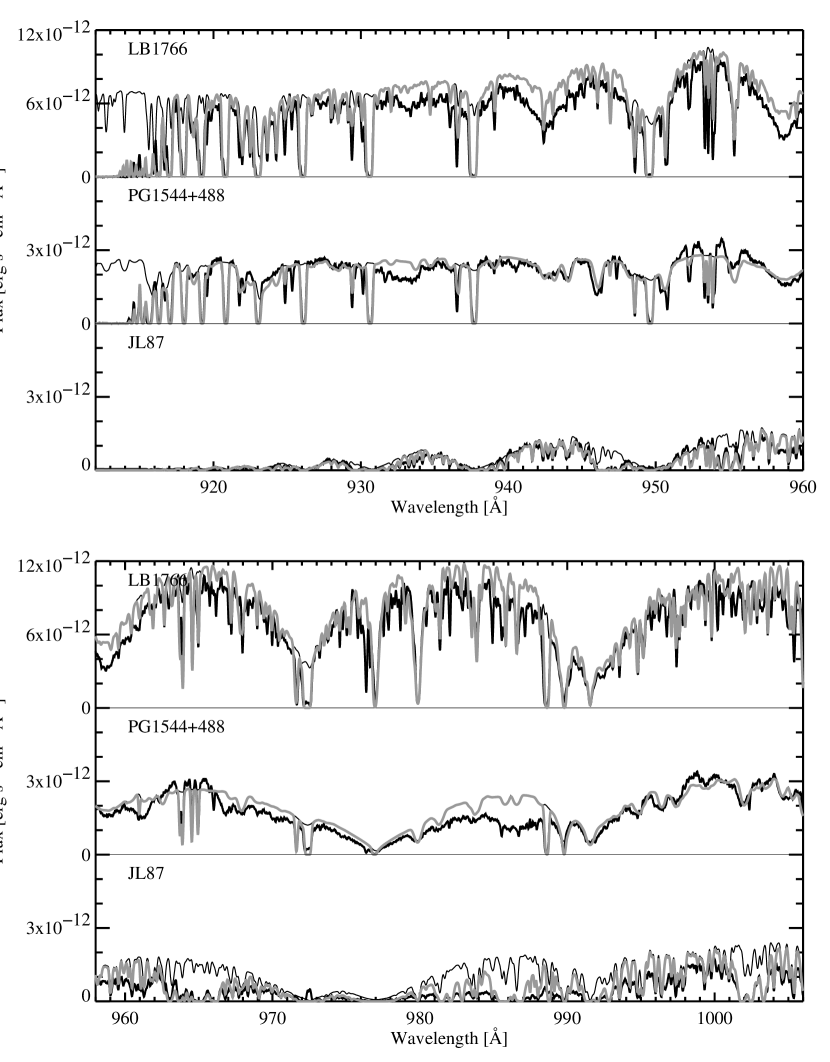
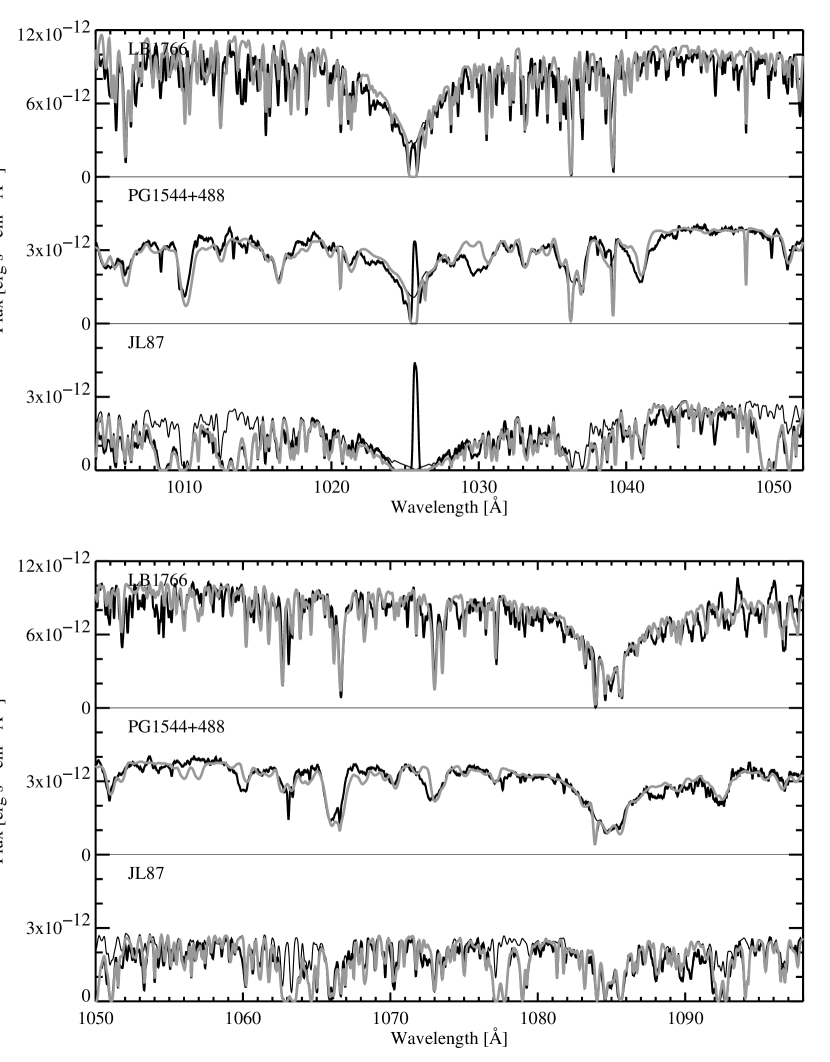
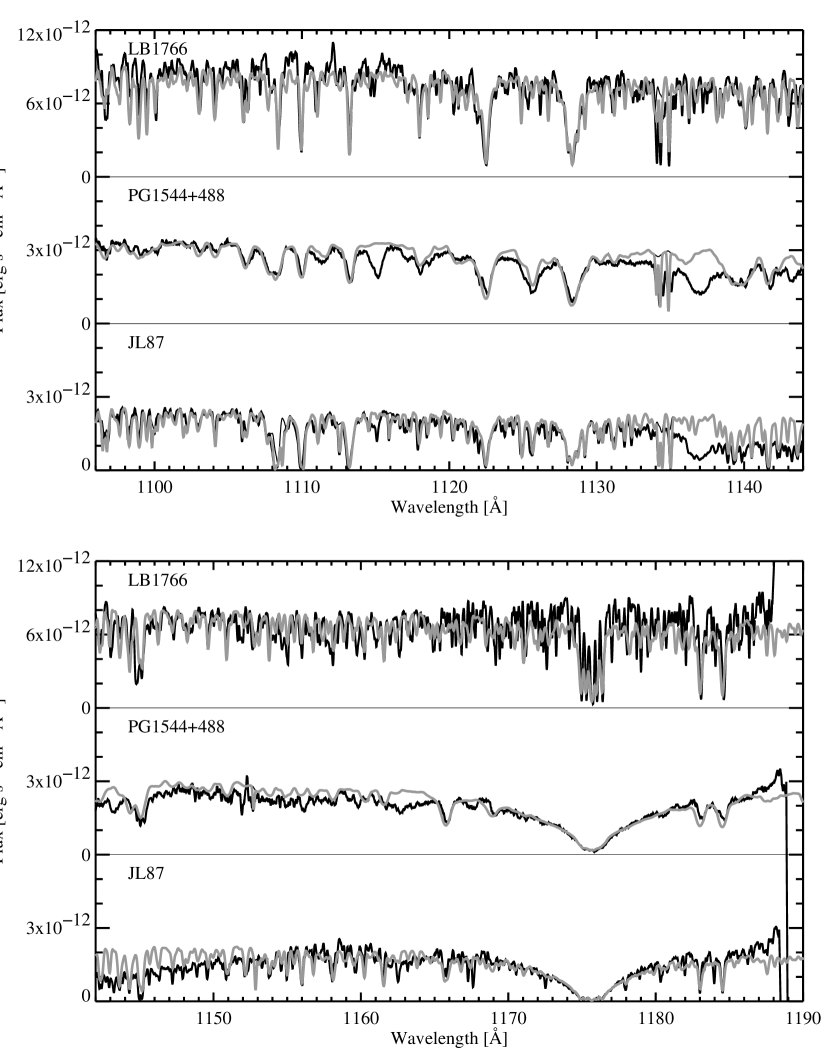
The data were processed with CALFUSE, with slightly different versions, due to the delay between individual observations and their analysis. PG1544+488 and JL87 were observed early in the program, and processed with version 2.1.6; LB1766 was observed much later, and processed with CALFUSE version 2.2.2. For each target, we combined the data from different detector segments and channels to create a single spectrum, using the IDL fuse_register code, which was written by D. Lindler and provided by the FUSE project on their web site111http://fuse.pha.jhu.edu. This code allows the user to interactively combine data from separate observations, detector segments, and channels. Cross-correlation is used to align the individual spectra, and then a comparison of overlapping wavelength regions allows the user to find detector artifacts, which can then be masked before the spectra are combined. The resulting spectra are shown in Fig. 1.
3 NLTE Model Atmospheres
We have analyzed the FUSE spectra with NLTE line-blanketed model atmospheres calculated with our model atmosphere program, Tlusty, version 200222Available at http://tlusty.gsfc.nasa.gov. Tlusty computes stellar model photospheres in a plane-parallel geometry, assuming radiative and hydrostatic equilibria. Departures from LTE are explicitly allowed for a large set of chemical species and arbitrarily complex model atoms, using our hybrid Complete Linearization/Accelerated Lambda Iteration method (Hubeny & Lanz, 1995).
Lanz & Hubeny (2003) have recently completed a large grid of hot model stellar atmospheres, spanning a range of metallicities, from twice the solar metallicity to extremely metal-poor models. Scaled-solar values of metal abundances were assumed, with the same scale factor for all species heavier than helium, while the helium abundance was kept at the solar value. However, the FUSE spectra readily show that the three program stars have a non-solar composition, with an abundance pattern that notably differs from scaled-solar values. Therefore, we have calculated several series of NLTE model atmospheres with increasing sophistication, namely including in subsequent steps additional explicit NLTE species. We have computed limited grids of H-He-C, and H-He-C-N-Si models, with effective temperatures between 25 000 and 45 000 K, , and various helium to hydrogen abundance ratios. Model atmospheres with different carbon and nitrogen abundances have been considered. In the final step, we have calculated fully-blanketed model atmospheres, including 40 NLTE ions. All model atmospheres have been calculated with model atoms described in detail by Lanz & Hubeny (2003). We have only updated the C III model atom to incorporate all individual levels provided by the Opacity Project (OP, 1995; Tully et al., 1990). The lowest 34 individual levels are considered explicitly, and all higher levels are grouped into 12 superlevels. Nickel is not considered as an explicit NLTE species since we found that it has a negligible effect on the model atmospheres. The final model atmospheres include 765 NLTE levels and superlevels.
4 Spectrum Analysis
4.1 Methodology
The first series of H-He-C NLTE model atmospheres is used to roughly fix the main stellar parameters: effective temperature, surface gravity, helium to hydrogen abundance ratio, and carbon abundance. At this stage, we have adopted the carbon ionization balance as the primary indicator. There are numerous lines of C II and C III, and a few C IV lines in the spectral range covered by FUSE. The dominant ionization stage is C III. We can therefore derive carbon abundances from C III lines, while C II and C IV lines are quite sensitive to . The He II line wings are sensitive both to and . Surface gravity is determined from the He II lines, with moderate accuracy (0.3 dex). Hydrogen Lyman lines are not detected in two of the three stars, imposing tight upper limits on the hydrogen abundance. For all models, we have arbitrarily assumed a microturbulent velocity, km s-1.
Assuming the atmospheric structure from the H-He-C NLTE models calculated with Tlusty, we have then computed detailed synthetic spectra with our spectrum synthesis code, Synspec. Hydrogen, helium, and carbon lines are calculated with NLTE populations, while LTE is assumed for the lines of all other species. This step provides an estimate of the abundances of other elements, and an additional check of the effective temperature using the nitrogen and silicon ionization balances. We found that Si III 1108-10-13 and Si IV 1122-28 are particularly useful indicators. Although the high surface gravity of the program stars ensure that LTE is a reasonable approximation for minor species, we have calculated additional NLTE models including nitrogen and silicon as explicit NLTE species. Because a major NLTE effect consists in shifting ionization balances toward higher ionization relative to the LTE values, it is essential to account for such possible shifts when using ionization balances as temperature indicators.
The method that we followed provides a quick path to derive stellar parameters and surface abundances of program stars with abundance patterns that are very different to scaled-solar abundances. Fully line-blanketed NLTE model atmospheres are calculated in a final step. The final fits are presented in the following sections. The theoretical spectra are scaled to the FUSE spectra to match the observed flux levels around 1050 to 1100 Å. The derived normalization factor is then applied to the theoretical spectrum throughout the spectral range, without any adjustment. The agreement between the theoretical and observed spectra confirms that the three stars suffer from little differential interstellar extinction across the FUSE bandpass.
A number of strong interstellar lines are present in the FUSE spectral range, and are seen in our data. In some situations it is important to include these lines in the analysis in order to achieve a good match to the data, for example in case of strong blends of photospheric and interstellar lines. We have derived interstellar column densities towards the three stars for a number of ions. However, we have made no attempt at deriving consistent excitation/ionization models to determine properties of these interstellar lines of sight. The interstellar lines are modeled with Voigt profiles. In addition to atomic lines, we have also accounted for the Lyman and Werner band systems of molecular hydrogen. The necessary H2 data have been extracted from Kurucz (1993). We have determined the H2 column density by fitting lines from the ground state. Excitation temperatures are empirically determined to match H2 lines from excited levels.
To achieve a fit to the data, the following four additional steps need to be applied to the Synspec-generated spectra: (i) rotational convolution; (ii) interstellar atomic and molecular line absorption; (iii) instrumental convolution; and (iv) flux normalization.
4.2 PG1544+488
The FUSE spectrum of the archetype He-sdB star, PG1544+488, reveals striking features, most notably very strong C III 977, 1176 lines, and the absence of photospheric hydrogen Lyman lines (only narrow interstellar Lyman lines are present). The spectrum looks thus quite abnormal around Ly and C III 977.
Therefore, we have started the analysis of PG1544+488 assuming an atmosphere almost devoid of hydrogen, adopting a low hydrogen mass fraction, (Heber et al., 1988). We have constructed a small grid of H-He-C model atmospheres, spanning a range of effective temperatures between 30 000 and 40 000 K, surface gravity (), and carbon abundance (mass fraction from 1% to 5%). The best match was obtained for = 36 000 K, , and a carbon mass fraction of 2%. Most carbon lines are saturated; however, carbon mass fractions as low as 1% or as high as 3% can be excluded by our analysis. C II lines (e.g., 1092) tend to favor a lower effective temperature (34 kK), while C II 1010, 1066, are best fitted with a higher temperature (38 kK) model. The C IV lines (1107, 1169) favor K.
As outlined in the previous section, we have added N and Si as explicit NLTE species in the next step, and included all other species in LTE. The nitrogen and silicon ionization balances support the effective temperature derived from carbon lines. P IV and P V resonance lines are also well matched, providing further support to the adopted effective temperature, = 36 000 K. We estimate the uncertainty on to be 2 000 K. The FUSE data and our analysis cannot be reconciled with the lower effective temperature (31 kK) derived by Heber et al. (1988). The effective temperature derived by Ahmad & Jeffery (2003), 34 000300 K, agrees better, although the quoted uncertainty seems significantly too low.
He II 1085 line wings are best matched assuming a surface gravity . We have used the approximate, but sufficiently accurate, formalism of Hubeny et al. (1994) to model the line profiles of the higher members of the Balmer series of He II. This approach provides a smooth transition between a Doppler core and a quasistatic Holtzmark wing. Although the FUSE spectral range does not show features that are very sensitive to gravity, we may exclude surface gravities lower than or higher than . The derived gravity may be checked for consistency against predictions from stellar structure models. Hot HB stars have indeed well defined masses, , and a limited range in luminosities, . Adopting = 360002000 K and , we derive a luminosity for PG1544+488, . We cannot reconcile our result with the much lower gravity derived by Heber et al. (1988) and Ahmad & Jeffery (2003), . Ahmad & Jeffery (2003) derived systematically low gravities () for all He-rich sdB stars. Since different scenarios of the origin of He-rich sdB stars would be implied by these different values of the surface gravity, we need to understand the reason behind this discrepancy. We will address this question in Sect. 6.
Besides helium and carbon, nitrogen is also significantly enhanced. We have derived a nitrogen mass fraction of 1%. Silicon and sulfur lines may have slightly subsolar surface abundances, while P IV and P V resonance lines yield a phosphorus surface enrichment by about a factor 3 compared to the solar phosphorus abundance. The Si-P-S abundance pattern may be an indication that radiative levitation and gravitational settling may be affecting the surface composition, though the evidence is not strong. The numerous weak Fe lines are well matched assuming a solar metallicity. Finally, we can set an upper limit to the hydrogen photospheric mass fraction, , from the absence of Lyman line wings. This limit is consistent with the hydrogen mass fraction derived from optical spectroscopy by Heber et al. (1988).
Our results are summarized in Table 2. Fig. 1 shows the FUSE spectra and best model fit for the three program stars. Generally, the agreement between the observed and model spectra of PG1544+488 is excellent. Two problems may nevertheless be noted. The C III 977 line wings are too weak in the model spectrum. The Stark broadening parameter would need to be increased considerably in order to match the observations. Additionally, there are several broad observed features that are absent in the model. An instrumental origin does not seem plausible, because the same features appear in spectra from independent detector segments that overlap in wavelength coverage at each given feature. These broad features are probably of photospheric origin, but we have been unable to secure an identification. We note that most of them are also present in JL87 (e.g., 1030, 1060, 1115, 1137), albeit weaker. A broad absorption at 987-88 may be modeled by several H2 lines in JL87, but there are no other indications of molecular hydrogen absorption in PG1544+488 spectrum.
4.3 JL87
The most striking difference between the PG1544+488 and JL87 spectra is the presence of broad hydrogen Lyman lines in the latter, which are most obvious near the series limit at wavelengths shorter than 950 Å (see Fig. 1). The presence of a significant amount of hydrogen in the photosphere of JL87 is not surprising in view of the detection of hydrogen Balmer lines reported by Schulz et al. (1991).
From Strömgren photometry and Balmer lines, Schulz et al. (1991) derived JL87 stellar parameters, = 280001000 K, and . Our analysis of the FUSE spectrum provides consistent values, = 290002000 K, and . An effective temperature lower than 30000 K is favored by the strength of Si III 1108-10-13 and Fe III 1088. Model spectra calculated with the two sets of parameters are very similar, and we cannot really favor one or the other. We have adopted the higher values (29 kK; 5.5) which yield a luminosity, , in better agreement with stellar structure models of hot HB stars.
Optical He I lines indicate a moderate surface enrichment of helium, He/H = 0.200.05, by number (Schulz et al., 1991). The FUSE spectroscopy is consistent with this, but we cannot discriminate between the solar abundance (He/H = 0.1) and the Schulz et al. value. We find a significant surface enrichment of carbon and nitrogen (both by a factor 5), corresponding to mass fractions of 1.4% and 0.4%, respectively. From silicon and iron lines, we find that a solar metallicity results in a good fit to JL87 spectrum.
Moderately strong absorption by interstellar molecular hydrogen is apparent in JL87. A good match of the best model spectrum to the FUSE data requires accounting for H2. We have identified all resonance lines (ground vibrational level, ground rotational level ), most lines from the first rotational level (), and some lines originating from levels. To match the H2 absorption line spectrum, we have adopted a H2 column density of cm-2, and empirical excitation temperatures of 70 K, 90 K, 130 K, and 150 K, for levels, respectively.
4.4 LB1766
LB1766 has been classified as a He-sdB star from low resolution optical spectroscopy (Kilkenny & Busse, 1992), with no evidence for hydrogen Balmer lines at this resolution. However, their spectrum shows He II 4686 at about equal strength as He I 4713, suggesting higher temperatures than a typical He-sdB star. In the classifications scheme of Jeffery et al. (1997) the star would be classified as sdO8:He4. Our FUSE spectrum shows no evidence for Lyman lines, consistent with the absence of hydrogen in the optical spectrum. The LB1766 spectrum, however, presents strong contrasts to the PG1544+488 spectrum, e.g., the strong He II 972 and weak C III 977 in LB1766 (see Fig. 1). LB1766 has a very sharp-lined spectrum, yielding an upper limit for its apparent rotation, km/s. Similarly to PG1544+488, we do not find absorption from interstellar H2.
LB1766 has not been previously analyzed quantitatively. We have determined the effective temperature from the carbon, N III/N IV, and Si III/Si IV ionization balances. They yield consistent values, and we have adopted, = 400002000 K. The surface gravity was derived from He II line wings, and we find that values in the range between 6.0 and 6.5 result in good fits. We have adopted . We note that He II 943, 959 are badly reproduced by the adopted model atmosphere. These two lines are much stronger in LB1766 than in PG1544+488 (despite similar stellar parameters), and they are well fitted in the latter case. From the absence of hydrogen Lyman lines, we derive an upper limit for the hydrogen abundance, , similar to the case of PG1544+488.
CNO surface abundances depart markedly from the two other stars. Nitrogen is clearly overabundant (a factor 7 from solar), while carbon is very deficient (1/30 of the solar abundance). O III lines are clearly identified (1008, 1040, 1138, 1150-51-54, etc) and show a moderate oxygen deficiency. The observed CNO abundance pattern is a signature of material processed through the CNO-cycle (N/C1 and N/O1). Since the CNO-cycle conserves the total number of CNO nuclei, we would expect the original CNO abundance in LB1766 to be by mass, which is consistent with a metallicity near solar.
5 Deep and Shallow Flash Mixing
In Paper I we explored the different evolutionary tracks which low-mass stars can follow as they evolve through the helium flash and showed that under some circumstances the helium flash will induce substantial mixing between the helium core and hydrogen envelope. As outlined in Sect. 1, our evolutionary sequences with flash mixing were able to account for a number of anomalies among the hot HB population in the globular cluster NGC 2808, including the gap within the EHB and the existence of subluminous EHB stars. These results raise the possibility that flash mixing might also be responsible for the formation of the field He-sdB stars. In this section we will present new evolutionary calculations to test this possibility. Our goal is to determine if flash-mixed models can reproduce the surface abundances and stellar parameters derived in Sect. 4 for our three He-sdB stars.
The evolutionary sequences in Paper I were computed for a metal-poor composition appropriate for the stars in NGC 2808. Since the field He-sdB stars are more metal-rich, we have computed a new set of evolutionary sequences for a solar composition to ensure a more consistent comparison with the FUSE data analysis. Each of these sequences was evolved continuously from the main sequence through the helium flash to the zero-age horizontal branch (ZAHB). The initial main-sequence mass was in all cases. These sequences only differed in the extent of mass loss along the RGB which we specified by varying the mass-loss parameter in the Reimers (1975, 1977) formulation from 0 to 1.3. We emphasize that the Reimers formulation merely provides a numerically convenient way to vary the amount of mass loss. Whether the actual mass loss follows a different formulation during single-star evolution or whether it arises from binary-star interaction is not important for the present discussion. The important quantity is the total amount of mass loss on the RGB, not the process by which the mass is removed.
The different evolutionary tracks followed by our solar metallicity models during the helium flash are illustrated in Fig. 2. Normally a low-mass star will ignite helium in its core at the tip of the RGB and then evolve over yr through the helium flash to the ZAHB (Fig. 2a). The location of a star on the ZAHB depends on its envelope mass, but as long as the envelope mass is greater than , corresponding to a ZAHB temperature of K, the star will be tightly bound to the RGB at the time of helium ignition. At higher mass-loss rates a star will peel off the RGB and evolve to high effective temperatures before igniting helium, leading to the so-called “hot flashers” (Castellani & Castellani, 1993; D’Cruz et al., 1996, Paper I). It is helpful to distinguish between two types of hot flashers: “early” hot flashers, which ignite helium between the tip of the RGB and the top of the WD cooling curve (Fig. 2b) and “late” hot flashers, which ignite helium while descending the WD cooling curve (Figs. 2c,d). At even higher mass-loss rates a star will leave the RGB and evolve down the WD cooling curve without ever igniting helium, thus dying as a helium white dwarf.
The high helium-burning luminosity during the helium flash () produces a temporary convection zone that extends from the site of the helium flash outward through the core to just inside the base of the hydrogen envelope (see Fig. 3). Due to the efficient neutrino cooling of the central regions of the core, the maximum temperature within the core, and therefore the site of the helium flash, lie off-center. Following the flash peak this convection zone retreats and disappears, although a small convective shell persists in the outer part of the core for a few thousand years. The carbon abundance within the flash convection zone ( by mass) is determined by the amount of helium that a star must burn in order to lift the degenerate core out of its deep potential well. In stars which ignite helium either at the tip of the RGB or as early hot flashers, the flash convection zone does not penetrate into the hydrogen envelope due to the high entropy barrier of the hydrogen-burning shell (Iben, 1976). In both cases the hydrogen-burning shell is a strong energy source () at the onset of the helium flash. Since the surface composition of such stars is not altered by the helium flash, we will refer to their evolution as “canonical”, as distinguished from the “noncanonical” evolution of stars which undergo flash mixing.
When a star descends the WD cooling curve, the energy output of its hydrogen shell, and consequently the entropy barrier of the shell, decrease. As a result, the flash convection zone is then able to penetrate deeply into the hydrogen envelope (Sweigart, 1997, Paper I). Hydrogen captured by the flash convection zone will be mixed into the core while helium and carbon from the core will be mixed outward into the envelope, leading to substantial changes in the surface composition. This flash mixing is a consequence of the basic properties of the stellar models and should occur whenever a star ignites helium on the WD cooling curve as a late hot flasher (Figs. 2c,d). Our calculations have revealed two types of flash mixing: “deep” and “shallow”, depending on where the flash occurs along the WD cooling curve. We will discuss these two types of mixing separately, since they have different consequences for the surface composition of an EHB star.
Deep mixing occurs when the flash convection zone reaches the hydrogen envelope shortly after the peak of the flash at the time when the core is fully convective outside the flash site. In this case, hydrogen from the envelope will be carried inward towards the hot helium-burning regions of the core and, along the way, will begin to react with the abundant nuclei produced by the helium burning. The peak in the hydrogen burning will occur around the layer in the flash convection zone where the timescale for proton-capture on is comparable to the timescale for convective mixing. Thus in the case of deep mixing any hydrogen captured by the flash convection zone will be burned.
A detailed investigation of the abundance changes produced by deep mixing poses a major numerical challenge because it requires one to solve for both the nucleosynthesis and the time-dependent mixing within the flash convection zone simultaneously. In the first study of flash mixing, Sweigart (1997) was able to evolve one sequence through the deep mixing phase by ignoring the energy released by the hydrogen burning. This assumption is clearly a rough approximation, since, as shown in Paper I, the hydrogen burning within the flash convection zone will release a substantial amount of energy, as much as 20% of the total energy produced during the helium flash. This additional energy source would be expected to drive the flash convection zone even further into the hydrogen envelope. Thus the models of Sweigart (1997) should, if anything, underestimate the extent of the surface composition changes during deep mixing. Even so, the flash convection zone in these models captured 90% of the envelope hydrogen, resulting in a final surface composition of 81% helium and 3% carbon by mass.
Due to the numerical difficulties in following the composition changes during deep mixing, Brown et al. (2001) stopped their evolutionary calculations at the onset of mixing and then restarted them at the ZAHB phase by assuming an envelope composition of 96% helium and 4% carbon by mass. The abundances of the remaining heavy elements were unchanged from their values for the adopted metallicity of NGC 2808 (heavy-element abundance ). Brown et al. (2001) argued that the envelope composition following deep mixing should reflect the composition of the flash convection zone. We have adopted the same approach in the present study. The track for the late hot flasher plotted in Fig. 2d was stopped at the onset of deep mixing. We then jumped over the flash-mixing phase (dashed line in Fig. 2d) and constructed a ZAHB model with an envelope composition of 95% helium and 4% carbon, with the remaining 1% of the envelope consisting of elements heavier than carbon from the original solar composition.
Recently, Cassisi et al. (2003) have overcome the numerical difficulties posed by deep mixing and have followed the detailed composition changes during this phase. Their calculations confirm the flash-mixing scenario advocated by Sweigart (1997) and Brown et al. (2001). In particular, they predict a surface composition after deep mixing of 96% helium, 2.9% carbon and 0.7% nitrogen by mass, in good agreement with the surface composition assumed here. The enhanced nitrogen abundance comes from the burning of hydrogen on carbon within the flash convection zone. A tiny fraction of the hydrogen is also expected to remain in the envelope (0.04% by mass) after deep mixing and might be spectroscopically detectable if hydrogen diffuses towards the surface. We conclude that the surface composition produced by deep mixing seems well determined. Moreover, it closely resembles the surface composition of PG1544+488.
In models with deep mixing the full flash convection zone penetrates into the envelope, and the envelope hydrogen is then mixed deeply into the core and burned. Such mixing was found during helium flashes that began on the WD cooling curve at luminosities below . In flashes that began further up the WD cooling curve, such as the one in Fig. 2c, only the convective shell that exists in the outer part of the core once the main body of the flash convection zone recedes (see Fig. 3) is able to penetrate into the envelope. An example of this type of mixing, taken from the sequence in Fig. 2c, is shown in Fig. 4. Unlike the canonical case in Fig. 3, the convective shell in Fig. 4 moves progressively outward in mass until at time t = yr after the peak of the flash it makes contact with the hydrogen envelope. The convective shell continues to move deeper into the envelope, and at t = yr it joins up with a thin convective envelope that develops because of the low effective temperatures of the models during this phase (see Fig. 2c). At this point helium and carbon from the core are mixed outward to the surface. We shall refer to this type of flash mixing in which the envelope is mixed only with the outer convective shell as “shallow” mixing.
Shallow mixing differs in one important respect from deep mixing. Because the temperatures in the outer part of the core are very low due to the large expansion of the core during the helium flash, none of the envelope hydrogen captured by the convective shell will be burned. Thus a star undergoing shallow mixing will conserve its original hydrogen although this hydrogen will be diluted with helium- and carbon-rich material from the core. For the sequence in Fig. 2c the final surface composition after shallow mixing was 50% helium, 0.8% carbon and 0.5% nitrogen. The nitrogen abundance is enhanced because the core material has been processed through the CNO-cycle during the earlier RGB phase. Because there is no hydrogen burning during shallow mixing, we were able to evolve our models through this phase without any of the numerical difficulties encountered during deep mixing. The final surface composition of the model in Fig. 2c is similar to the surface composition of JL87, especially if one allows for a modest enhancement in the surface hydrogen by diffusion during the HB phase.
Shallow mixing was not found in the low-metallicity sequences reported in Paper I. Closer inspection of those sequences showed that shallow mixing was possible, but only over a much smaller range in the mass-loss parameter . Although the increment in used for the sequences in Paper I was very small ( = 0.001), it was still too large to detect shallow mixing. The present calculations therefore suggest that shallow mixing is more likely to occur in metal-rich stars.
We conclude that deep and shallow flash mixing will produce surface compositions very similar to those found for PG1544+488 and JL87. In particular, the robust prediction for the C + N abundance in the flash-mixed models is nicely confirmed by the abundances in these two stars. Flash mixing cannot, however, explain the very low carbon abundance of LB1766, which must have formed through a different evolutionary channel.
6 Discussion and Conclusions
Our results for the three He-sdB stars are summarized in Table 2 and compared with EHB evolutionary tracks for canonical, shallow and deep mixing models in Fig. 5. All three stars have an atmosphere rich in helium, as expected from their He-rich sdB classification, and all show supersolar nitrogen abundances. The surface abundance patterns of the three stars, however, differ notably, and thus offer a crucial insight into their evolutionary history. In this section we shall address several points in order to establish a convincing scenario of the origin of He-sdB stars. First, we argue that the surface abundances cannot be explained by atmospheric processes during the EHB phase, but rather trace the nucleosynthetic history of these stars. Second, we address the reason behind the discrepancy in the derived surface gravities of the carbon-rich He-sdB stars and show that the gravities of these stars are indeed high in accord with flash-mixing evolutionary tracks. Finally, we discuss the different abundance patterns and rotational velocities of the three stars.
A large variety of surface abundances is typical of “normal” H-rich sdB stars, and it is interpreted as an interplay between diffusion and mass loss. Can we also explain our results on He-sdB stars in this atmospheric framework? Unglaub & Bues (2001) have investigated the effect of weak winds on the atmosphere of EHB stars. On timescales short compared to HB lifetimes ( years), helium settles down and the atmosphere becomes very deficient in helium if the wind is very tenuous ( M⊙ yr-1). Similarly, carbon, nitrogen, and oxygen are also depleted, although less so, because their higher electrical charge hampers diffusion. At high mass loss rates ( M⊙ yr-1), the atmospheric chemical composition remains almost unchanged, and reflects the envelope composition. The helium deficiencies typically observed in sdB stars might be explained by weak winds with M⊙ yr-1. CNO anomalies, including selective nitrogen enrichment, may appear for special combinations of mass loss rates and age. Unglaub & Bues (2001) have also considered the case of helium-rich atmospheres. They can predict such a He-rich composition only if a tiny H-rich envelope ( M⊙) is removed by a strong wind ( M⊙ yr-1) during the HB phase. At the end of the HB phase, a He-rich atmosphere will then appear, with CNO abundances reflecting the composition of the layers just inside the base of the hydrogen shell. Stellar structure calculations indicate that the H-rich envelope is very likely much larger than assumed by Unglaub & Bues (2001), thus requiring a mass loss rate larger than M⊙ yr-1 to remove the hydrogen envelope completely. Moreover, mass loss and diffusion do not explain the large surface carbon abundance. We therefore conclude that the surface abundances measured in these three He-sdB stars cannot be explained by atmospheric processes, and are thus evidence of nucleosynthetic processes.
We turn now to the different values of the surface gravity derived for PG1544+488. In the previous studies (Heber et al., 1988; Ahmad & Jeffery, 2003), the optical spectrum was analyzed with LTE H-He model atmospheres, while we have used “full” NLTE model atmospheres including 40 NLTE ions in our analysis of the FUSE spectrum. We have investigated the result of using different model atmospheres in the analysis. As a reference, we adopt the full NLTE model (=36 000 K, , 2% C, 1% N). We have then calculated H-He LTE and NLTE models and H-He-C NLTE models assuming the same effective temperature, but different surface gravities (). We have compared the atmospheric structures and predicted spectra. The H-He model atmospheres have a much steeper temperature gradient than our reference NLTE model atmosphere, while the NLTE H-He-C models have a temperature structure that is very similar to our reference model. Fig. 6 illustrates that H-He model atmospheres require lower surface gravity () in order to match the gravity-sensitive wings of the strong optical He I lines predicted by the reference NLTE model (). With H-He model atmospheres, we have been unable to reproduce the optical He II lines: the strength of He II is only matched with low gravities (), while the Pickering series is always predicted to be too strong (especially at low gravities). Finally, the shape of the far-UV continuum is different, with the flux maximum moving from about 980 Å (H-He models) to 1050 Å in the reference model. Our adopted model atmospheres fit well the far-UV continuum (see Fig. 1). Therefore, we conclude that the low surface gravities derived by Ahmad & Jeffery (2003) are primarily a spurious result of neglecting carbon (and nitrogen) in the atmospheric structure calculations, that is, of using H-He model atmospheres. This systematic effect leads to an underestimate of by at least 0.5 dex for carbon-rich He-sdB. Departures from LTE are only significant in the core of the strong optical He I lines, but we could not assess the resulting effect on the minimization procedure used by Ahmad & Jeffery (2003) to derive the stellar parameters.
Our results on PG1544+488, the archetype of He-rich sdB stars, fully support the flash-mixing scenario. Its surface composition (H, He, C, and N) matches the model predictions for deep mixing (Brown et al., 2001; Cassisi et al., 2003), and its high effective temperature and surface gravity coincide nicely with the EHB evolutionary tracks with deep mixing in Fig. 5. JL87 also shows an enhancement of carbon and nitrogen that is similar to PG1544+488, but its atmosphere still contains a significant amount of hydrogen. This surface abundance pattern supports our predictions for shallow flash mixing. Further making our case is the cooler effective temperature of JL87 near the hot end of the canonical ZAHB, just as predicted by the evolutionary tracks with shallow mixing.
A competing theory to explain the origin of hydrogen-deficient evolved stars (R CrB stars, extreme helium stars) is the merger of two helium white dwarfs. Saio & Jeffery (2002) have recently explored the merger of a 0.6 CO white dwarf with a 0.3 He white dwarf in order to explain hydrogen-deficient, carbon-rich stars. They are able to reproduce the surface abundance pattern observed in stars like PG1544+488. However, their model requires fine-tuning in terms of the total mass accreted by the CO white dwarf and in terms of the mixing needed to bring the observed amounts of carbon and oxygen to the stellar surface. On the other hand, the flash-mixing model naturally predicts the observed abundances. The predicted luminosity is however the crucial difference between the two models: the WD merger scenario implies a post-merger luminosity that is at least ten times higher than the luminosity predicted by the flash-mixing model. We have argued above that carbon-rich sdB stars have high gravities, hence low luminosities, in accord with the flash-mixing model. A direct measurement of the luminosity of He-sdB stars will provide the decisive test for ruling out one of these two scenarios.
Finally, LB1766 shows a quite different abundance pattern, indicative of CN-cycle processing and possibly some limited ON-cycle processing. While CN-cycle processing might take place within the H-rich envelope of a star on the RGB, it would not produce the very high helium abundance we see today in LB1766. Thus the unanswered question in the case of LB1766 is: What happened to its hydrogen? We may envisage two possible scenarios: (i) the hydrogen was burnt; (ii) the H-rich envelope was lost. The first possibility seems unlikely. If the hydrogen was burned via the full CNO-cycle, then the oxygen abundance in LB1766 should be very small, much less than observed. To be consistent with the observed oxygen abundance, one would have to argue that the hydrogen was burned at low temperatures where only the CN-cycle can operate. However, it is difficult to think of an evolutionary phase prior to the EHB where this might be possible. For example, the ON-cycle operates quite efficiently at the high temperatures within the hydrogen-burning shell of a red giant star. As discussed in Sect. 5, the hydrogen could be burned during a flash-mixing episode, but then we should see a high carbon abundance in LB1766, which is not the case. The loss of the H-rich envelope during the EHB phase seems equally unlikely. Stellar structure models predict a minimum envelope mass around M⊙ at the hot end of the canonical EHB (D’Cruz et al., 1996; Brown et al., 2001). To lose all of this envelope during the EHB phase would require a large and unlikely mass-loss rate ( M⊙ yr-1). Even if all of the hydrogen envelope were removed and the outer layers of the core exposed, one would still not be able to explain the surface abundances of LB1766. These layers were previously processed through the full CNO-cycle during the RGB phase and would therefore have a very small oxygen abundance. This is also a problem if the hydrogen envelope was removed by binary mass transfer on the RGB. If even more material were removed from the core, one would eventually expose layers which were enriched in carbon by the flash convection zone during the helium flash. The derived surface abundance pattern in LB1766, i.e., hydrogen deficiency and CNO yields from the CN-cycle, therefore poses a challenge to current stellar evolutionary models. It would be worthwhile to repeat diffusion+wind calculations following Unglaub & Bues (2001), assuming a starting composition given by the flash-mixing scenario, in order to evaluate the downward diffusion of carbon.
One unexpected result is the large rotational velocities found for the carbon-rich stars PG1544+488 ( = 100 km/s) and JL87 ( = 30 km/s). These values are larger than those typically found for normal sdB stars. Edelmann et al. (2001) estimated km/s for 13 sdB stars observed at high signal-to-noise ratio with the FOCES spectrograph, while Heber et al. (2000) found similar limits for 3 sdB stars observed with the Keck HIRES spectrograph. The origin of this high rotation rate is not certain. If HB stars have a rapidly rotating core, as suggested by Sills & Pinsonneault (2000), then one possibility is that the flash mixing has brought angular momentum from the core to the surface. Alternatively, the high rotation rate may reflect the binary origin of these system, although in the simplest scenario, where a RGB star loses mass to a companion, one expects the angular momentum of the donor to decrease. We note that the high rotation may suppress the gravitational settling which likely leads to subsolar helium abundances in normal sdB stars. It would therefore be of interest to learn if fast rotation is a characteristic shared by all C-rich sdB stars. Finally, we note that while the specific angular momentum in PG1544+488 is high compared to other field sdB stars, it is several times smaller than in the fastest rotating blue HB stars observed in globular clusters by Behr (2003), which have km/s, = 9000 K, and .
In conclusion, the observed surface abundance of these three He-sdB stars clearly provide evidence of nucleosynthetic processes. Within the error bars, the derived stellar parameters and surface composition of PG1544+488 and JL87 agree with those predicted for stars with deep and shallow flash mixing, respectively. However, LB1766 must have had a different evolutionary history, exposing some remaining puzzles in our understanding of the origin of helium-rich sdB stars.
References
- Ahmad & Jeffery (2003) Ahmad, A., & Jeffery, C. S. 2003, A&A, 402, 335
- Bedin et al. (2000) Bedin, L. R., Piotto, G., Zoccali, M., Stetson, P. B., Saviane, I., Cassisi, S., & Bono, G. 2000, A&A, 363, 519
- Behr (2003) Behr, B. B. 2003, ApJS, in press (astro-ph/0307178)
- Brown et al. (2001) Brown, T. M., Sweigart, A. V., Lanz, T., Landsman, W. B., & Hubeny, I. 2001, ApJ, 562, 368 (Paper I)
- Cassisi et al. (2003) Cassisi, S., Schlattl, H., Salaris, M., & Weiss, A. 2003, ApJ, 582, L43
- Castellani & Castellani (1993) Castellani, M., & Castellani, V. 1993, ApJ, 407, 649
- D’Cruz et al. (1996) D’Cruz, N., Dorman, B., Rood, R. T., & O’Connell, R. W. 1996, ApJ, 466, 359
- D’Cruz et al. (2000) D’Cruz, N. L., et al. 2000, ApJ, 530, 352
- Edelmann et al. (2001) Edelmann, H., Heber, U., & Napiwotzki, R. 2001, Astron. Nachr. 5/6, 401
- Green et al. (1986) Green, R. F., Schmidt, M., & Liebert, J. 1986, ApJS, 61, 305
- Harrison & Jeffery (1997) Harrison, P. M., & Jeffery, C. S. 1997, A&A, 323, 177
- Heber et al. (1988) Heber, U., Dreizler, S., de Boer, K. S., Moehler, S., & Richtler, T. 1988, Astron. Ges. Abs. Ser., 1, 16
- Heber et al. (2000) Heber, U., Reid, I. N., & Werner, K. 2000, A&A, 363, 198
- Hubeny & Lanz (1995) Hubeny, I., & Lanz, T. 1995, ApJ, 439, 875
- Hubeny et al. (1994) Hubeny, I., Hummer, D. G., & Lanz, T. 1994, A&A, 282, 151
- Iben (1976) Iben, I., Jr. 1976, ApJ, 208, 165
- Jeffery et al. (1996) Jeffery, C. S., Heber, U., Hill, P. W., Dreizler, S., Drilling, J. S., Lawson, W. A., Leuenhagen, U., & Werner, K. 1996, in Hydrogen-Deficient Stars, Eds. C.S. Jeffery & U. Heber, ASP Conf. Ser., 96, 471
- Jeffery et al. (1997) Jeffery, C. S., Drilling, J. S., Harrison, P. M., Heber, U., & Moehler, S. 1997, A&AS, 125, 501
- Kilkenny & Busse (1992) Kilkenny, D., & Busse, J. 1992, MNRAS, 258, 57
- Kilkenny et al. (1995) Kilkenny, D., Luvhimbi, E., O’Donoghue, D., Stobie, R. S., Koen, C., & Chen, A. 1995, MNRAS, 276, 906
- Kurucz (1993) Kurucz, R. L. 1993, Diatomic molecular data for opacity calculations, Kurucz CD-ROM 15 (Cambridge, Mass: SAO)
- Lanz & Hubeny (2003) Lanz, T., & Hubeny, I. 2003, ApJS, 146, 417
- Magee et al. (1998) Magee, H. R. M., et al. 1998, A&A, 338, 85
- Moehler et al. (2002) Moehler, S., Sweigart, A. V., Landsman, W. B., & Dreizler, S. 2002, A&A, 395, 37
- OP (1995) The Opacity Project Team, 1995, The Opacity Project, Vol. 1 (Bristol, UK: Inst. of Physics Publications)
- Reimers (1975) Reimers, D. 1975, Mém. Roy. Soc. Liège, 8, 369
- Reimers (1977) Reimers, D. 1977, A&A, 57, 395
- Renzini (1990) Renzini, A. 1990, in Confrontation between stellar pulsation and evolution, C. Cacciari & G. Clementini (eds), ASP Conf. Ser., 11, 549
- Saffer et al. (1994) Saffer, R. A., Bergeron, P., Koester, D., & Liebert, J. 1994, ApJ, 432, 351
- Saio & Jeffery (2002) Saio, H., & Jeffery, C. S. 2002, MNRAS, 333, 121
- Schulz et al. (1991) Schulz, H., Heber, U., & Wegner, G. 1991, PASP, 103, 435
- Sills & Pinsonneault (2000) Sills, A., & Pinsonneault, M. 2000, ApJ, 540, 489
- Sosin et al. (1997) Sosin, C., Dorman, B., Djorgovski, S. G., et al. 1997, ApJ, 480, L35
- Stark & Wade (2003) Stark, M. A., & Wade, R. A. 2003, AJ, 126, 1455
- Sweigart (1997) Sweigart, A. V. 1997, in The Third Conference on Faint Blue Stars, A. G. D. Philip et al. (eds), L. Davis Press, 3
- Sweigart et al. (2002) Sweigart, A. V., Brown, T. M., Lanz, T., Landsman, W. B., & Hubeny, I. 2002, in Centauri: A Unique Window into Astrophysics, Eds. F. van Leeuwen, J. D. Hughes & G. Piotto, ASP Conf. Ser., 265, 261
- Tully et al. (1990) Tully, J. A., Seaton, M. J., & Berrington, K. A. 1990, J. Phys. B, 23, 3811
- Unglaub & Bues (2001) Unglaub, K., & Bues, I. 2001, A&A, 374, 570
- Walker (1999) Walker, A. R. 1999, AJ, 118, 432


| Star | (J2000) | (J2000) | Date | Exp. time [ksec] | ||
|---|---|---|---|---|---|---|
| PG1544+488 | 15 46 11.7 | +48 38 37 | 12.8 | C1290101 | 2002-03-26 | 7.270 |
| C1290102 | 2002-07-14 | 8.541 | ||||
| JL87 | 21 48 37.9 | -76 20 45 | 12.0 | C1290401 | 2002-06-10 | 12.863 |
| LB1766 | 04 59 19.3 | -53 52 55 | 12.3 | C1290201 | 2003-01-03 | 5.353 |
| Star | PG1544+488 | JL87 | LB1766 |
|---|---|---|---|
| Stellar Parameters | |||
| [K] | 36000 | 29000 | 40000 |
| [cm/s2] | 6.0 | 5.5 | 6.3 |
| [] aaCalculated, assuming a stellar mass, . | 1.3 | 1.4 | 1.2 |
| [km/s] | 100 | 30 | 25 |
| Surface Abundances (mass fraction) | |||
| H | |||
| He | 0.96 | 0.99 | |
| C | 0.02 | 0.014 | 0.0001 |
| N | 0.01 | 0.004 | 0.006 |
| O | 0.003 | ||
| Si | |||
| P | |||
| S | |||
| Fe | 0.0013 | 0.0013 | 0.0013 |
| Interstellar Column Densities [cm-2] | |||
| H I | |||
| H2 |