Short time-scale X-ray variability of Active Galactic Nuclei
Abstract
In this work we have investigated short time-scale variability of NGC 4051 and NGC 4388. The quasi-steady QPO’s time scale of 392017 sec was detected for NGC 4051. For the case of NGC 4388 we investigated rapid variability of the parameters of spectral models. To obtain these results, a new “Moving Fit” method for processing of the trailed X-ray spectrograms was developed.
1 Introduction
Short time-scale X-ray variability from dozen of seconds to hours in AGNs is explained as a result of different kinds of processes, which happen close to the central engine. The possible origins are changes of the accretion rate, flares in accretion disk, motion of the hot spots around black hole and, for longer time-scales, the motion of hydrogen clouds, which obscure the central source.
Here we present results of investigations of short time-scale variability of active galactic nuclei using as an example Chandra observations of two bright Seyfert type galaxies NGC 4051 and NGC 4388. Both archive data sets (3144 and 2983) respectively were processed using CIAO version 2.3 package.
2 Flux variability of NGC 4051
Chandra observations of NGC 4051 were made at HRC LETG mode with exposure of approximately 92 ksec on January 01, 2002. To study fast flux variability we extracted only zeroth order image of NGC 4051. For a source and background extracting and making of the light curve we have used dmextract utility of CIAO package.
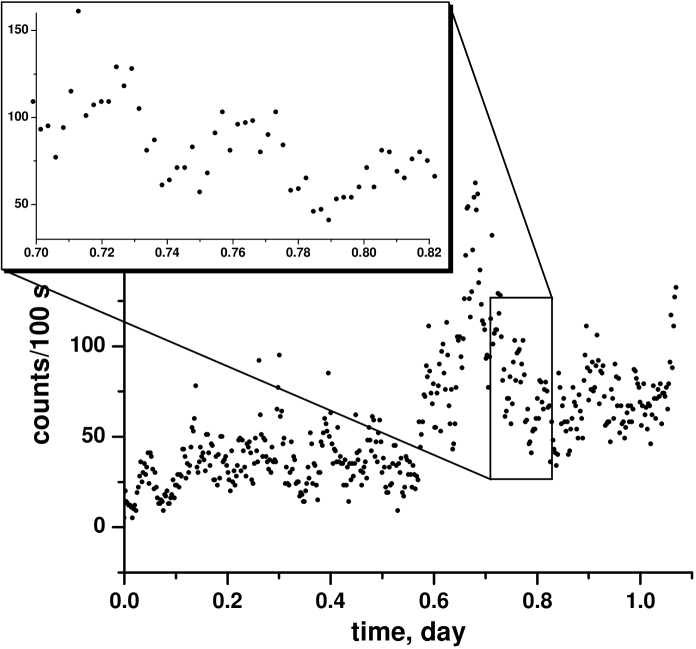
The resulting light curve is shown in the Fig.1. During these observations, NGC 4051 was very active with very strong high amplitude variability. In order to investigate a character of variability we have used wavelet method, which is excellent for detection of the non-coherent or weakly coherent variations. Many papers are devoted to an application of the wavelet method to periodic or multiperiodic processes ([8, 11, 7, 9]). The long-term variations have
been smoothed by using the method of running parabola ([1]). The optimal value of the filter half–width has been determined from maximization of the “signal-to-noise” ratio. To avoid apparent effects of low–frequency trends on the test–functions at high frequencies, the original data have been detrended, i.e. the running parabola fit was subtracted from the observations. For these detrended time series, the test functions have been computed using the code described by [2]. For visualization, we have used the Weighted Wavelet Z-transform (WWZ) test-function [6], which is characterized as having the best contrast among other test functions.
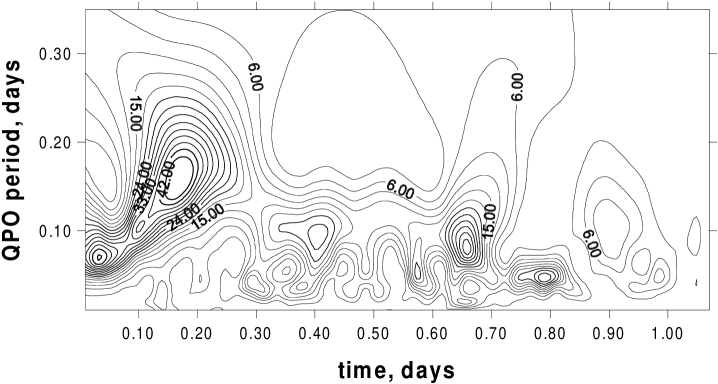
The resulting wavelet map one can see in the Fig. 2. It is clear an existence of the QPOs with different time-scales. The QPOs are coexistent with flares and it is very difficult to distinguish them. One can see that after powerful outburst QPOs almost disappeared.
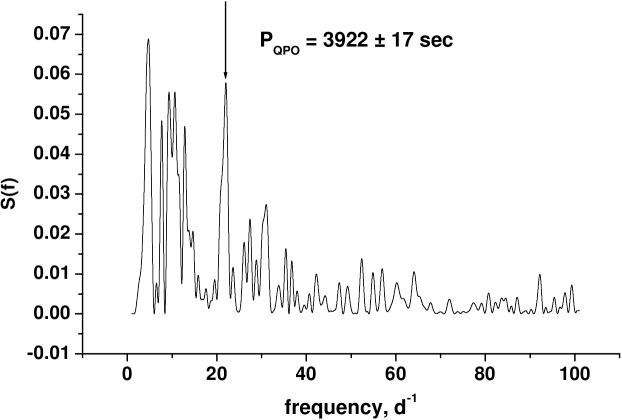
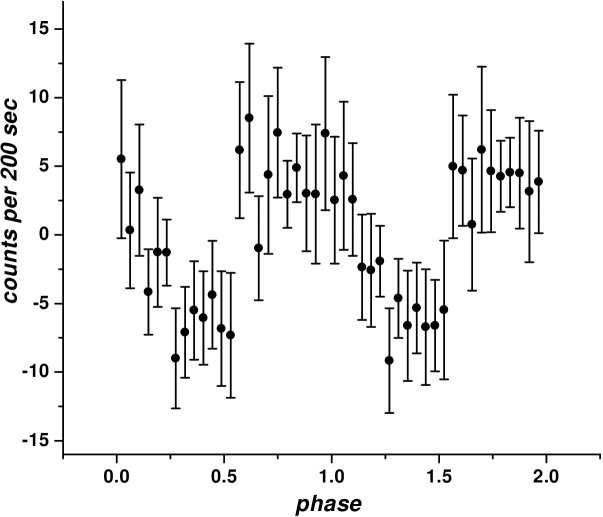
To check the presence of the typical frequency we have computed the power spectrum (using the method of Fourier analysis, which was described by [5]. The power spectrum one can see in the Fig.3. There is very significant peak which corresponds to period 3922 17 sec. The phase folded curve for this period one can see in the Fig.4.
To check the existence of the same frequency in another runs, we have used the archival observations of Chandra obtained with ACIS detector in April 2000 (archive number 859, [4]). In the power spectrum for this run we have found also significant but less pronounced peak 3950 68 sec. Probably, this time-scale corresponds to the orbital period of the inner parts of accretion disk. Assuming the distance of about 10 we can estimate black hole mass as .
3 Investigations of the spectral variability of NGC 4388 using “Moving Fit” method
Rapidly growing sensitivity of X-ray detectors allows to investigate the spectral variability with relatively short time-scales. In order to improve our capabilities in this area we have made the package of the programs, which performed for analysis of the trailed X-ray spectra (Fig.5). This package includes some capabilities of XSPEC and XRONOS packages. It was written using C++ language with CFITSIO and PGPLOT libraries. In the future we are going to make C++ module plus Tcl script for XSPEC for processing of the trailed X-ray spectra.
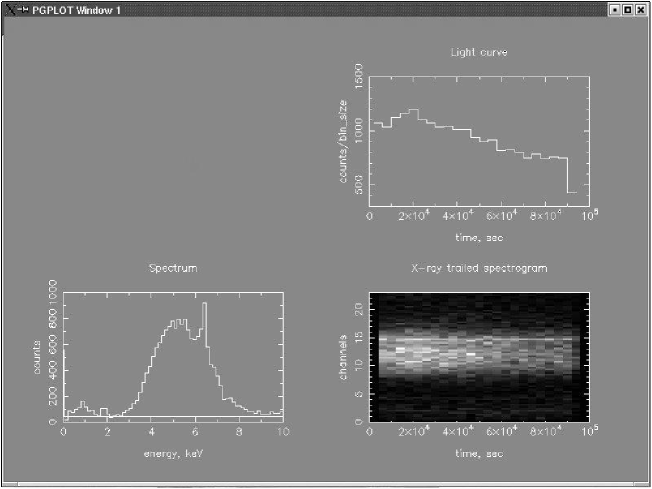
In the present version of the package as an input parameter were chosen binned both in time and energy scale data presented as an FITS image, which we can obtain using dmextract utility in the case of Chandra observations. A detector response matrix file (“rmf”) and an auxilliary response file (“arf”) are also necessary. The present version of our package makes spectral fit with limited number of models like as power law, absorption cut-off, Compton reflection component, gaussian-profile emission lines and some elementary mathematical functions. For minimizing of the statistics a genetic algorithm-based optimization was performed.
The primary idea of “Moving Fit” method is building of the models for a located in time slice of the spectral data and the data from the neighbor time bins taken with some additional weights (the implementation of the “weighted moving average” method for each spectral channel). It is possible to use of different kinds of kernels like as simple rectangular box, gaussian, etc.
Our package also has additional capabilities for complicated 2D fitting, for example, fitting of the emission line behaviour by sine or any other function.
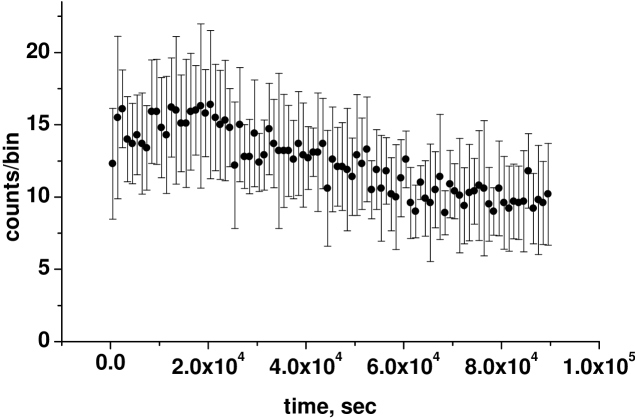
In the present work we have used this package for investigations of the spectral variability of obscured Seyfert type galaxy NGC 4388. Observations (dataset 2983) were obtained on March 6, 2002 with Chandra ACIS detector in the LETG mode. Light curve for this AGN one can see in the Fig.6. Time&energy binned image and “rmf” and “arf” files were created with dmextract utility and psextract script of CIAO package only for the zeroth order image.
Time bin was chosen as 4 ksec. The resulting low energy resolution image was fitted with power law, gaussian line near 6.4 keV and photoelectric absorption calculated following [10]. A power law photo-index was fixed equal to as we have derived for full data set using the same set of models in XSPEC package.
As a smoothing function we have used simple rectangular box with half-width 10 ksec. Resulting curves for hydrogen column, power low normalization index and parameters are presented in the Fig.7. The error bars are 99 % confidence intervals.

First of all the curve for power law normalization parameter is practically identical to the light curve (Fig.6). There is also some possibility for smooth changes of the hydrogen column with time-scale about 40 ksec. The curve for the line central intensity shows flare during which and were probably suppressed.
So you can see, that this method allows to investigate rapid X-ray
spectral variability and could be implemented for different kinds
of objects.
Acknowledgements. Author is thankful to prof. Ivan
Andronov for helpful discussions and to Alina Streblyanskaya, who
stimulated an appearance of this work.
References
- [1] I.L. Andronov, 1997, A&AS, 125, 207.
- [2] I.L. Andronov, 1994, Astron. Nachr., 315, 353.
- [3] P. Charbonneau, 1995, AJ Suppl., 101, 309.
- [4] Collinge et al., 2001, ApJ, 557, 2.
- [5] T.J. Deeming, 1975, Ap&SS, 36, 137.
- [6] G. Foster, 1996, AJ, 112, 1709.
- [7] T. Fritz, A. Bruch, 1998, A&A, 332, 586.
- [8] M.J. Goupil, M. Auvergne, A. Baglin, 1991, A&A, 250, 89.
- [9] A.V. Halevin, N.M. Shakhovskoy, I.L. Andronov, S.V. Kolesnikov, 2002, A&A, 394, 171.
- [10] R. Morrison & D. McCammon, 1983, ApJ, 270, 119.
- [11] K. Szatmary, J. Vinko, J. Gal, 1994, A&AS, 108, 377.