Chapter 1 Shower Studies at around eV with the Surface Detector of the Pierre Auger Observatory
Abstract
Three months of data taken by the Engineering Array Surface Detector of the Pierre Auger Observatory have been analyzed with the aim of setting a procedure for the study of showers at eV. We present the results, concerning: (i) the selection procedure and the check of its efficiency; (ii) the event rate and its stability; (iii) the characteristics of such events (i.e., angular direction, energy estimator , rise time vs core distance, correlation with pressure) showing their consistency with the expectations. The performances of the whole Surface Detector of the Auger Observatory are discussed.
1. Introduction
The study of cosmic rays around eV with the surface detector of the Auger Observatory will be of main significance for: a) the verification and extension of the CR anisotropy measurement reported by AGASA [1], SUGAR [2] and Fly’s Eye [3] from the directions of the Galactic Center and Disk; b) the measurement of the CR flux in an energy range interconnected with other experiments; c) the possibility of improving the cross calibrations with the Auger fluorescence detector, which naturally operates at lower threshold. The Auger southern site surface detector, under construction in the province of Mendoza, Argentina, will consist of 1600 water Cherenkov detectors (WCD), on a triangular grid with a 1.5 km spacing, covering an area of about 3000 km2; a subset of it, the “Engineering Array” (EA), including 32 completely instrumented stations, has been in operation since 2002. We present here the analysis of three months of data taken between May and July 2002, to set a procedure for the selection of showers around eV.
2. Analysis and results
To define the most appropriate trigger configuration to select events with eV, we conducted a preliminary study, using the data from a WCD prototype operated in correlation with AGASA ( eV and ) [4]. The analysis [5] consisted of the simulation of the Auger trigger and its application to the WCD data after proper conversion to the Auger scale. This allowed the derivation of the single tank trigger efficiency as a function of its rate, , core distance, , and energy, . The array trigger efficiency, , obtained from such data, is shown in Tab.1 for different and .
[Hz] [eV] 20 1-2 0.25 0.01 20 2-4 0.45 0.07 2 1-2 0.23 0.01 2 2-4 0.40 0.05
[Hz] [s] (/yr) (/yr) 20 25 20 5 2 25 2 5
Due to the low efficiency of 4-fold mode, 3-fold events have to be used. The background rate due to 3-fold random coincidences for the whole Auger detector is given in Table 2 together with the rate of expected CR events, , with eV, evaluated using the CR spectrum [6], the Auger acceptance ( sr km2, ) and .
The extraction algorithm is firstly based on the selection of 3 nearby triggered tanks in a equilateral pattern. For the Auger-EA ( Hz and coincidence window s) the measured rate, /day, is consistent with that expected from chance coincidences.
To reduce the accidental rate, we lower (through software cuts) both (to s) and (to 2 Hz), so that /day.
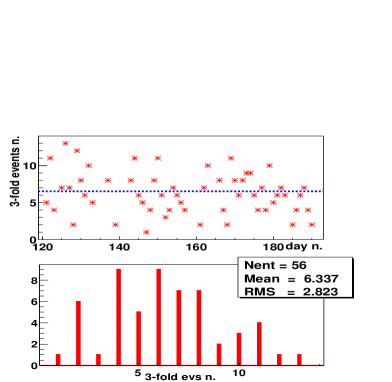
With the described selection criteria, in the period from May 1st through July 11th 2002, we extracted 487 events (416 with ). Fig.1 (top) shows the daily rate (), for days of operation with duty cycle greater than 98%. The daily rate distribution is shown in fig.1 (bottom): the average is /day, the distribution being compatible () with a poissonian one.
The measured rate is then compared with the expected one due to CRs. Taking into account the contributions from different energies ( eV), we evaluate it using spectrum [6], including the Auger-EA acceptance ( sr km2, ) and the array trigger efficiency . is obtained using the WCD prototype data (converted to the Auger-EA scale), in correlation with the AGASA EAS, for the different energy intervals, with an extrapolation to eV. The total predicted rate amounts to /day, consistent with the measured one, within the systematic uncertainties (we remind that the results are based on trigger efficiencies evaluated at the AGASA energy scale).
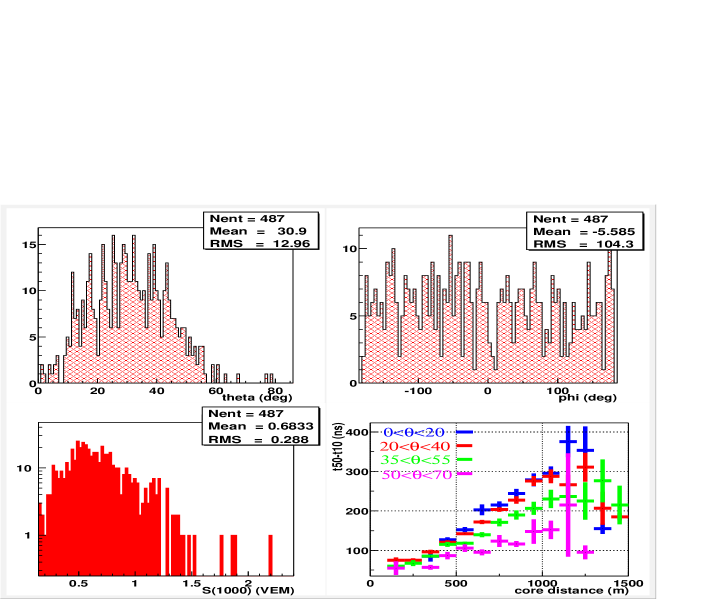
The extracted events have been reconstructed, following the prescriptions given in [7]. The distributions of the arrival angles and are given in fig. 2 (top left and right, respectively), showing good consistency with the expectations. The risetimes from 10% to 50% levels of the signal () vs core distance () in four intervals of are shown in the same figure (bottom right), being in good agreement with simulated data [8] and real ones from Haverah Park [9]. Concerning primary energy, an estimator, (i.e., the signal in Vertical Equivalent Muons at m) corrected for , is shown in fig. 2 (bottom left). The conversion from to primary energy is subject of intense study by the Auger Collaboration (see e.g. [7]): currently, the peak of the distribution corresponds to primary energies ranging from 0.4 to 0.9 eV (consistent with the present knowledge of the primary intensity at such energies, when compared with the measured rates). Lastly, the behavior of the event rate vs atmospheric pressure, , has been studied. The pressure coefficient obtained is mbar-1 (significant at 2), in agreement with Haverah Park [10].
3. Conclusions
Three months of data taken by the Auger-SD EA in a stable
configuration have been analyzed, with the following outcome:
- an algorithm for the extraction of events around eV,
based on geometry and single tank trigger condition corresponding
to 2 Hz (to reduce the random coincidences to the
percent level of the physical event rate) has been tuned and
tested using a WCD prototype operated in connection
with AGASA;
- the event rate is consistent with the expectations
from CR showers due to primaries of energy around eV;
- the shower parameters (distributions of zenith and azimuthal
angles, , rising time vs core distance
and vs zenith angle, correlation with pressure) are consistent
with the expected ones;
- assuming for the full Auger-SD , and using the
spectrum [6], we get ev/yr (in the
AGASA energy scale). The detection level of the AGASA anisotropy
(%), assuming poissonian fluctuations, would thus be
4.5 s.d./yr (in harmonic analysis). Concerning stability,
representing a further requirement for the measurement,
within the present statistics, non poissonian daily instability
effects can be verified to be 6-7%.
4. References
1. Hayashida N. et al. 1999, Astropart. Phys. 10, 303
2. Bellido J.A. et al. 2001, Astropart. Phys. 15, 167
3. Bird D.J. et al. 1999, Ap. J. 511, 739
4. Sakaki N. et al. 1997, Proc. 25th ICRC 5, 217
5. Ghia P.L. and Navarra G. 2003, Auger-GAP note 2003-007
6. Nagano M. and Watson A.A. 2000, Rev. Mod. Phys. 72, 689
7. Billoir P. 2002, Auger-GAP note 2002-044, 2002-075
8. Sciutto S. 2002, private communication
9. Watson A.A. and Wilson J.G. 1974, J.Phys.A 7, 1199, Walker R. and Watson A.A. 1981, J.Phys.G 7, 1297
10. mbar-1, Edge D.M. et al. 1978, J.Phys.G 4, 133