Gravitational Binding, Virialization and the Peculiar Velocity Distribution of the Galaxies
Abstract
We examine the peculiar velocity distribution function of galaxies in cosmological many-body gravitational clustering. Our statistical mechanical approach derives a previous basic assumption and generalizes earlier results to galaxies with haloes. Comparison with the observed peculiar velocity distributions indicates that individual massive galaxies are usually surrounded by their own haloes, rather than being embedded in common haloes. We then derive the density of energy states, giving the probability that a randomly chosen configuration of galaxies in space is bound and virialized. Gravitational clustering is very efficient. The results agree well with the observed probabilities for finding nearby groups containing galaxies. A consequence is that our local relatively low mass group is quite typical, and the observed small departures from the local Hubble flow beyond our group are highly probable.
1 INTRODUCTION
A fundamental question about any spatial configuration of galaxies is whether it forms a gravitationally bound group or cluster. If so, we can ask whether it is sufficiently relaxed to satisfy the virial theorem, , relating the time averages of its kinetic and potential energies. A closely related problem is to estimate the effects of configurations on the peculiar velocities of galaxies around them.
Approximate answers to these questions are known for computer simulations (Saslaw, 1987, 2000) and some observed clusters (Barychev et al, 2001). In this paper, however, we are concerned with statistical properties of many configurations rather than individual cases. This will help determine whether the local group, say, is a typical or unusual configuration. Therefore we will explore probability distributions for peculiar velocities, total energies and virialization in regions of gravitational clustering. Since the observed clustering is highly non-linear on small scales, our theoretical description will also be fundamentally non-linear.
The peculiar velocities of galaxies, i.e. their departures from the global cosmic expansion, provide a basis for our discussion of binding and virialization, and contain significant information about the history of galaxy clustering and the geography of dark matter. Much of this information can be represented by the velocity distribution function , which is the probability that a galaxy has a peculiar velocity between and . In the case of a perfect gas, this is the familiar Maxwell-Boltzmann distribution. In the case of galaxy clustering, which is highly non-linear on scales less than several megaparsecs, departs greatly from the Maxwell-Boltzmann form. This is because it includes galaxies with all degrees of clustering, from isolated field galaxies to the densest rich clusters, in a very large representative volume of space.
The present strongly non-linear velocity distribution presumably developed from more quiescent initial conditions. Initial states which start with a linear Gaussian distribution of density and velocity perturbations can be followed reasonably well into the weakly non-linear regime using perturbation theory (Nusser and Dekel, 1993a, b; Bernardeau et al, 2002). On scales where the distributions have evolved into strongly non-linear systems, dynamic dissipation has destroyed most of the detailed memory of the initial state. For the cosmological many-body case, this relaxation on small spatial scales, where the gravitational field is very grainy (Saslaw et al, 1990), takes only one or two expansion timescales. These non-linearities then spread to larger scales as the clustering evolves.
The observed velocity distribution function was discovered (Raychaudhury and Saslaw, 1996) using a representative sample of galaxies from the Matthewson survey which has relatively little a priori bias regarding their degree of clustering. Previously it had been predicted (Saslaw et al, 1990) using a quasi-equilibrium gravitational many-body theory of galaxy clustering. This theory in which galaxies may be surrounded by individual haloes, is in excellent agreement with relevant N-body simulations and agrees very well with the observations (Crane and Saslaw, 1986; Fang and Zhou, 1994; Sheth et al, 1994; Saslaw and Haque-Copilah, 1998). Other models, such as those dominated by large cold dark matter haloes containing many galaxies could also in principle compute their resulting galaxy peculiar velocity distribution functions and compare them with the observed distribution function, but they do not yet appear to have examined this question in detail.
This distribution function in velocity (or momentum) space complements the distribution in configuration space, and their consistent combination provides a statistical description of evolution in the complete six-dimensional phase space. Originally, (Saslaw et al, 1990), the velocity distribution was derived from the spatial distribution by making the additional main assumption that on average the potential energy fluctuations are proportional to the kinetic energy fluctuations in any local volume. Direct -body simulations confirmed this as a good approximation. Recently a new and more general statistical mechanical derivation (Ahmad, Saslaw and Bhat, 2002) of the spatial distribution function has been calculated. In the present paper, we show how the earlier assumption relating fluctuations can now be proven directly from the statistical mechanical partition function, thus deriving the velocity distribution more rigorously. Moreover, the statistical mechanical derivation contains an explicit softening parameter for the gravitational potential. This provides a simple “isothermal sphere” model for individual galaxy haloes and allows us to determine the effects of such haloes on the peculiar velocity distribution. Comparison with observations gives an approximate upper limit to the size of such haloes.
Combining the velocity distribution function with the new statistical mechanical approach also leads to relatively simple solutions of some other fundamental questions. The additional questions we will examine here are: What is the probability that galaxies in a randomly placed volume of size form a bound cluster? What is the probability that such a bound cluster is virialized? What is the probability of forming a small group of galaxies around which the peculiar velocity dispersion is so small that the local flow agrees well with the global Hubble expansion, as is observed around our local cluster?
To answer these questions, we calculate the density of energy states for the gravitationally interacting cosmological many body system. This is one of a very few statistical mechanical interacting systems (the Ising model is another) for which such a calculation has been possible.
In §2, we derive what was previously the basic assumption that local kinetic energy fluctuations are proportional to local potential energy fluctuation. We then obtain the velocity distribution function for the softened potential representing simple isothermal haloes around individual galaxies. Comparison with the observed peculiar radial velocity distribution function provides an estimate for the maximum average size of such haloes. §3 calculates the density of energy states and the probabilities for bound and virialized clusters, and §4 discusses implications for the cool local Hubble flow. Finally, §5 briefly summarizes and discusses our results.
2 DERIVATION OF THE VELOCITY DISTRIBUTION FUNCTION INCLUDING GALAXY HALOES
To derive the velocity distribution, we start with the canonical partition function derived for the cosmological many body problem viewed as a model for galaxy clustering (Ahmad, Saslaw and Bhat, 2002; Saslaw, 2003):
| (2.1) |
where is a normalization factor, to be discussed in §3,
| (2.2) |
assuming all galaxies in the volume have an average mass and temperature , and
| (2.3) |
Here is the softening parameter for the gravitational potential energy
| (2.4) |
with
| (2.5) |
and is a comparison scale which may, for example, be the average distance between those galaxies which contribute most of the mass.
When , the potential energy is approximately constant, as would characterize an approximately isothermal sphere with density . Of course, this can be generalized easily with a range of values of for galaxies of different masses, but here we are interested in basic results which can be obtained more simply by considering all the galaxies to have their average values of and .
To examine fluctuations in the numbers and energies of galaxies which can move between cells, we need the grand canonical ensemble whose partition function is
| (2.6) |
where is the chemical potential derived from . The grand canonical partition function is related to the equation of state by
| (2.7) |
where
| (2.8) |
with, as usual,
| (2.9) |
the ratio of gravitational correlation energy, , to twice the kinetic energy, , of peculiar velocities in a volume, here taken to be spherical with radius . The two galaxy correlation function is .
From equations -, the spatial distribution function, which is the sum over all energy states in the grand canonical ensemble becomes (Ahmad, Saslaw and Bhat, 2002):
| (2.10) |
where the chemical potential is given by
| (2.11) |
In the limit so that and , becomes the distribution function for point masses (Saslaw, 2000).
To derive the gravitational velocity distribution function, , from the spatial distribution, , we need to modify the grand canonical ensemble by adding a relation between and . Previously in Saslaw et al (1990), this was postulated by assuming that over a given volume any local fluctuation of kinetic energy (caused by correlations among particles) is proportional to its potential energy fluctuation giving
| (2.12) |
The detailed configuration in each fluctuation is represented by the form factor , indicating the local departure from
| (2.13) |
for a Poisson distribution (see Saslaw 1987, equation 33.23 with ). Although varies among fluctuations, it clusters strongly around its average value, as n-body simulations show (Saslaw et al, 1990).
Instead of postulating , we can now derive it from the configuration integral in :
| (2.14) |
The local fluctuation of the potential energy around the spatially constant mean field in a volume containing galaxies therefore has an ensemble average value:
| (2.15) |
using and . We may also write the average potential energy in this volume as
| (2.16) |
where
| (2.17) |
Here represents the form factor. From -, we obtain
| (2.18) |
which is the same as averaged over many cells having the same and with
| (2.19) |
In regions of enhanced density, the are generally smaller than their Poisson values for the average density and consequently from . Using natural units , equation shows that for the currently observed clustering with , the value of is also of order unity. In these units, averaging over the entire system for individual galaxies so that gives the approximate relation with :
| (2.20) |
Although this average value of (or equivalently ) simplifies the description, it gives a reasonably accurate result since the velocity distribution involves all the galaxies in the system, and is thus an effective average over all the cluster configurations in the entire ensemble.
To transform the spatial distribution in into the velocity distribution function, we follow the same procedure as for (Saslaw et al, 1990) to obtain
| (2.21) |
Here is the usual gamma function. Figure 1 shows examples of for some typical parameters suggested by the observations and for a range of . For , we obtain the previous results. As increases, equations and show that decreases and that increases monotonically with increasing and also with increasing . Moreover, , and the disparity between them will increase as increases, though for , the value of . As increases, Fig. 1 shows that the peak of shifts towards higher velocities, but there are fewer galaxies in both the low and high velocity tails, relative to the point mass case . This effect only becomes substantial for , when the haloes of individual galaxies overlap with the haloes of their nearest neighbours.
The effects of halo overlap are to smooth out the gravitational potential wells so that close encounters produce fewer high velocity galaxies. The reason that there are also fewer low velocity galaxies as increases is that the forces are more uniformly distributed throughout the system and fewer galaxies are so gravitationally isolated that their peculiar velocities simply decay adiabatically as the universe expands.
These effects are also illustrated nicely by the radial velocity distribution function, which is what we usually observe. The total velocity is related to its radial and tangential components by
| (2.22) |
Integrating over the tangential velocities (Inagaki et al, 1992) now gives the radial velocity distribution function for the softened potential:
| (2.23) |
where again .
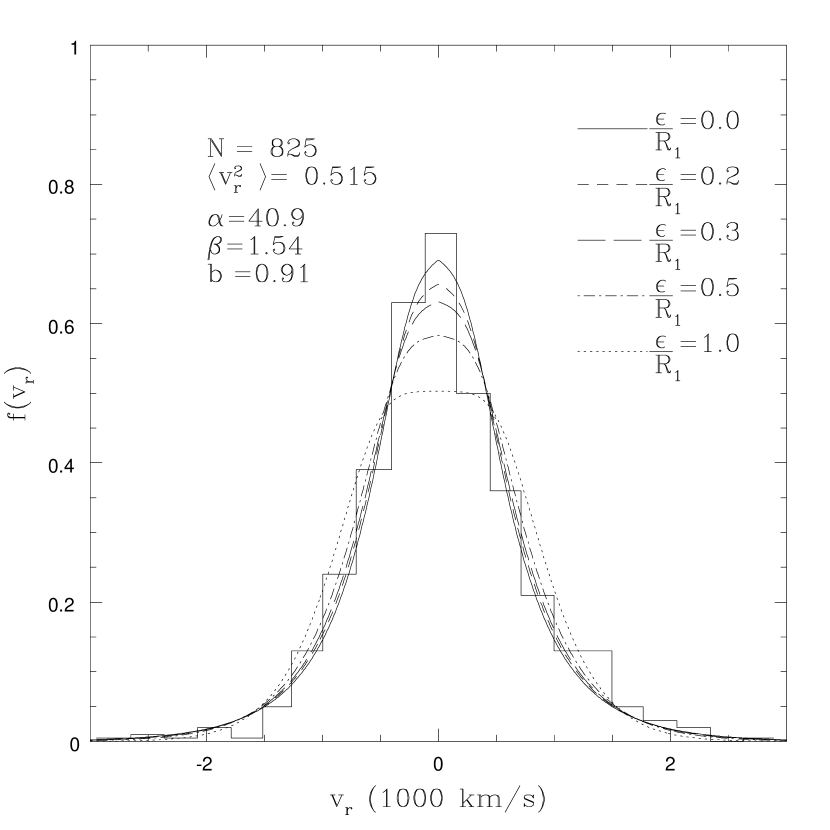
Fig. 2 shows the observed histogram of radial peculiar velocities for a sample of 825 Sb-Sd galaxies with km s-1 from Figure 2a in Raychaudhury and Saslaw (1996), as an illustration. The solid line is the best fit to this histogram for ; it has , , and . The broken lines show the effect of increasing while holding the other parameters constant.
Evidently only relatively large haloes, , affect the velocity distribution (or the counts in cells) significantly. Since these large haloes soften and reduce the gravitational forces, they lead to reduced clustering. This implies fewer galaxies in the very high (radial) velocity tail of the distribution and a broadening around the most probable velocity (at zero for ) whose peak is shifted to somewhat higher velocities. This leaves fewer underdense regions with low velocities. If there are fewer rich clusters and the number of galaxies is at least approximately conserved (i.e. mergers do not dominate, of if they do , they mostly occur near the centers of mass of the merging galaxies and these centers have approximately the same distribution as the galaxies themselves) then fewer voids and underdense regions are formed to create the clusters.
As an illustration, if we take to be an average distance of Mpc between typical massive galaxies, this would suggest that haloes would need to be about 300 kpc in radius for a significant effect. These numbers are made uncertain by the criterion adopted for massive galaxies and the lack of precision in determining the “effective radius” of a halo whose density falls off as , but they are indicative. If , the haloes are nearly touching, and if , several galaxies would share a common halo. The latter case, although it is favoured by some cold dark matter scenarios, would not appear to agree with the presently observed velocity distribution. Instead of the orbits being mainly determined by the (softened) gravitational forces of individual galaxies, such models with determine the orbits mainly by the inhomogeneous distribution of the matter in the common halo. For a communal halo which was not highly concentrated, this would lead to a radial velocity distribution which is relatively broader and less peaked compared to the case with individual haloes and small .
In Fig. 2, by setting , we determine the best fit values of and . Including effects of dark matter haloes, observations of the spatial distribution function, equation , or the variance of its counts in cells, gives directly. Observations of , , the peculiar velocity dispersion and an estimated average galaxy mass (including haloes) would provide from equation . Then equations and give and all the quantities in the theory can, in principle, be found consistently from observations. Comparing and yields .
Figure 2 in Ahmad, Saslaw and Bhat (2002) shows that for , the values of and differ by less than 0.07. Although this difference is small, our Figure 2 shows it can significantly affect the peak of the radial velocity distribution. In practice there is not yet enough information to determine accurately, and it can only be fitted within ranges for prescribed confidence limits. Current data, consistent with , suggest that most individual galaxies are surrounded by their own haloes rather than embedded in large massive common haloes.
3 PROBABILITIES FOR BOUND AND VIRIALIZED CLUSTERS
3.1 The Density of Energy States
For estimates of the mass-luminosity ratio or the amount of dark matter in clusters of galaxies, it is generally assumed that the clusters are gravitationally bound and have a high probability of being virialized (Saslaw, 1987, 2000). Our statistical mechanical analysis now makes it possible to calculate these probabilities directly for the cosmological many-body problem, and to determine how they are affected by the value of and the average peculiar velocity dispersion (or temperature), as well as by the average halo size .
The general probability density, in a grand canonical ensemble, for a region with galaxies to be in the differential range of energy states, , follows from the first equality of equation without the summation over energies as
| (3.1) |
where is the density of energy states and is given by equation . The continuous density of states arises from transforming the sum over individual energy microstates into an integral over a finite range of energies. Here is the average temperature for the ensemble.
To determine for cells containing galaxies, we first recall, for example from Greiner et al (1994), that a subset of the grand canonical ensemble in which each cell contains exactly galaxies (particles) forms a canonical ensemble. It is in contact with a temperature reservoir so that energy, but not particles, can move among cells. A particular cell of volume , with a particular configuration of galaxies has an energy . Averaging these energies over all cells gives the average energy which appears in the equation of state for the system (Saslaw and Hamilton, 1984; Ahmad, Saslaw and Bhat, 2002)
| (3.2) |
since if all cells have a given value of , the grand canonical equation of state also applies to this canonical ensemble. Boltzmann’s fundamental postulate of statistical mechanics relates to the entropy in the microcanonical ensemble by
| (3.3) |
where is the number of energy states in a small range , so .
It is well known that for large values of , the energy in the microcanonical ensemble is very nearly equal to the average energy in the canonical ensemble. Under this condition, we can examine canonical ensembles with different average energies to determine from equation . Therefore we next determine the detailed condition for to hold.
The energy dependence in equation , which involves both the density of states and the Boltzmann factor, is the free energy . The probability of any energy will therefore have an extremum at
| (3.4) |
This extremum will be a maximum if
| (3.5) |
where is the specific heat of the entire ensemble. This ensemble will contain a range of cluster masses and energies for any particular value of . As equation indicates, will remain positive for less than 0.86. If becomes negative, will have no maximum. This state represents a system dominated by negative energy clusters which are however virialized so that they do not become unstable on short timescales and the system remains in quasi-equilibrium. When there is a maximally probable state for energy , we expand the free energy around it:
| (3.6) |
Hence the departures of and from and are closely related to the variance of the energy fluctuations around the mean. Using earlier results for and in the grand canonical ensemble (Saslaw and Hamilton, 1984; Ahmad, Saslaw and Bhat, 2002), which give an upper limit to the fluctuation term in equation , we find
| (3.7) |
This ratio has two poles at when passes through zero and at when all the galaxies collect into one nearly virialized cluster (Baumann, Leong and Saslaw, 2003). Away from these poles, the fluctuation term decreases rapidly (e.g. it is 44.5 at , 15.2 at and 3.78 at ) compared to which is of order non-gravitational terms. Since groups must contain galaxies, the approximation is usually reasonable. This is closely related to the neglect of terms of order in the thermodynamic limit of large since equation then gives . Taking to be a unit dimensionless variation of the energy shell, , from equation below gives .
The grand canonical entropy, which for a sub-ensemble of fixed is the same as the canonical entropy, is a function of temperature (Saslaw and Hamilton, 1984; Ahmad, Saslaw and Bhat, 2002):
| (3.8) |
where from equations and
| (3.9) |
has dimensions of (energy)3. In fact is essentially the absolute value of the potential energy of two galaxies with average seperation. The relation between and for in volumes with energy and given is given by the energy equation of state . Normalizing to dimensionless variables,
| (3.10) |
and
| (3.11) |
Here is defined as the local fluctuating temperature within the ensemble, which differs from , the average dimensionless temperature of the whole ensemble. Using equation , equation becomes
| (3.12) |
or
| (3.13) |
The solutions of both the linear equation for and the quartic for , although equivalent, provide different insights into the relation between and .
Since equation is simpler, we consider it first. Figure 3 shows . It is double valued between the zeroes at and and has a minimum at
| (3.14) |
This value of will be found to divide the two real branches of the solutions to the quartic equation . For large values of , produced either by a high temperature or a weak interaction , in equation , which becomes the perfect gas equation of state. For small , the limit of equation is which is the equation of state for a completely virialized system having specific heat .
The real solutions of the quartic equation are
| (3.15) |
where
| (3.16) |
and
| (3.17) |
The number of energy states from equations and is
| (3.18) |
We then find from either equations or - to calculate . In fact, we use the results from both these solutions to double check the numerical computations; they agree with each other. Already from equation , we see for and thus that which agrees with the usual energy dependence of in an ideal gas (Greiner et al, 1994). For the dual limit as in equation and , recalling that the potential energy dominates so that , we obtain the same energy dependence of . This describes a dense or massive system in which , even though T may remain large and virialized, and the system behaves approximately as an idealized gas gravitationally bound in a cluster. A system of approximately isothermal spheres each with the same nearly Maxwell-Boltzmann velocity distribution would be an example. In equation , we may normalize the volume and the mass to unity by selecting the phase space cell normalization , as often done for the classical gas (Sommerfeld, 1955).
Generally we solve for numerically from and either or and then integrate equation over a range of energies (or equivalent temperatures) of interest. The normalization is such that for fixed , , and
| (3.19) |
It is important to keep in mind, because has a double valued regime as in Figure 3, that the subscripts ”max” and ”min” refer to the maximum and minimum values of over which the integral is evaluated, and not to the maximum and minimum values of the energy. Thus the integral is evaluated from a value of corresponding to the minimum value on the branch, through on the branch, and then to after switching to the branch at and .
Since the system is in quasi-equilibrium in the expanding universe, its range of energies, , is more restricted than the usual infinite range. States with positive energies represent unbound groups or clusters, and if their energy is too great they will fly apart on time-scales much shorter than the Hubble time and be inaccessible to the thermodynamics of the quasi-equilibrium system. Negative energy states which are not near virial equilibrium will collapse on time-scales much shorter than the Hubble time, and they will not be accessible either. We can estimate directly from on the branch of the two real solutions of the quartic equation. One can also obtain a less direct but similar estimate of from the temperature of a cluster modeled as a polytrope. To estimate the maximum kinetic energy, we note that if the kinetic energy is twice the potential energy, the velocities in the unbound region will be about twice the virial velocities that the region would have had if it were virialized. These would be about the escape velocity, giving . More precise values of these limits will follow from the solutions for and the binding probabilities. In Figure 3, we show the regions of these different solutions. Two of the four solutions of the quartic equation become complex for which is where the switch from the to the real branches occurs. For , the total energy is positive and tends towards the perfect gas limit. With these solutions for , we obtain the density of states
| (3.20) |
represented here in terms of for simplicity, and setting
| (3.21) |
From , we immediately see that there is a smooth transition around , where the total energy becomes negative. As , the density of states becomes proportional to . This infinite number of negative energy states describes a singularity. To reach this singularity, the motions must be dominated by radial infall with negligible random velocities and therefore negligible temperature. In this regime, the quasi-equilibrium nature of the theory breaks down.
Figures 4 and 5 illustrate as a function of , which is single valued unlike , and also for a range of . It is clear from the linear plots in Figure 4, and from the logarithmic plots in Figure 5 for a much greater range of , that the have infinite maxima both for the perfect gas and for gravitating systems of galaxies as . In the latter limit, the random velocity dispersion , or the gravitational energy , and the galaxies in a cell collapse into a singularity having infinite entropy. The dynamical timescale for such a collapse is so short that these systems cannot be in quasi-equilibrium, and such states are inaccessible to the statistical thermodynamic description. Moreover, they are also inaccessible because they are not physically realistic. In any collapse toward a singularity, it is very unlikely that all the radially infalling orbits will remain in phase and reach the centre simultaneously. Instead, they perturb each other, introducing more random velocities which build up until the contracted system reaches virial quasi-equilibrium which then evolves on a much longer timescale. As shown in , this occurs around . Between this value and the density of energy states has a broad minimum corresponding to states which have neither a high gravitational entropy nor a high perfect gas entropy. The total number of configurations of these states is constrained by their relatively narrow range of energy for a given range of temperature around the minimum of the relation in Figure 3. Therefore these are much less probable low entropy states.
Figures 4 and 5 also show the somewhat anomalous behaviour of the case , an effect of the approximation . However, for , the curves become more regular and this approximation becomes more reasonable; even for , it is qualitatively accurate. For larger , the transition to large becomes sharper and occurs at both lower and higher values of than for small . With , we can now determine for a canonical ensemble with each cell containing galaxies using equation . The normalization cancels the contributions of in the chemical potential and although N still affects the form of .
3.2 Binding and Virialization
The probability that galaxies in a cell are gravitationally bound together is
| (3.22) |
The number of bound states determines the number of unbound states through the normalization . We have also computed separately as a check that the integrations satisfy this normalization.
As figures 4 and 5 show, the integrals depend somewhat sensitively on the limits and through their dependence on and . We will explore this sensitivity around average values of these limits. To estimate an average value for , we note that for the -th cell containing galaxies
| (3.23) |
where is the average gravitational correlation energy. If in a typical state, then if the cell were bound in virial equilibrium it would have . If it were just bound, , and if it were sufficiently unbound that the root mean square velocity were twice the virial root mean square velocity, so that , then the configuration would expand to about twice its size on a dynamical time scale. Such states are not in quasi-equilibrium and would not be accessible to the statistical mechanics or thermodynamics of the ensemble. Therefore we exclude them. (In the statistical mechanics of perfect gases, this exclusion is not necessary since particles of all energies are assumed to be in equilibrium.) This suggests on the branch.
To estimate , it is more straightforward to work with , which is a positive single-valued quantity, and then find through equation . Using equations and and the relation between temperature and kinetic energy, gives
| (3.24) |
Here we have used the relation (cf equation 33.22 in Saslaw 1987) connecting the average uniform number density to the average seperation between galaxies: . The dynamical timescale is , and is usually unity or slightly less from equation . Although the minimum value of the velocity dispersion for quasi-equilibrium to apply is not precisely defined, it is necessary that so that the configuration does not collapse on a dynamical time scale. This suggests corresponding to on the branch.
To check these estimates, we can compute from equation for a range of . The binding probability will also depend on through its relation to in equation . Figure 6 shows the results for and . There is a bifurcation at between bound probabilities which increase with and those which decrease. We would expect that the more galaxies there are in a cell of given volume, the more likely they are to form a gravitationally bound group. Therefore functions which decrease with increasing are unphysical and, in Figure 6, only those cases with increasing are valid. These unphysical cases have . However, is also the smallest value from equation which is consistent with quasi-equilibrium. Both arguments therefore suggest that on the branch of the relation in Figure 3, is the physical lower limit of the probability integrals for .
With on the branch, Figure 7 shows the effect of on the binding probabilities for different . Note that enters through in equations - and the normalization in equation . As increases from for a nearly perfect gas to for a highly clustered gravitational system, the binding probabilities increase significantly. These probabilities are high even for relatively small values of which illustrates the efficiency of gravitational clustering. Dynamically, positive density perturbations expand more slowly than the surrounding universe even if they are linear, and eventually they become bound. In a statistical mechanical description, these bound states have many more possible velocity and density configurations than the corresponding unbound states.
One range of bound energy states is of special interest. These are the approximately virialized states around on the branch, discussed after equation , which is in equation with . Although the definition of the “virial range” is somewhat arbitrary, here we take it to be on the branch. Recall that for , the relation becomes imaginary. Figure 8 shows bound and virialized probabilities as well as the conditional probability that a bound system of particles is in this virial range. Most bound states become virialized and then evolve slowly so we should expect that many, including our local group have been observed.
3.3 Comparison with Observed Groups of Galaxies
Identifying physically bound groups of observed galaxies is often uncertain based on limited velocity and positional information. Nevertheless, reasonable estimates of the numbers of such groups have been made for the local universe where problems of incomplete sampling have been minimized. These estimates also depend on the criteria used to define a group. Garcia (1993) has explored these issues in some detail and developed a catalog of 485 groups with members each in a selected sample of nearby galaxies with apparent magnitudes and radial velocities km s-1. Two procedures, one based on hierarchial structures, the other based on percolation, are used to establish group membership. From these, Garcia (1993) derived the number of groups having members shown in Figure 9 as the solid (hierarchial) and dashed (percolation) histograms taken from Garcia’s Figure 2. The moderate difference between these histograms is a measure of the uncertainty of group membership. We use these results for comparison with the expected probabilities of bound groups in cosmological gravitational many-body clustering.
To calculate the theoretical numbers of groups at the present time (using the observed so that ), we multiply from equation by from equation and normalize the total number to the 485 groups in Garcia’s catalog. Figure 9 shows the results with for the solid line. We have also examined the results of varying between -0.04 and -0.1. This range of does not affect the probabilities significantly.
Overall there is reasonable agreement between the theoretical estimate of the number of bound groups and the observed estimate for , which includes most of the sample. For the predicted number is higher, while for , it agrees again with the observations. The causes of the discrepancy are difficult to determine, but may be related to the sensitive dependence of the numbers in more populated groups on the magnitude cutoff. The theory assumes that all galaxies have the same mass and luminosity for simplicity and this could be improved. Larger catalogues, complete to fainter limiting apparent magnitudes will soon become available and it will be interesting to see if they improve the agreement.
4 THE COOL LOCAL HUBBLE FLOW
We can apply these results to the long-standing problem of the small peculiar velocity dispersion, km s-1, of galaxies in our local group (van den Bergh, 1999, 2000; Ekholm et al, 2001). Consequently, the relatively small mass of the local group, () does not significantly perturb the linear Hubble flow beyond about 1.5 Mpc (Sandage, Tammann and Hardy, 1972; Sandage, 1986; Ekholm et al, 2001). As Sandage (1999) has emphasized “… the explanation of why the local expansion field is so noiseless remains a mystery.” The dynamics of the local flow and more general catalogs of peculiar velocities have been explored by many authors (Groth, Juszkiewicz and Ostriker, 1989; Peebles, 1990; Burstein, 1991; Governato et al, 1997; Willick et al, 1997; Willick and Strauss, 1998; van der Weygaert and Hoffman, 2000; Nagamine et al, 2001).
Previously, there have been three main types of explanation for the cool local Hubble flow. One, pioneered by Kahn and Woltjer (1959) and subsequently often discussed, involves specific detailed models of the dynamics of the formation of the local group. On the other hand, there may be more generic reasons for low peculiar velocities. Sandage, Tammann and Hardy (1972) suggested two possibilities: a very low density universe, or a high density universe dominated by a uniform component of matter. In both these cases, gravitational galaxy clustering would usually be relatively weak if it started from weakly clustered initial conditions. The low density universe is not generally considered likely at present, but the uniform high density possibility has recently been revived by Barychev et al (2001) in terms of a dark matter component suggested by a large positive value of the cosmological constant.
In explorations of these or other explanations, the fundamental question is whether our weakly clustered local group is unusual enough to demand a specific dynamical history, or whether it is quite commonplace. Therefore we need to calculate the probability that a small weakly bound group such as our local group can form. Although our local group contains about three dozen galaxies in a volume of about one megaparsec radius, most of its mass and energy are dominated by Andromeda and the Milky way (including their dark matter haloes). Most of the other galaxies are dwarfs or satellites. This makes us a group with effectively , or perhaps major galaxies if all the smaller galaxies are equivalent to one large galaxy.
From Figure 6, at least 86 of all such groups are bound. Thus the probability of a bound group such as our local cluster is approximately . Using equation for with and gives lower limits to the probability that there are bound groups with effective massive galaxies within a radius of one megaparsec from an arbitrary point in space. These limits are and using effective values of or respectively for our local cluster. Thus within a radius of 10 Mpc, we would expect more than about for or 80 for groups such as our own whose masses are too small to perturb their local Hubble flow strongly. From equation , there would also be bound groups of greater mass which would perturb the Hubble flow more strongly, but such massive groups would be less numerous. Low mass bound groups like ours should be separated on average by Mpc. So if they have a radius of Mpc and are randomly placed there is about a 10 probability that a galaxy at a random position of space will belong to such a group. Many galaxies will belong to even lower mass groups. This is also a lower limit since most groups and galaxies are clustered rather than located randomly. Therefore there is at least a 10 chance that an astronomer in an arbitrary galaxy would belong to a group which does not seriously disturb the surrounding cosmic expansion. This seems to us a high enough probability to remove most of the mystery of the cool local Hubble flow.
5 SUMMARY AND DISCUSSION
Distribution functions for peculiar velocities and gravitational binding probabilities among galaxies provide new insights into their clustering. These complement the more often analyzed distributions and correlations of galaxy positions. Galaxy haloes, for example, generally affect velocities more strongly than they affect positions. Haloes soften the gravitational forces and inhibit the high velocities associated with strong clustering. Strong clustering can still develop at these lower velocities, it just takes longer.
Gravitational statistical mechanics is proving to be a powerful method for calculating these distributions. It applies not only to the cosmological many-body problem, but also to finite systems (de Vega and Sanchez, 2003), although since finite systems have different symmetries they have a different thermodynamic limit than our infinite system. In our cosmological case, the statistical mechanical derivation of the peculiar velocity distribution function does not require assuming that average local kinetic energy fluctuations are proportional to average local potential energy fluctuations. We show that this assumption is a direct consequence of the partition function. Moreover our new derivation generalizes previous results by including possible haloes around galaxies. The currently observed peculiar velocity distribution function appears most consistent with each massive galaxy usually being surrounded by a single individual halo rather than many galaxies sharing a large common halo. Future extensive and accurate radial peculiar velocity observations can quantify this result more precisely.
The density of energy states for a system of gravitationally interacting galaxies in the expanding universe is a fundamental quantity. Usually the classical density of energy states can be calculated in detail only for non-interacting systens, but our cosmological gravitating system turns out to be a rare exception. Our calculation of this density of states makes it possible to find the probability that a group of galaxies is gravitationally bound and virialized. This calculated probability agrees well with the observed probability distribution for finding groups of galaxies within about 100 Mpc. The preponderance of relatively low mass groups also provides a simple explanation for the observation that most groups, such as our own, do not disturb the Hubble flow beyond the group appreciably.
These results also show that the efficiency of gravitational galaxy clustering is very high. More than 85 of double systems and more than 95 of groups with massive galaxies are bound. Of these at least 95 are virialized. This is consistent with earlier studies (Saslaw, 1979, 1987) which found that the observed form of the galaxy two-point correlation function leads to highly efficient clustering.
The binding probability increases rapidly as increases. This is more dramatic for small values of than for large values. For large , nearly all groups are bound for . Since increases as the universe expands (a manifestation of entropy increase), this describes the evolving formation of bound groups and clusters. At the present time, nearly all clusters with massive galaxies are expected to be bound and virialized. Even for moderate values of , which occur at redshifts depending on the details of the expansion rate (Saslaw and Edgar, 2001), we would expect most groups to be bound and virialized.
The high efficiency of binding and virialization on relatively small scales provides further insight into the quasi-equilibrium nature of galaxy clustering. On small scales, virialized clusters remain unstable only over dynamical relaxation timescales , which are generally longer than a Hubble time. On large scales, the formation of new clusters from linear perturbations takes at least a Hubble time. Therefore changes in and the global equations of state take at least a Hubble time for their instability. This exceeds the local dynamical crossing timescale, , and is thus consistent with the approximation for quasi-equilibirum (Saslaw, 2000).
Since the probability that a group forms depends on its total energy, and its energy depends on its shape as well as on its size and number of massive galaxies, our results make it possible to calculate the probability that stable or unstable structures such as filaments or “great walls” can occur. We will analyze this elsewhere.
References
- Ahmad, Saslaw and Bhat (2002) Ahmad, F., Saslaw, W.C. and Bhat, N.I. 2002, ApJ, 571, 576
- Barychev et al (2001) Barychev, Yu., Chernin, A., and Teerikorpi, P. 2001, AA, 378, 729.
- Baumann, Leong and Saslaw (2003) Baumann, D., Leong, B. and Saslaw, W.C. 2003, MNRAS, 345, 552.
- Bernardeau et al (2002) Bernardeau, F., Colombi, S., Gaztanaga, E., and Scoccimarro, R., 2002, Phys. Rep., 367, 1.
- Burstein (1991) Burstein, D., 1991, Large-Scale Structures and Peculiar Motions in the Universe, ASP Confernece Series, edited by D.W. Latham and L.N. daCosta, Vol. 15, pp. 39.
- Crane and Saslaw (1986) Crane, P. and Saslaw, W.C. 1986, ApJ, 301, 1.
- de Vega and Sanchez (2003) de Vega, H. J. and Sanchez, N., astro-ph/0307318.
- Dressler et al (1987) Dressler, A, Faber, S.M., Burstein, D., Davies, R.L., Lynden-Bell, D., Terlevich, R. and Wegner, G. 1987, ApJ, 313, L37.
- Ekholm et al (2001) Ekholm, T., Barychev, Yu., Teerikorpi, P., Hanski, M.D., and Paturel, G. 2001, AA, 368, L17.
- Fang and Zhou (1994) Fang, F. and Zhou 1994, ApJ, 421, 9.
- Garcia (1993) Garcia, A. M., 1993, AAS., 100, 47.
- Governato et al (1997) Governato, F., Moore, B., Cen, R., Stadel, J., Lake, G. and Quinn, T., New Astronomy, 1997, 2, 2.
- Greiner et al (1994) Greiner, W., Neise, L. and Stcker, 1994, Thermodynamics and Statistical Mechanics, Springer Verlag.
- Groth, Juszkiewicz and Ostriker (1989) Groth, E.J., Juszkiewicz, R. and Ostriker, J.P., ApJ, 1989, 346, 558.
- Inagaki et al (1992) Inagaki, S., Itoh, M. and Saslaw, W.C., 1992, ApJ, 386, 9.
- Kahn and Woltjer (1959) Kahn, F.D. and Woltjer, L. 1959, ApJ, 130, 705.
- Mathewson et al (1992) Mathewson, D.S., Ford, V.L and Buchhorn M., 1992, ApJS, 81, 413.
- Nagamine et al (2001) Nagamine, K., Fukugita, M., Cen, R., Ostriker, J. P., 2001, MNRAS, 327, 10.
- Nusser and Dekel (1993a) Nusser, A. and Dekel, A., 1993, ApJ, 391, 443.
- Nusser and Dekel (1993b) Nusser, A. and Dekel, A., 1993, ApJ, 405, 437.
- Peebles (1990) Peebles, P.J.E., ApJ, 1990, 362, 1.
- Raychaudhury and Saslaw (1996) Raychaudhury, S. and Saslaw, W.C., 1996, ApJ, 461, 514.
- Sandage, Tammann and Hardy (1972) Sandage, A., Tammann, G. A. and Hardy, E., 1972, ApJ, 172, 253.
- Sandage (1986) Sandage, A. 1986, ApJ, 307, 1.
- Sandage (1999) Sandage, A. 1999, ApJ, 527, 479.
- Saslaw (1979) Saslaw, W.C. 1979, ApJ, 229, 461.
- Saslaw and Hamilton (1984) Saslaw, W.C, and Hamilton, A.J.S. 1984, ApJ, 276, 13.
- Saslaw (1987) Saslaw, W.C. 1987, Gravitational Physics of Stellar and Galactic Systems, Cambridge University Press
- Saslaw et al (1990) Saslaw, W.C., Chitre, S.M., Itoh, M. and Inagaki, S. 1990, ApJ, 365, 419.
- Saslaw and Fang (1996) Saslaw, W.C. and Fang, F. 1996, ApJ, 460, 16.
- Saslaw and Haque-Copilah (1998) Saslaw, W.C. and Haque-Copilah, S. 1998, ApJ, 509, 595.
- Saslaw (2000) Saslaw, W.C. 2000, The Distribution of the Galaxies: Gravitational Clustering in Cosmology, Cambridge University Press.
- Saslaw and Edgar (2001) Saslaw, W.C. and Edgar, J.H. 2001, ApJ, 534, 1.
- Saslaw (2003) Saslaw, W.C. 2003, in The Early Universe and the Cosmic Microwave Background: Theory and Observations, edited by N. B. Sanchez and Y. N. Parijskij (Dordrecht: Kluwer Academic Publishers) pp. 325-348.
- Sheth et al (1994) Sheth, R. K., Mo, H., J. and Saslaw, W.C. 1994, ApJ, 427, 562.
- Sommerfeld (1955) Sommerfeld, A. 1955, Thermodynamics and Statistical Mechanics: Lectures in Theoretical Physics Vol. V, New York: Academic Press.
- van den Bergh (1999) van den Bergh S. 1999, AA Rev., 9, 273.
- van den Bergh (2000) van den Bergh S. 2000, The Galaxies of the Local Group, Cambridge: Cambridge University Press.
- van der Weygaert and Hoffman (2000) van der Weygaert, R. and Hoffman, Y., 2000, in Cosmic Flows Workshop, ASP Conference Series, edited by S. Courteau and J. Willick, vol. 201, 169.
- Willick et al (1997) Willick, J. A., Courteau, S., Faber, S. M., Burstein, D., Dekel, A. and Strauss, M. A. 1997, ApJS, 109, 333.
- Willick and Strauss (1998) Willick, J. A. and Strauss, M. A., 1998, ApJ, 507, 64.