Polarization and kinematics in Cygnus A
Abstract
From optical spectropolarimetry of Cygnus A we conclude that the scattering medium in the ionization cones in Cygnus A is moving outward at a speed of 17034 km s-1, and that the required momentum can be supplied by the radiation pressure of an average quasar. Such a process could produce a structure resembling the observed ionization cones, which are thought to result from shadowing by a circumnuclear dust torus. We detect a polarized red wing in the [O III] emission lines arising from the central kiloparsec of Cygnus A. This wing is consistent with line emission created close to the boundary of the broad-line region.
keywords:
galaxies:active – galaxies individual: Cygnus A– infrared:galaxies – infrared:ISM – quasars:general – ISM:dust1 Introduction
Dust in active galaxies provides a screen that can both obscure the central regions from direct view, but also scatter nuclear radiation into our line of sight. By studying the scattering-induced polarization of the emission lines, some aspects of the kinematics of the scattering medium can be deduced (Walsh & Clegg, 1994). In this paper we study the polarization and kinematics of line emitting regions in the radio galaxy Cygnus A.
Cygnus A is one of the brightest and nearest powerful double-lobed radio galaxies. Its proximity allows us to spatially resolve the two narrow-line regions on either side of the nucleus with sufficient signal-to-noise to study the polarization of the emission lines. Hence, it is an ideal object to study the physics of the narrow-line region. From radio observations we know that the western side is oriented towards us, with the radio jet inclined at about 50∘ to our line of sight (Carilli & Barthel, 1996). We will refer to the western side as the near side, and to the eastern side as the far side.
The optical continuum polarization has been studied in detail by Ogle et al. (1997, hereafter O97). They find a strong blue, polarized continuum in the west, consistent with the presence of a medium power central quasar. In the east the emission is less polarized, which they ascribe to dilution by a young stellar population. Both in direct and in polarized light they detect a broad component underlying the narrow H emission line. In the west they also detect polarized broad H, in agreement with the orientation of Cygnus A, and confirming the presence of a hidden quasar.
Near- and mid-infrared images show biconical structures, resembling the optical ionization cones (Jackson et al., 1998). In the near-infrared, the edges of the cones are bright and highly polarized (Tadhunter et al., 1999), indicating that the walls of the ionization cones are dusty, and illuminated by the central quasar. In a later paper (Tadhunter et al., 2000), it is shown that polarization is only seen along one side of the bicone. No explanation has yet been found for this asymmetry. Mid-infrared imaging at 10 and 18 m confirms the existence of a conical shape, which is especially prominent on the far side (Radomski et al., 2002).
Ionization cones are common in active galaxies. The two physical processes that can generate low density cones are obscuration close to the central source as in young stellar objects, and suspected to be present in most active galaxies, or a bi-polar outflow as detected in planetary nebulae. Obscuration by a dusty torus is postulated as part of the unification scheme for radio-loud active galaxies (Urry & Padovani, 1995). However, outflow of matter has been detected in broad absorption line quasars, where gas moving away from the nucleus causes broad absorption lines in the optical and UV spectrum. Cygnus A shows outflowing gas at larger distance which emits [OIII] lines (Tadhunter et al., 1994). Outflows can excavate funnels in the galaxy, in which the ISM will be ionized by the central source. They can be driven by either the radiation pressure of the central quasar, or a nuclear starburst and do not necessarily require any obscuration to produce sharp shadows. Using existing deep optical spectropolarimetry of Cygnus A, we can determine aspects of the kinematics of the narrow-line region, and infer the process that dominates the creation of the ionization cones.
For the remainder of this paper we will use 65 km s-1 Mpc-1 and 0.5, and a redshift for Cygnus A of , determined from the redshift of the nuclear [OIII] doublet in our data.
2 The data reduction
For our analysis we will use the same data as used in the O97 paper. They consist of deep spectropolarimetry of Cygnus A, obtained with the Low Resolution Imaging Spectrograph polarimeter (Oke et al., 1995; Goodrich et al., 1995) at the Keck telescope during the night of UT 1996 October 4–5. A longslit of 1′′ width was used, aligned with the radio axis at PA=101∘. Two sets of data were obtained, one in good seeing (0.6′′) of seconds, and a second with worse seeing (1.0′′) of seconds. Both sets contain observations at four different angles of the half-wave plate (HWP), i.e. 0∘, 22.5∘, 45∘ and 67.5∘. The spectra cover 3500 to 8500 Å in the observed frame, with a dispersion of 2.5 Å per pixel and effective resolution of 10 Å.
Data reduction on the spectra was performed separately for each orientation of the HWP, splitting the usual ordinary and extra-ordinary rays. Standard IRAF routines were used for bias subtraction, flat field division, wavelength calibration from NeAr arc spectra, and geometrical correction. The final 3 error in both the wavelength calibration and the geometrical correction is 0.6 Å, which corresponds to one fourth of the spectral pixel size. Three 0.85′′ apertures are traced in all separate 2-dimensional spectra, located 1.2 kpc east of the nucleus, at the nucleus itself, and at 1.2 kpc west of the nucleus. The width of the apertures corresponds to 1 kpc in the host galaxy. The apertures used for sky subtraction are 10′′ from the nuclear emission region on either side. The two sky apertures are averaged before subtraction. After the complete reduction the two data sets with different seeing are combined to obtain a better signal to noise in the emission lines. No galaxy subtraction is performed.
After suitable binning, the 8 rays are combined to form the Stokes parameters , and , from which we compute the fractional polarization. We have corrected for the Ricean bias by using a Monte Carlo technique (Fosbury et al., 1993). This method provides a distribution function of , , and , and gives an estimate of their errors. The complete technique is described in detail by Vernet (2001). The resulting value of is corrected for the instrumental offset and calibrated using observations of the polarized standard star HD 155528.

3 Results
In this paper we will focus on the polarization of the emission lines. For the results and analysis of the continuum polarization and its different spectral components, we refer to the O97 paper. The strongest narrow lines were selected to calculate the fractional polarization, polarization angle and polarized flux over the profile. The general observed trend in all these lines is well illustrated by the [O III] doublet at 4959,5007 Å, shown in Fig. 1.

We observe significant polarization of % in the emission lines in the east and west. The fractional polarization decreases from the continuum value towards the line center. In the nucleus %, consistent with no polarization. The value of % is consistent with the value found by O97 of %. In all apertures we observe a peak in polarization Å redward of the line center. In the east and nucleus this causes a redshift of a few Ångströms in the polarized line flux. In the western aperture a rotation in polarization angle of is observed over the line. The same trend is seen in the other apertures, albeit with larger errors.
The wavelength shift of the polarized line is particularly prominent in the nucleus, where the polarized line corresponds to a red wing observed in the total flux line. This wing, as shown in Fig.2, is not seen in the other apertures, and remains undetected in other strong emission lines. However, these are all significantly weaker, or blended in the red. Hence, the presence of a red wing as seen in the nuclear [O III] doublet cannot be excluded.
Deviations in the fractional polarization can be induced during the data-reduction process, especially by residual wavelength calibration errors between the o- and e-rays. To assess whether the observed red peak in the polarization is due to such an error, we constructed a simple model that reproduces the effects of line broadening and wavelength shifts in a single ray on the resulting polarization of a Gaussian emission line. The only way to reproduce a feature as observed in Cygnus A, is by changing the line width and offsetting the line center in two of the ordinary ray frames. This is impossible to reconcile with the fact that all data are reduced identically. In addition, the offset needs to be 10 times larger than the achieved wavelength calibration error. Therefore, we conclude that the observed signature is intrinsic.
4 Analysis of the line polarization
As discussed above, the fractional polarization of the emission lines shows a peak redward of the line center. Similar behaviour has been observed in the planetary nebula NGC 7027 (Walsh & Clegg, 1994), where it is interpreted as an outward movement of the scattering medium. If the central quasar in Cygnus A can provide enough radiation pressure to push the matter in the ionization cones outward, this implies a similar situation can occur.
Treating scattering as instantaneous absorption and re-emission, it is easy to see that scattering of photons by a particle moving away radially from the source of emission will produce a Doppler shift. The observer sees the photon with a wavelength , given by:
in which is the angle between the direction of motion of the scattering particle and the line of sight to the observer, is the particle velocity, is the wavelength at which the photon is emitted, and assuming .
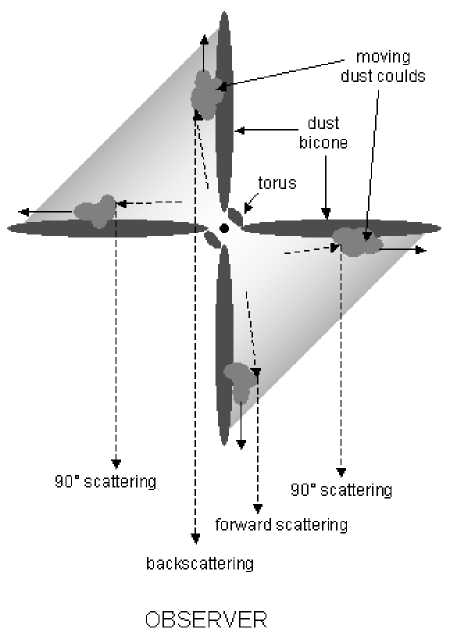
The effect of the moving dust on the resulting polarized spectrum depends only on the angle of observation, . The situation is illustrated in Fig. 3. The term reaches a maximum of for backward scattering. To the observer, this occurs only on the eastern side of the galaxy, so here a maximum shift is expected in the polarized line flux. For scattering through 90∘ the term equals 1, which occurs on both sides. Therefore, it cannot generate an observed difference between the polarized emission lines from either side. In the case of forward scattering, the cosine term cancels, and the wavelength of the scattered emission is equal to the emitted wavelength. This is only possible on the western side. For scattering through angles close to 0 or 180∘ there is little polarization. However, the scattered emission on the both sides arises from an integral over scattering angles between 90∘ and either 0∘ or 180∘, which can result in the 3% polarization in the emission lines.
By measuring the offset of the peak of the line in polarized flux on
the east, the expansion velocity of the scattering medium can be
obtained. From radio observations we know that the angle of the jet is
50∘ (Carilli &
Barthel, 1996), which corresponds to an angle of
140∘ between the direction of motion of the scattering
medium and our line of sight. The offset is measured to be
5 1 Å, which yields an outflow velocity of
170 34 km s-1. This is very small compared to outflow velocities
of several to tens of thousands km s-1 that are generally measured in
broad-absorption line quasars (Elvis, 2000), and
suggests that the scattering medium is unrelated to the high velocity
clouds that produce the UV and X-ray absorption lines in such
systems.
To understand the nature of the driving force, we will estimate the expected velocity of dust clouds driven by the radiation pressure from the central source. A grain will be pushed outward if it experiences a radiation pressure larger than the force of gravity. The radiative acceleration on a single grain is given by:
| (1) |
(see Lamers & Cassinelli, 1999, p.165), in which is the radiation pressure efficiency, which we will assume to be unity, the radius of the grain, the total luminosity of the central source, the distance, the speed of light and the mass of a single grain. The grain mass is given by , and the specific density of the grain material g cm-3 for silicate grains and 1.8 g cm-3 for carbonaceous grains. Classic interstellar dust grains extend a range of sizes from 0.001 m to 10 m (Laor & Draine, 1993). We assume an average grain radius of 0.1 m as in Radomski et al. (2002), to balance the effects of larger acceleration for smaller grains, and lower abundance of the larger grains. We also assume pure silicate dust, adding carbonaceous grains to the dust will increase the radiative acceleration. Furthermore, we adopt a nuclear luminosity erg s-1 based on the recent X-ray observations by Young et al. (2002). At a distance of 1 kpc, the radiative acceleration in Cygnus A equals 5.1 cm s-2. The gravity acceleration exerted on the grain depends on the mass enclosed within the radius at which the grain sits:
assuming again a distance of 1 kpc, and being the mass within that radius in units of solar mass. The radiative acceleration exceeds the gravity if M⊙. This is equivalent to the mass of a large spiral galaxy, and about two orders of magnitude larger than the mass of the super-massive black hole in Cygnus A of M⊙ (Tadhunter et al., 2003), which is expected to dominate the central potential. Thus we can safely assume that the dust will be accelerated by radiation pressure.
With M⊙ we can express the acceleration of a dust cloud in terms of the central luminosity, dust-to-gas ratio () and distance from the central source:
where is the total number of dust grains in an optically thin cloud, given by
and
in cgs units, for the values of the parameters adopted above. We use a Galactic dust-to-gas ratio of .
The solution of the equation of motion gives the cloud velocity as a function of distance to the central source:
where is the distance from the nucleus where the dust cloud is formed, and the terminal velocity is given by . Adopting a cloud velocity of 170 km/s at a distance of 1 kpc, we find that the cloud must have formed at kpc. This implies that the scattering medium originates within the 1 kpc aperture. If it had been created in the nuclear regions and accelerated from there, its velocity at 1 kpc would have been much higher than observed. Presumably the dust from the dense layer at the edge of the bicone is entrained in the turbulent flow in the bicone. When it enters the radiation field of the central source, it will experience the radiation pressure. The dust clouds will then move away from the nucleus, while scattering the light from the central source. This is consistent with the hypothesis derived from the infrared appearance of the bicones that their central regions have been cleared from dust by radiation pressure, as proposed by Tadhunter et al. (2000).
Two basic assumptions are made. First of all, we assume the scattering cloud to be optically thin. If the cloud were optically thick, it would have to be created closer to the central source, since its effective scattering surface will be smaller, and the coupling of radiation to the dust particles will be less efficient. The second basic assumption is that the drift velocity is small compared to the thermal speed of the gas, which implies that all momentum that is transfered from radiation to the dust cloud is shared by all dust and gas particles via internal collisions. This assumption is valid if the gas density is above a critical value that can be derived from eq. 7.44 in Lamers & Cassinelli (1999) by setting the drift velocity equal to the thermal speed. Adopting a temperature of K (Osterbrock, 1978) the thermal speed of the gas is of order 10 km s-1. This results in a lower limit for the electron density of the gas of 40 cm-3. The typical observed electron density in narrow-line regions lies around cm-3 (Osterbrock, 1978; Ferland, 1981), several orders of magnitude above the critical lower limit, so this assumption is valid.
The use of polarization shows unambiguously that an outflow must be present in the ionization cones. In case of an infall of matter, the absorbed emission will have a blueshift: . On the side where is small a blueshift of the line in polarized flux is expected, while for large no net effect should be visible. In the geometry of Cygnus A this would correspond to a blueshift in the eastern aperture. Using polarimetry of forbidden line profiles thus provides a unique method to measure infall and outflow velocities in any astronomical object.
5 Conclusions
Spectropolarimetry of (active) galaxies provides a powerful probe of the kinematics of the different components present. It can be used to uniquely determine outflow or infall of matter in any sufficiently polarized astronomical object.
Large scale mass outflow occurs in Cygnus A, driven by the radiation pressure of the central source. The outflow velocity is measured to be km s-1. This causes changes in the fractional polarization over the narrow emission lines, showing a shift of the line peak in polarized flux to the red. The polarized line flux from the east is redshifted, while on the west no shift is observed. This is only consistent with an outflow, not with infall of matter.
A previously undetected redshifted nuclear component is found in [O III], which is highly polarized. This component is consistent with line emission generated very close to the broad-line region, which is obscured from direct view. It is consistent with previous observations of anisotropic [O III] emission (Hes et al., 1993), and requires an obscuring medium of some sort in our line of sight to the inner narrow-line region. This nuclear component is not observed in any other narrow line, but its presence cannot be excluded due to blending or lower signal-to-noise in the other lines.
The detection of an outward moving scattering medium in the ionization cones suggests that their shape could be determined by an outflowing wind driven by the radiation from the central quasar coupling to the dust. This is consistent with previous results by Tadhunter et al. (1999); Tadhunter et al. (2000). As a consequence, the detection of ionization cones in active galaxies cannot necessarily be used as evidence in favour of orientation-based unification, although it does not exclude the presence of an obscuring torus. The high obscuration of the central regions in Cygnus A and other radio galaxies could also be attributed to large scale dust. Detailed near- and mid-infrared observations, and modeling the emission of obscuring tori are required to give direct evidence of their presence.
Acknowledgements We wish to thank Pat Ogle, Hien Tran, Joe Miller, Bob Goodrich and Marshall Cohen for initial involvement. Furthermore, thanks to Xander Tielens and Peter Barthel for advise and critical comments. Thanks to Jeremy Walsh for initial involvement. And thanks to the anonymous referee for suggesting small but significant refinements of the text. IMvB wishes to thank ESA, STScI DDRF grant 41559, ESO and the Kapteyn Institute, Groningen, the Netherlands, for financial support. RAEF is affiliated with the Space Telescope Division of the European Space Agency, ESTEC, Noordwijk, the Netherlands.
References
- Carilli & Barthel (1996) Carilli C. L., Barthel P. D., 1996, A&AR, 7, 1
- Elvis (2000) Elvis M., 2000, ApJ, 545, 63
- Ferland (1981) Ferland G. J., 1981, ApJ, 249, 17
- Fosbury et al. (1993) Fosbury R., Cimatti A., di Serego Alighieri S., 1993, The Messenger, 74, 11
- Goodrich et al. (1995) Goodrich R. W., Cohen M. H., Putney A., 1995, PASP, 107, 179
- Hes et al. (1993) Hes R., Barthel P. D., Fosbury R. A. E., 1993, Nature, 362, 326
- Jackson et al. (1998) Jackson N., Tadhunter C., Sparks W. B., 1998, MNRAS, 301, 131
- Lamers & Cassinelli (1999) Lamers H. J. G. L. M., Cassinelli J. P., 1999, Introduction to stellar winds. Cambridge University Press
- Laor & Draine (1993) Laor A., Draine B. T., 1993, ApJ, 402, 441
- Ogle et al. (1997) Ogle P. M., Cohen M. H., Miller J. S., Tran H. D., Fosbury R. A. E., Goodrich R. W., 1997, ApJ, 482, L37
- Oke et al. (1995) Oke J. B., Cohen J. G., Carr M., Cromer J., Dingizian A., Harris F. H., Labrecque S., Lucinio R., Schaal W., Epps H., Miller J., 1995, PASP, 107, 375
- Osterbrock (1978) Osterbrock D. E., 1978, Physica Scripta, 17, 285
- Radomski et al. (2002) Radomski J. T., Piña R. K., Packham C., Telesco C. M., Tadhunter C. N., 2002, ApJ, 566, 675
- Tadhunter et al. (2003) Tadhunter C., Marconi A., Axon D., Wills K., Robinson T. G., Jackson N., 2003, MNRAS, 342, 861
- Tadhunter et al. (1994) Tadhunter C. N., Metz S., Robinson A., 1994, MNRAS, 268, 989
- Tadhunter et al. (1999) Tadhunter C. N., Packham C., Axon D. J., Jackson N. J., Hough J. H., Robinson A., Young S., Sparks W., 1999, ApJ, 512, L91
- Tadhunter et al. (2000) Tadhunter C. N., Sparks W., Axon D. J., Bergeron L., Jackson N. J., Packham C., Hough J. H., Robinson A., Young S., 2000, MNRAS, 313, L52
- Urry & Padovani (1995) Urry C. M., Padovani P., 1995, PASP, 107, 803
- Vernet (2001) Vernet J., 2001, PhD thesis, Université Paris 7
- Walsh & Clegg (1994) Walsh J. R., Clegg R. E. S., 1994, MNRAS, 268, L41
- Young et al. (2002) Young A. J., Wilson A. S., Terashima Y., Arnaud K. A., Smith D. A., 2002, ApJ, 564, 176