CENSORS: A
Combined EIS-NVSS Survey Of Radio Sources.
I. Sample definition, radio data and optical identifications
Abstract
A new sample of radio sources, with the designated name CENSORS (A Combined EIS-NVSS Survey Of Radio Sources), has been defined by combining the NRAO VLA Sky Survey (NVSS) at 1.4 GHz with the ESO Imaging Survey (EIS) Patch D, a 3 by 2 degree region of sky centred at 09 51 36.0, 21 00 00 (J2000). New radio observations of 199 NVSS radio sources with NVSS flux densities mJy are presented, and compared with the EIS –band imaging observations which reach a depth of ; optical identifications are obtained for over two–thirds of the confirmed radio sources within the EIS field. The radio sources have a median linear size of 6 arcseconds, consistent with the trend for lower flux density radio sources to be less extended. Other radio source properties, such as the lobe flux density ratios, are consistent with those of brighter radio source samples. From the optical information, 30–40% of the sources are expected to lie at redshifts .
One of the key goals of this survey is to accurately determine the high redshift evolution of the radio luminosity function. These radio sources are at the ideal flux density level to achieve this goal; at redshifts they have luminosities which are around the break of the luminosity function and so provide a much more accurate census of the radio source population at those redshifts than the existing studies of extreme, high radio power sources. Other survey goals include investigating the dual–population unification schemes for radio sources, studying the radio luminosity dependence of the evolution of radio source environments, and understanding the radio power dependence of the K relation for radio galaxies.
keywords:
Surveys — galaxies: active — radio continuum: galaxies — galaxies: luminosity function1 Introduction
The study of complete samples of radio sources can provide important information on the cosmic evolution of the number density, nature and physical properties of radio sources. For this reason, since the birth of radio astronomy considerable effort has been put into obtaining complete optical identifications and redshifts for flux–limited samples of sources selected at a variety of different observing frequencies and flux density levels (e.g. Laing, Riley & Longair 1983 Allington-Smith 1984, Spinrad et al. 1985, Eales 1985a, Wall & Peacock 1985, Dunlop et al. 1989, Lacy et al. 1993, McCarthy et al. 1996, Best, Röttgering & Lehnert 1999,2000, Waddington et al. 2001, Rawlings, Eales & Lacy 2001, Willott et al. 2002, and references therein).
An important study that can be carried out with such samples is to determine the cosmic evolution of the luminosity function of radio sources. In 1990, Dunlop & Peacock [1990] carried out a detailed investigation of this, and presented the first evidence for a decline in the comoving number density of powerful radio sources beyond . Since this time, however, whilst numerous advances have provided a good consensus in the determination of the low redshift radio luminosity function (e.g. Mobasher et al. 1999, Gavazzi & Boselli 1999, Machalski & Godlowski 2000, Sadler et al. 2002), the high redshift evolution and the reality of the ‘redshift cut-off’ in the radio source population have remained areas of much controversy. Willott et al. [1998, 2001] found no evidence for a cut-off beyond using the 7C radio survey [1998], whilst Bremer et al. [1999] claimed tentative indications of a redshift cut-off in a smaller sample of ultra-steep spectrum sources selected from the Westerbork Northern Sky Survey (WENSS; Rengelink et al. 1998) at similar luminosities. In more recent studies, Waddington et al. [2001] showed that a sample selected at the 1 mJy level does show evidence for a deficit of moderate luminosity radio sources at , but this sample had insufficient sky coverage to investigate the most luminous sources, while the sample of Jarvis et al. [2001] at the 100 mJy level proved too shallow to detect sufficient sources at high enough redshift to clarify the high-redshift evolution. It is clear that a radio source sample at a flux density level intermediate between these two is required to resolve this issue.
Taking a census of the high redshift space density of radio sources is one of the key goals of the current survey. In recent years it has become apparent that resolving this issue has far-reaching importance, since massive black holes appear to reside in all massive present-day spheroids, with a mass roughly proportional to the baryonic mass of the spheroid [2001]. This suggests that black-hole and spheroid formation are intimately linked (e.g. Richstone et al. 1998) and that understanding the cosmic evolution of black holes is of importance for testing theories of structure formation in general. There are strong indications that powerful radio activity, at least for steep spectrum radio sources (see Woo & Urry 2002 for an alternative view based on a study of flat–spectrum quasars), is only produced by the most massive black holes (; e.g. Dunlop et al. 2001); the cosmic evolution of powerful radio sources may therefore offer the cleanest way to constrain the evolution of the top end of the black-hole mass function.
A complete radio source sample at these flux densities will also enable several other important astrophysical questions to be addressed. These include:
-
•
Dual–population unification schemes of radio sources: Wall & Jackson [1997] model the radio luminosity function using just 2 parent populations of radio sources, Fanaroff & Riley (1974; hereafter FR) Class I and II, in conjunction with orientation unification. The population mix and evolution at the low luminosities of this sample will provide a critical test of this model, as well as allowing investigation of the differential evolution of FR I and FR II radio sources (c.f. Snellen & Best 2001).
-
•
Evolution of radio source environments: studies of the environments around radio sources of different radio luminosities (e.g. Wold et al. 2000, Finn et al. 2001) show that at moderate redshifts () the most luminous radio sources lie in richer environments than lower luminosity sources, in contrast to what is found in the nearby Universe (e.g. Prestage & Peacock 1988). The inconsistency of the spatial correlation functions of the Green Bank and WENSS surveys [1998], and the weak variation of the cross–correlation amplitude of radio sources with radio flux density (e.g. Overzier et al. 2003 and references therein) further suggest that the evolution of radio source environments may be radio luminosity dependent, in a similar manner to evolution of the comoving number densities of sources. A sample of lower luminosity sources would test this model providing valuable insight into the physical mechanisms behind radio source evolution.
-
•
The K relation: radio galaxies show a very tight correlation between their K-magnitude and redshift [1984], but interestingly, the K relations of radio galaxies from the 3CR and 6C samples, selected at different limiting radio flux densities, are in agreement at low redshifts () but show a mean offset of magnitudes in the K-band at [1996, 2002]. This result means either that the Kband magnitudes of the most radio luminous sources contain a significant AGN contribution, which would have important consequences for interpretations of the spectral energy distributions of radio galaxies in terms of their stellar populations, or that more powerful radio sources at high redshift are hosted by more massive galaxies [1998]. This second possibility is consistent with the black–hole vs spheroid mass correlation, since if the black holes in high redshift radio galaxies are fuelled at the Eddington limit then more massive galaxies (with more massive black holes) will produce more powerful radio sources. The similarity of the K-magnitudes of the different radio samples at lower redshifts would then have interesting implications for the evolution of fuelling of these objects. Comparing the K relation for fainter radio samples with that of the 6C sample will help to distinguish between these two possibilities (c.f. also Willott et al. 2003).
With all of these goals in mind, we have begun a project to produce a spectroscopically complete sample of radio sources at the mJy level. This project takes advantage of two recent large surveys: the NRAO VLA Sky Survey (NVSS) which has surveyed the radio sky at 1.4 GHz, and the ESO Imaging Survey (EIS) which has provided deep optical imaging over four 3 by 2 degree fields. By combining these two surveys, a sample of radio sources can be defined for which the majority already have optical identifications for their host galaxies.
In this paper, the radio source sample is defined, the radio properties of the sample are described based on new high angular resolution observations, and a comparison of these with the EIS optical data is made. The layout of the paper is as follows. Section 2 discusses the properties (e.g. depth, size) required of a radio source sample to successfully address the question of the high redshift evolution of the radio luminosity function. In Section 3 the EIS and NVSS surveys are briefly described, together with the definition of the preliminary EIS-NVSS sample from these. The new higher resolution VLA radio observations of these sources are described in Section 4, and the radio properties of these sources are discussed in Section 5. The new radio maps are compared with the EIS optical fields in Section 6, together with a likelihood analysis to identify the possible optical host galaxies; the nature of these optical hosts is discussed. The new data are used to refine the sample definition and produce the final radio source sample, designated the CENSORS sample (a Combined EIS–NVSS Survey of Radio Sources), in Section 7. The results are summarised in Section 8. Subsequent papers (Brookes et al. in prep.) will present infrared K–band imaging data to identify the radio source host galaxies too faint to appear in the EIS survey, the spectroscopic follow–up observations, and the consequences of these for our understanding of the evolution of the radio luminosity function at high redshifts.
2 Sample Requirements
From the results of Waddington et al. [2001] and Jarvis et al. [2001] it is clear that to resolve the question of the redshift cut–off, what is required is near-complete redshift information for a sample selected at intermediate flux densities, mJy. This corresponds to about the break of the radio luminosity function at redshifts ; 10 mJy radio sources at redshifts are also of comparable radio luminosity to nearby luminous radio sources such as those in the 3CR sample, allowing the most direct comparison of the cosmic evolution of the intrinsic properties of the radio sources.
 |
 |
The suitability of the 10 mJy flux density level for radio luminosity function work is demonstrated in Figure 1, where the percentage of the radio sources in a sample above a given radio power and redshift is illustrated as a function of redshift for three different flux density limits (1, 10 and 100 mJy at 1.4 GHz), for the ‘Pure luminosity evolution’ model of Dunlop & Peacock [1990] with no redshift cut-off. It is clear that a 10 mJy flux density cut-off provides by far the largest fraction of powerful sources at redshifts beyond . The lower panel of Figure 1 demonstrates this further, by comparing the percentage of sources in a sample which have radio powers W Hz-1sr-1 (around the break of the radio luminosity function at ) and redshifts as a function of the flux density limit of the sample. Although the exact details are model dependent, a 10 mJy sample is clearly at around the optimal flux density level to distinguish the presence or absence of a redshift cut–off.
Another important issue, given the goal of measuring the space density of high redshift radio sources, is that the area of sky studied is large enough not to be significantly affected by large–scale structure, especially since these radio galaxies are likely to be highly clustered sources.
Clustering increases the chances of finding a galaxy at a distance from another galaxy by a factor , such that the probability of finding two galaxies in two volumes and separated by a distance is given by , where is the number of galaxies per unit volume. The cross-correlation function is known to be well–matched by a power–law, , where is the correlation length and . Galaxies at redshifts selected by the Lyman-break technique have been shown to have correlation lengths of Mpc [2002]. Radio galaxy hosts are likely to be more massive than these, and hence more strongly clustered; Daddi et al. [2003] find that luminous red (JK ) galaxies with photometric redshifts have correlation lengths of Mpc, and these are more likely to be representative of the radio source population. At redshifts , a spatial scale of 10 Mpc corresponds to about 20 arcminutes on the sky (, , km s-1Mpc-1).
To assess the affect of this clustering on the high redshift radio source counts, a population of radio sources was built up, following the method outlined by Soneira & Peebles [1977, 1978], such that they had a correlation length of 12 Mpc. These were constructed over a Mpc3 volume. A rectangular field–of–view was then chosen, of a given long axis size () and a 3:2 axial ratio (to match that of the EIS Patch D – see below). The source counts were normalised to provide an average of 25 radio sources within a volume element defined by this field of view ( by Mpc) and the length of the redshift interval ( Mpc). Then, for 100 different sight-lines through the simulation, the number of sources actually observed in this volume was determined, and this was repeated for 150 different simulations of the 20003Mpc3 volume. This whole process was carried out for a number of different field sizes, .

As expected, the effect of large–scale structure is to broaden the observed distribution of source counts, due to some sight–lines sampling clusters of sources and others passing through voids. The effect of clustering was quantified by measuring the width of the number count distribution, and comparing it to the Poissonian expectation. The factor by which the large–scale structure increases the distribution width (relative to Poissonian) is plotted against the field–of–view, , in Figure 2. It is clear that for small fields clustering plays an important role, but that when the field size gets up to about 100 Mpc in size the plot begins to level off and the effect of large–scale structure has dropped below the 15–20% level. This corresponds to an angular size of about 3 by 2 degrees (at ) for the survey, which is the size of the ESO Imaging Survey Patch D (see Section 3).
Finally, it is important to consider the number of radio sources required for the survey. If there is no redshift cut-off then the Dunlop & Peacock [1990] models predict that over 20% of radio sources in a sample with 10 mJy flux density limit should be at , whilst if a decline is included then their pure luminosity evolution and luminosity density evolution models predict respectively and % of sources above that redshift. A sample of radio sources is sufficient to distinguish between these possibilities at the level, whilst keeping the sample size to a manageable level. Conveniently, to obtain this number of sources down to a mJy flux density level also requires a sky area of order six square degrees. The combination of the EIS and NVSS surveys is therefore ideal.
3 Sample Definition
3.1 The ESO Imaging Survey (EIS)
The wide–field ESO Imaging Survey (EIS-wide) comprises a relatively wide–angle survey of four distinct patches of sky of up to 6 square degree each, selected to have low optical extinction and to exclude especially bright stars or nearby clusters of galaxies [1999]. Of these four regions, the most northerly, Patch-D, is a 3 by 2 degree field centred at RA: 09 51 36, Dec -21 00 00 (J2000), and is thus sufficiently far north to be relatively easily accessible for radio observations with the Very Large Array (VLA) synthesis array. During the EIS-wide project, the entirety of Patch-D was imaged in the –band using the EMMI camera mounted on the 3.5-m New Technology Telescope (NTT) at La Silla. This provides a pixel scale of 0.266 arcsec per pixel. Each region of sky was observed for 300 seconds in each of two separate exposures.
A single–entry catalogue has been constructed for the EIS Patch D in –band [1999], in which objects detected in more than one overlapping pointing are listed as a single entry, with the parameters determined from the best seeing image; the seeing on the images ranges from 0.5 to 1.6 arcsec. This catalogue contains over 560000 objects, reaching an 80% completeness limiting magnitude of typically [1999]. Postage–stamp images are also available. The EIS-wide survey of Patch D has been complemented by a Wide Field Imager survey (using the ESO 2.2m telescope) of the same field (see http://www.eso.org/science/eis/) in the and bands, reaching limiting magnitudes of and . Only catalogues of each Wide Field Imager pointing are currently available, not a combined single–entry catalogue nor postage stamp images. Astrometry on both of these surveys is accurate to within 0.2 arcsec [1999].
The , , and filters used were filters designed especially for the EIS project; they have effective wavelengths close to those of the Johnson–Cousins filters, but are broader and with sharper cut-offs. The transformation between the EIS magnitudes and the Johnson–Cousins magnitudes is zero for stars with colours of zero, and is significantly below 0.1 magnitudes even for objects with the most extreme colours [1999].
The extracted magnitudes used in all wavebands were derived using SExtractor (which was used to identify and measure properties of the galaxies in the EIS catalogues; for details of SExtractor see Bertin & Arnouts 1996), and are estimates of the total magnitude of the object. Note, however, that these apertures have not been precisely matched between the different catalogues, and so aperture difference will introduce some scatter into the measured colours.
3.2 The NRAO VLA Sky Survey (NVSS)
The NRAO VLA Sky Survey (NVSS) is a radio survey carried out at a frequency of 1.4 GHz using the Very Large Array in the D and DnC array configurations [1998]. This provides an angular resolution of about 45 arcseconds full–width at half–maximum (FWHM). The survey covers the whole sky north of declination (J2000), to an root–mean–squared (rms) brightness level of 0.45 mJy beam-1. Thus, the survey is essentially complete to mJy, to which level there are about 50 sources per square degree.
The 45 arcsec beam size of the NVSS survey is significantly larger than the median angular size of faint extragalactic sources at these flux density levels ( arcsec; Condon et al. 1998), meaning that most sources will be unresolved. This has the benefit that for the majority of detected objects an individual radio source is contained within a single NVSS component, and the NVSS flux density measurement should have good photometric accuracy with little or no flux density missed by resolving out structure. However, the low angular resolution of this survey means that follow–up observations are required in order to determine the structure of a radio source, and to pin-point its position to allow identification of the optical counterpart.
3.3 Initial Sample Definition
The EIS-NVSS radio source sample was initially defined in 1997, at which stage only an early version of the NVSS catalogue had been produced, and the EIS observations were still in progress. The original definition of this sample was as follows:
-
•
-
•
-
•
mJy in original NVSS catalogue.
This corresponded to a sample of 199 radio sources, and these were assigned a designation of ‘EISD’ followed by a catalogue number which was ‘1’ for the brightest source and increased with decreasing NVSS flux density. The sky area defined by these limits is slightly larger than the final degree sky area of the EIS Patch D; it eventually turned out that 44 of these sources lay outside of the region covered by the optical imaging, and so are not considered in the final CENSORS sample discussed below. One source, NVSS-J095759-2005 with was found to have been accidentally excluded from the sample. Since this lies outside of the EIS Patch D, and so is not within the CENSORS sample from which the radio luminosity function work will be carried out, this exclusion will have no significant consequences.
The sample properties differ somewhat from these initial selection criteria, since the current public NVSS catalogue (version 2.17, issued July 2002) differs substantially from the preliminary catalogue from which the observed sample was selected. Significant deviations are found in both the positions and the flux densities of the sources, suggesting that these have been re-estimated. In general, the source flux densities have been amended downwards, so that the new flux densities are on average nearly 10% lower than those originally selected, although with considerably scatter from source to source. Importantly though, some of the sources that were just below the flux density threshold in the original sample definition are now quoted to be brighter than some sources that were included in the sample. The effects of this are discussed in Section 7, and the final CENSORS sample of radio sources is defined there.
4 Radio Observations
4.1 VLA BnA array observations
Radio observations of the 199 originally selected sources were taken at 1.4 GHz using the VLA in BnA configuration on 15 and 19th June 1998 (see Table 2 for details). The observations used the standard two IFs at frequencies of 1385 and 1465 MHz, with a bandwidth of 50 MHz. The BnA configuration is a hybrid between the B and A configurations with larger spacings of the antennae along the northern arm, designed to produce approximately circular beams for targets at low declinations. The angular resolution provided by this setup is typically between 3 and 4 arcseconds.
Depending on their NVSS flux densities, the sources were observed for up to 8 minutes each. The exposure time for each source was set to provide a roughly constant integrated signal–to–noise ratio of 60, for an unresolved source. For those sources with total exposure times in excess of 5 minutes, the exposure was split into two separate scans in order to improve the uv coverage. The primary flux calibrator 3C286 (1331+305) was observed twice during each of the runs, and was used to calibrate the flux density scale assuming flux densities of 14.55 and 14.94 Jy for that source at 1385 and 1465 MHz respectively. These are the most recently determined VLA values (1995.2), based upon the scale of Baars et al. [1977]. The nearby secondary calibrator 0921263 was observed approximately every 30 minutes to provide accurate phase calibration.
The data were processed using standard techniques incorporated within the aips software provided by the National Radio Astronomy Observatory. After first applying baseline corrections and discarding data from any antenna or baseline showing excessive noise, the data were cleaned using the aips task imagr. Maps were made over a 512 by 512 pixel field, with 0.6 arcsec pixels; to reduce the noise from the sidelobes of sources outside this central field and to obtain a good model of the field for subsequent self–calibration, the positions of all other sources within the 30 arcmin VLA primary beam with mJy were extracted from the NVSS and 128 by 128 pixel fields centred on these positions were also included in the cleaning process. For 193 of the sources, sufficiently bright point sources were observed within the fields that one or two cycles of phase self–calibration were used to improve further the map quality.
4.2 VLA CnB array observations
As discussed below, a number of the more extended sources were largely resolved out at the high angular resolution provided by the BnA configuration observations. For these sources, radio data at lower resolution were required. Observations of these sources (excepting EISD176 and EISD196 which lay outside the region of EIS optical imaging, and were therefore excluded due to telescope time constraints) were carried out in various observing runs during 2002 (see Table 2 for details), with integration times of typically about 5–10 minutes. Again, these observations were taken in two IFs at frequencies of 1385 and 1465 MHz, with a standard bandwidth of 50 MHz.
These CnB array data were reduced in a similar way to the BnA array data, except that in this case, due to the lower angular resolution, 1024 by 1024 pixel maps with 3 arcsec pixels were made to cover the entire primary beam. After cleaning and self–calibration, the CnB array data were combined with the BnA array data, a further cycle of self–calibration was carried out, and final images of the sources were produced using both sets of data. The resultant maps typically have angular resolutions of arcsec, but much greater sensitivity to extended structures that the BnA array data alone.
4.3 The radio maps
Cleaned radio maps of all of the 199 radio sources have been produced. The rms noise levels on each of these maps was calculated by taking the average of five off–source regions, and is provided in Table 2. For those radio sources within the EIS field, contoured radio maps are shown in Appendix A, in Figure 16. These maps have contour levels scaled in factors of 2 from a first contour level of three times the rms noise on the final radio map. The full–width–half–maximum of the Gaussian restoring beam is plotted in the lower left corner of each map. Contour maps of the sources which lie outside of the EIS field are shown in Figure 17, with contour levels defined in the same way. No maps are shown for those sources which are undetected in the radio waveband.
5 Radio Properties of the Sources
5.1 Derived radio source parameters
Source characteristics were derived from the radio maps; details of all of these parameters are provided in Table 3. The aips task sad (Search And Destroy) was used, which fits Gaussian models to an image by a least squares method, and estimates the errors [1997]. In this way, peak flux densities (), integrated component flux densities (), and positions (, ) of all of the source components were estimated. In addition, for resolved sources the total flux density () was calculated by integrating all of the signal in a region surrounding the radio source; for unresolved source the integrated flux density of the single source component was adopted instead.
The source morphologies were divided into five classes: single (S), double (D), triple (T) and multiple (M) component sources, and extended diffuse sources (E). For sources with more than one component, the position angle (PA) and largest angular size () of the radio source were defined as the position angle and the angular separation, respectively, of the two most separated components. For single component sources, where the component is resolved these properties were defined as the position angle and the major axis length of the deconvolved elliptical Gaussian fit to the component. For sources with a single unresolved component, the position angle was not determined, and a 1 upper limit to the largest angular size was derived from the upper limit to the major axis of the deconvolved elliptical Gaussian fit.
5.2 Notes on individual radio sources
EISD7: This source appears double with EISD44 in the NVSS catalogue. The new radio map (Figure 3) indicates that EISD7 is indeed a bright unresolved radio source, close to the position of its entry in the NVSS catalogue. EISD44 is an extended radio source, stretching nearly 2 arcminutes on the sky, and therefore its NVSS catalogue position and flux density are both inaccurate.
EISD15: The weak second radio component, 25 arcsec south-south-east of the central component, is probably unconnected with this source.
EISD16: This source overlaps with sources EISD56 and EISD114, and a source below the 7.5 mJy flux density limit in the NVSS catalogue (Figure 4), and it is not entirely clear from the radio data alone which radio components comprise which distinct sources. Addition of the optical data (see Section 6) clears this up a bit, but not entirely (Figure 4). It is clear that the radio components labelled ‘A’ on the figure correspond to an extended double radio source, associated with EISD16. Component ‘F’ is the weak radio point source seen in the NVSS map, and has an associated optical counterpart. Component ‘D’ also has an optical counterpart, and causes the apparent extension of EISD56. The complication arises with components ‘B’, ‘C’ and ‘E’. These may be simply interpreted as three separate radio sources, of which ‘B’ and ‘E’ correspond to EISD114 and EISD56 respectively, and ‘C’ is a radio point source below the sample limit; this component ‘C’ also has an optical identification. However, the facts that neither component ‘B’ nor ‘E’ has an optical counterpart, that ‘C’ lies almost midway between the two, and that component ‘B’ apears to be slightly extended, pointing towards ‘C’, suggests an alternative explanation whereby these all form one giant radio source with ‘C’ as the core. The lack of extended radio emission between the two in the NVSS map argues against this, and in favour of the three radio source model; in the absence of evidence to the contrary, this simple solution is adopted in the subsequent sample definition. However, deeper radio observations will be required to elucidate exactly which components constitute independent sources.
EISD20: The NVSS entry for EISD20 corresponds to the bright unresolved radio component to the south of the radio map in Figure 16. The further two components to the north appear as a separate NVSS entry, whose flux density is too low to make it into the EIS–NVSS sample. Although it is possible that these three comprise a single extended radio source, the large flux density ratio between the two lobes in this cases, coupled with the unresolved nature of the southern radio component, make this unlikely. More likely, the unresolved component in the south is indeed EISD20, as defined from the NVSS, whilst further north there’s a weak double hosted by the optical counterpart at 09 54 27.8, -21 56 27.
EISD24: The additional two radio components to the south are most likely an unassociated double radio source.
EISD25: In the NVSS catalogue, the sources EISD25 and EISD86 appear separated by less than 10 arcseconds. Figure 5 shows that these two NVSS sources result from a misfit to a single bright source with a faint extension. The BnA array data clearly show that this is a single source, located at the peak of the NVSS flux.
EISD38: The radio structure of this source is very unclear. A narrow double is seen, together with a faint third component 25 arcsec further north. The relationship between these components is unclear. The position angle and largest size of the radio source were derived considering only the southern components.
EISD44: See comment on EISD7.
EISD56: See comment on EISD16
EISD73: EISD73 lies in an extended NVSS structure associated with EISD151 and EISD103. Nearby on the sky, EISD77 is another extended NVSS structure close to the source EISD112. These five radio sources are shown in Figure 6. It is noteworthy that the two extended regions of emission in the NVSS map are both oriented in the same direction, and that for none of these three NVSS sources is any radio counterpart seen in the new CnB or BnA images. Whilst it cannot be stated with 100% confidence that these sources do not represent extended emission, perhaps associated with an FR I radio source, the failure to detect signal even in the CnB array data, and the absence of a bright galaxy which might host such a radio source, both argue against this. Further, the false source EISD118 (see below) is also found nearby, and has similar orientation. These results strongly suggest that the three sources associated with the extended NVSS emission regions (EISD73, 77 and 151) are not real, but instead are caused by correlated noise associated with bad baselines or calibration errors in the NVSS data of that pointing. These three sources are therefore removed from the final catalogue.
EISD77: See comment on EISD73. This source is not real and is therefore removed from the final catalogue.
EISD86: See comment on EISD25. This source is not real and is therefore removed from the final catalogue.
EISD90: See comment on EISD113.
EISD98: The weak second lobe to the north of this source is very diffuse, but is believable because it provides consistency between the observed position and that in the NVSS catalogue. The NVSS catalogue position also coincides almost exactly with the position of a very bright optical galaxy.
EISD103: See comment on EISD73
EISD112: See comment on EISD73
EISD113: The BnA radio map of this source has an odd morphology. This source was also observed off–axis in the CnB observations of EISD7 and 44, although with significant primary beam attenuation. These lower resolution observations confirm the two components extracted here (see Figure 7). However, it is also noticeable that this radio source lies close on the sky to EISD90, and it cannot be excluded that these two form a single extended radio source. The lack of further extended emission between the two and the compact nature of the EISD90 radio source, with a potential optical identification, argue against this. The two sources are therefore considered separately in this paper, although further radio observations will be required to confirm this.
EISD114: See comment on EISD16
EISD118: No radio source was detected. As shown in Figure 8, this NVSS source appears to be just a residual close to the bright sources EISD11 and EISD29, due to calibration and/or cleaning errors. This source also lies close on the sky to the EISD73–77–103–112–151 region, where the problems discussed above under EISD73 are found, further confirming that this source is not real. It is therefore removed from the final catalogue.
EISD124: EISD124 and EISD137 are closely separated sources in the NVSS catalogue, and the new radio maps (Figure 9) show clearly that EISD137 is an unresolved source associated with a bright nearby galaxy, whilst EISD124 stretches over 2.5 arcminutes top to bottom. The northern component of EISD124 is unresolved from EISD137 in the NVSS image, and thus the positions and locations of these two sources are poorly described by their NVSS catalogue entries.
EISD137: See comment on EISD124
EISD151: See comment on EISD73. This source is not real and is therefore removed from the final catalogue.
EISD163: This radio source was only weakly detected in the BnA array observations, suggesting an extended radio source. Because the optical images showed this to be clearly associated with a very nearby galaxy, more detailed CnB radio data were not taken. For clarity, the NVSS contours are used instead of the new BnA array data in the radio–optical overlay.
EISD176: This radio source was undetected in the BnA array observations but, because it lies outside the field of the optical imaging, was not followed up in CnB array observations. It is likely to be a significantly extended radio source.
EISD191: As EISD163.
EISD196: As EISD176.
5.3 Radio source properties
The radio flux densities of the EIS sources as determined in the new radio observations are compared to the values in the NVSS catalogue in Figure 10. To make this comparison, the newly determined flux densities were scaled up by % to account for the small difference between the mean radio frequency of the current observations (1425 MHz) and those of the NVSS (1400 MHz), assuming a typical radio spectral index of (where ). It can be seen that in addition to the scatter in the ratio of the two flux densities, arising from the uncertainties in the two sets of measurements, there is also a tendency for the new observations to determine a lower flux density than suggested by the NVSS.
Sources which are in the brighter half of the sample, so that they are detected at high signal–to–noise in both sets of observations, and which are also unresolved, so that no flux should be lost in the current high resolution observations, are indicated by filled circles in Figure 10. The NVSS flux densities of these are on average 2–3% higher than those of the new observations, which can be attributed to calibration errors between the two different sets of observations. The flux densities scatter by of order 10%, suggesting that the true uncertainties in the flux densities are slightly higher than the formal errors in at least one of the two sets of measurements. For fainter and extended sources (open circles in Figure 10) the average ratio is around 0.8 to 0.85, with larger scatter; Figure 11 demonstrates that the average flux ratio is lower for sources with larger angular sizes, indicating that to at least some extent this difference in flux densities is due to extended emission being resolved out at the higher angular resolution of the new observations. The NVSS flux densities, despite their larger uncertainties, probably give a more accurate guide to the total flux densities of the extended sources.


The distribution of radio source morphologies across the five different morphological classes defined above is indicated in Table 1. Fractionally over half of the sources are classified as single component sources; this proportion rises to 60% for the fainter sources (EISD101 to EISD199), whilst the proportion of triple and multiple sources drops from 16% for the brightest 100 sources to 7% for the fainter half of the sample. This implies that at fainter radio flux density levels, a larger fraction of unresolved radio sources are being picked out.
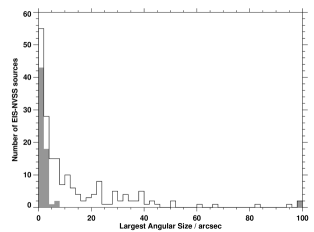
There is a possible concern that this results stems from second faint radio components being missed for fainter radio sources, due to the relatively low signal–to–noise of current the observations; it was shown above that extended emission is often missed, and diffuse emission from an FR I source will also be hard to detect. However, it is already well-known that fainter radio sources tend to have smaller projected angular sizes (cf. Oort et al.1987, Neeser et al.1995), for example, the median projected angular size of the revised 3CR sample ( times brighter in flux density that the current sample) is 43 arcsec, while that of the 6C sample (a factor of fainter than 3CR) is only 14 arcsec [1985b]. The distribution of projected angular sizes of the EIS-NVSS radio sources is provided in Figure 12: the median projected angular size is found to be 6 arcsec, consistent with the above trend. In terms of multi-component nature, less than 10% of the 3CR radio sources would be unresolved at the resolution of the current observations [1983], but in the Hubble Deep Field observations of Richards et al. [1998], which reach about a factor of 100 deeper than the current sample, at least 25 of the 29 sources would be classified as single component sources. The fraction of single component sources observed within the EIS sample, and the trend with radio flux density, are both therefore consistent with these results. This indicates that whilst there is a legitimate concern that a small number of faint radio components may be missed, this should not dramatically bias the properties of the sample as a whole.
| Source structure | Number of sources | ||||
|---|---|---|---|---|---|
| All | EISD1-100 EISD101-199 | ||||
| Single | (S) | 101 | 42 | 59 | |
| Double | (D) | 66 | 39 | 27 | |
| Triple | (T) | 17 | 11 | 6 | |
| Multiple | (M) | 6 | 5 | 1 | |
| Extended | (E) | 2 | 0 | 2 | |
| Undetected/False | 7 | 3 | 4 | ||
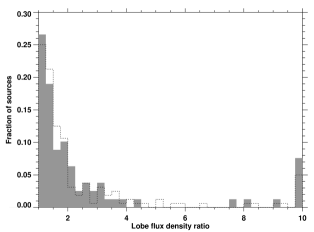
An additional radio feature which is striking in some of the radio sources is the dramatic difference in integrated flux density between the two different lobes of the radio source. In cases such as EISD30 and EISD55, one lobe is more than 20 times brighter than the other. In Figure 13 the flux density ratios of the brighter to the fainter lobe are displayed for those EIS-NVSS sources where the two lobes could be clearly defined; the median flux density ratio is 1.7, with quite a long tail towards large asymmetries. However, this feature is not unique to this sample, nor indeed to lower power radio sources. McCarthy, van Breugel & Kapahi [1991] investigated asymmetries in the 3CR sample, and their results (for radio galaxies and quasars combined) are also shown on Figure 13. Although at a slightly higher radio frequency (5 GHz), which may enhance beaming effects and therefore increase asymmetries fractionally, it is clear that a comparable range of asymmetries are seen in the 3CR sample as in the EIS-NVSS sample. The median flux density ratio of the 3CR samples is slightly smaller, at 1.5, and there are fewer sources with extreme asymmetries, but the differences between the two samples are not statistically significant. It appears that there is little correlation between lobe flux density asymmetries and the flux density of the radio source. A more detailed investigation of this property, and investigation of further radio source asymmetries such as differences in the lobe lengths, and bending angles of the sources, must await the completion of the host galaxy identifications of the sources.
6 Optical counterparts
6.1 Radio–optical overlays
3 by 3 arcminute –band images around each of the radio sources were retrieved from the EIS data archive. These co-added images use the conical equal area projection (COE; e.g. Greisen & Calabretta 2002) around the centre of the EIS Patch D at , , in order to produce equal area pixels with minimal distortion over the large 3 by 2 degree field. The COE projection is not supported by most data reduction packages; it was therefore locally approximated by the standard TAN projection by determining the exact pixel position on the image cut-outs appropriate for the right ascension and declination of the radio source, and adjusting the fits headers so that the TAN projection gave the correct astrometry at this position. However, the TAN projection approximation is only precise at the position of the radio source: the offset between the TAN projection approximation and the true position in these image cut-outs will increase with distance from the radio source, reaching nearly a 1 arcsecond error at radial distances of an arcminute. This is not important since in general only the region at the very centre of the field around the radio source is of interest, and in any case all optical positions were determined directly from the EIS catalogue, where they are precisely calculated from the COE projection.
For all of the true radio sources which are within the EIS field, –band optical overlays are presented on the radio maps in Figure 16.
6.2 Identification likelihood ratios
To investigate possible optical counterparts to the radio sources, a likelihood analysis was carried out on the –band catalogue. This was carried out in two different ways. For single radio component sources, or those in which a clear radio core is visible on the images, a simple likelihood analysis based on the relative positions of the optical galaxies and the radio position was carried out. This likelihood ratio technique (e.g. Richter 1975, de Ruiter et al. 1977) can be used to statistically investigate whether a proposed optical identification is the real counterpart of a radio source, and is summarised in Appendix B. For extended sources with no clear radio core, a modified likelihood analysis was performed to account for the much greater uncertainty in the position of the radio source. In this technique, the distribution of lobe arm–length ratios and lobe bending angles for the 3CR sample (e.g. Best et al. 1995) is used to provide a further prior on the expected host galaxy position, and included in the likelihood analysis; this technique is also described in Appendix B.
Details of the optical host candidates which had a likelihood ratio above the cut-off for each of these two analysis are presented in Table 4. A further two classes of optical candidates were also added to this table. The first of these are very bright host galaxies which were either excluded from the EIS catalogue due to saturation, or were so large that the EIS catalogue position is inaccurate leading to a low likelihood ratio. The second class of added host candidates are optical galaxies which lie directly on top of an unresolved “lobe” of extended radio sources, which would have a likelihood ratio in excess of the cut-off if that radio component were deemed to be the radio core. These were included due to the possibility that this unresolved component is actually the AGN location, and the radio source is either one–sided or a fainter second lobe has been missed in the new radio observations. The selection method by which each optical host candidate is included is noted in the table. In total, 102 of the 150 detected radio sources within the EIS optical imaging field have likely optical identifications. For the remainder, either the true optical host is detected but the radio source is highly asymmetric and the identification falls below the likelihood cut–off threshold, or the host galaxy is too faint to be detected to this optical imaging depth.
For each of the 102 selected optical hosts, the and band catalogues were searched for corresponding matches, and magnitudes of the host galaxies in these bands, where detected, are presented in Table 4. Also presented in that table for each optical host is the ‘stellaricity’ (S/G) of the host galaxy in the –band. This is a parameter measured by SExtractor [1996] to help distinguish between stellar (or quasi–stellar) and extended objects: unresolved objects are assigned a stellaricity value of 1.0, and clearly resolved objects a value of 0.0, with the range of values in between providing a likelihood estimate in uncertain cases.
6.3 Notes on individual optical host galaxies
EISD3: In the EIS –band catalogue the two central objects erroneously appear as a single entry at 09 50 31.32, -21 02 44.4 with a magnitude of 20.15. In the other two bands they appear as two separate objects. The optical position was taken from the –band data, and the –band magnitude was re-determined.
EISD6: Two potential optical counterparts are found to this extended radio source. These have similar likelihood ratios, with the brighter galaxy to the north marginally favoured.
EISD16: Although there is a weak radio feature towards the centre of this radio source, it is not clear if this is a core. A likelihood analysis treating the source as an extended source picks out the unresolved object associated with a radio structure to the north as the most likely optical counterpart.
EISD38: The galaxy lying exactly on the south–eastern radio component is selected as a potential host galaxy.
EISD41: There are two optical objects identified between the radio lobes, but neither achieves a likelihood ratio in excess of the cut-off.
EISD47: This candidate should be considered very tentative, owing to the extremely faint –band magnitude.
EISD60: The faint optical object associated with the western radio component is kept as a potential id.
EISD87: There are many optical galaxies close to the radio position, but none achieves a likelihood ratio above the cut-off value.
EISD91: The two optical objects near the centre of the radio source are blended into a single object in the –band catalogue. In the other two bands they appear as two separate objects. The optical position was taken from the –band data, and the –band magnitude was re-determined.
EISD102: The luminous galaxy coincident with the southern radio component is retained as a likely optical counterpart.
EISD110: Strangely, this bright optical galaxy is not found within the EIS –band catalogue, although it is in the and band catalogues. Its –band magnitude was measured directly from the image.
EISD120: The faint extended emission seen in the –band overlay is not catalogued within the EIS catalogue, but appears convincingly on the image and so its magnitude and position have been determined.
EISD123: This bright saturated galaxy is excluded from the EIS catalogue, but is clearly the optical counterpart to the radio source. The optical image shows it to be part of a merging system, with numerous bright tidal features, including a long tidal tail stretching to the north.
EISD148: The object coincident with the eastern radio component is considered a likely optical id.
EISD155: There is a bright galaxy overlying the northern radio component, which is identified as a likely counterpart.
EISD162: The likely radio source counterpart is a fainter object close to a brighter star. Although clearly distinct, these two objects are not separated in any of the three catalogues. In the –band the position and an estimate of the magnitude of the source were determined from the image.
EISD163: This very bright saturated galaxy is not included in the optical catalogue. Also known as ESO 566-G 014, it has a redshift of 0.01559 in the NASA/IPAC Extragalactic Database (NED). Its magnitudes quoted there are , and .
EISD171: Two plausible optical counterparts are picked out by the likelihood analysis, although in fact there are several –band objects close to the radio lobes, the majority of which (including the two selected candidates) appear to be unresolved. It is not clear whether either of these is really a good candidate.
EISD178: The galaxy close to the south–western radio lobe is retained as a plausible optical host.
EISD181: This candidate should be considered very tentative, owing to the extremely faint –band magnitude.
EISD191: This very bright nearby spiral galaxy has a redshift of in NED, but in the EIS imaging is saturated and excluded from the catalogue. The galaxy is also known as ESO 566-G 018, and has colours from NED of , and .
6.4 The optical hosts
The distribution of –band magnitudes of the galaxies selected as likely optical counterparts to the radio sources is shown in Figure 14. For 48 radio sources, no optical counterpart with a sufficiently high likelihood ratio was found, and so these are not represented on this plot. It is likely that the majority of these lie fainter than the magnitude limit of the EIS observations, but some may be brighter host galaxies which are detected in EIS but do not have sufficiently high likelihood ratios, for example due to highly asymmetric radio sources.
The –band magnitudes can be used to provide a first estimate of the redshift distribution of the radio sources111This method is preferred to using the 3-colour information to obtain photometric redshifts, because on comparison with our existing spectroscopic data (Brookes et al. in preparation) it is found to be more reliable, even when the template models in the photometric redshift estimation are restricted to only passive ellipticals. This is undoubtedly due to the small number of available colours, the fact that apertures are not explicitly matched, and the generally large uncertainties on the B-band magnitudes.. This is because powerful radio sources are invariably hosted by giant elliptical galaxies with a narrow spread of absolute magnitudes, and hence their magnitudes and redshifts are tightly correlated. These correlations show least scatter at near–infrared wavelengths (e.g. the relation; Lilly & Longair 1984)[1984] where the emission is dominated by that of old evolved stars, even at redshifts , and so any on–going low–level star formation or emission associated with the active nucleus have lesser effect.
Magnitude–redshift correlations are also found at optical wavelengths (e.g. Eales 1985c) although these have more scatter, particularly for powerful radio galaxies at high redshifts. This is because powerful radio galaxies with redshift display considerable excess blue emission aligned along their radio axes, due to AGN–related activity or recent star formation (the alignment effect; McCarthy et al. 1987, Chambers et al. 1987). The use of an or relation for 3CR sources beyond that redshift is therefore not appropriate for the EIS–NVSS sources, which are expected to be much more passive because the strength of the alignment effect is strongly correlated with radio power [2003]. Gigahertz–peaked spectrum (GPS) sources, however, show no strong alignment effect, and so their optical magnitude versus redshift relation may provide a good approximation to that of the EIS–NVSS sources. Snellen et al. [1996] find that the relation of GPS radio galaxies can be roughly parameterised as .
Magnitude–redshift relations only hold for the radio galaxies, and so the quasars must be removed from the sample. Table 4 gives the colours of the optical candidates, and an estimate of the star–galaxy classification of these in the –band, using the SExtractor stellaricity estimator provided in the EIS catalogue. This estimator gives a value ranging between 0 (for galaxies) and 1 (for stars). Of the 102 optical counterparts, the 12 with a stellaricity S/G 0.9 were classified as likely quasars, as were the further two objects with stellaricities S/G 0.6 and colours , since distant galaxies are unlikely to have colours this blue (the other objects with 0.6 S/G 0.9 all had colours , so the exact choice of colour cut-off is not critical). Note that this fraction of quasars (%) is much lower than the % found in the brightest radio source samples (e.g. Best et al. 1999), although some fainter quasars may have been misclassified as galaxies if their signal–to–noise is too low to allow good differentiation.
The –magnitudes of the radio galaxy hosts were converted to –magnitudes using the K and evolutionary corrections of Poggianti [1997], for an elliptical galaxy which formed at high redshift with an exponentially decreasing star formation rate of e–folding time of 1 Gyr. These were then used to provide a redshift estimate using the parameterised relation above. Such conversions are undoubtedly uncertain at the magnitude level, but are accurate enough to allow rough redshift estimation and hence a first look at the redshift distribution of the EIS–NVSS sources. The estimated redshift distribution is shown in Figure 15. Again, the 48 sources with no acceptable optical identification are excluded from this plot (as are the quasars for which redshift estimation was not possible). A large proportion of these 48 unidentified sources are likely to have , and hence lie at redshifts . Over a third of the EIS-NVSS sources are therefore estimated to lie at high redshifts, ; spectroscopic measurements are clearly required, but this sample should indeed prove ideal for investigation of the reality of a high redshift decline of the space density of powerful radio sources.


7 The CENSORS sample
7.1 Sample definition
As discussed in Section 3, the flux densities of the sources in the NVSS catalogue have been re-estimated since the original sample was defined. In addition, 44 of the EIS–NVSS radio sources lie outside of the EIS Patch D, five of the NVSS sources within the optical imaging region have been shown to be false, and some extended radio sources extend over more than one NVSS component. These facts require a re–definition of the final sample of radio sources for further study, which hereafter is referred to as the CENSORS sample (A Combined EIS–NVSS Survey Of Radio Sources)222Note that this CENSORS numbering system was not used from the start of this paper, because the EIS–NVSS numbering system is that which corresponds to the VLA radio observations in the archive, and also to the majority of the infrared and spectroscopic follow–up (Brookes et al. in preparation), and hence will be required for archive researchers.
150 of the observed radio sources satisfy the criteria of the CENSORS sample, namely being confirmed radio sources within the EIS imaging area, and the new sample is defined in Table 5, in Appendix C. These sources are ordered in order of decreasing flux density in the latest version (v2.17) of the NVSS catalogue, with adjustments to these values being made for five sources, marked with asterisks, due to their overlap with other NVSS sources: for EISD7 and EISD137, the flux densities of the point sources are accurately determined from the new observations, converted to a 1.400 GHz flux density assuming a spectral index of 0.8, and the NVSS flux density not accounted for in these point sources is assigned to EISD44 and EISD124 respectively. For EISD56 the flux density is calculated excluding the contribution from the nearby point sources. The median 1.4 GHz flux density of the CENSORS sample is mJy.
7.2 Sample Completeness
The revision in the NVSS flux densities means that there is now a tail of sources with low flux densities. Considering the most recent NVSS catalogue, the CENSORS sample includes all of the radio sources brighter than mJy, together with additional fainter sources. Further, only three sources brighter than 6.5 mJy were not targetted in the original EISD radio observations, these being NVSS-J094651-2125 at mJy, NVSS-J095233-2129 at 6.8 mJy and NVSS-J095240-2123 at 6.7 mJy. All three of these sources lie well within the primary beam of the radio observations of a different EIS–NVSS source, and so radio data are available in each case. Their radio–optical overlays are shown in Figure 18, and their properties are included in Table 5 as CENSORS-X1 to X3. Including these three sources in the CENSORS sample makes it complete for all NVSS sources brighter than mJy, with 9 additional sources below this limit.
Another recent development is that Blake & Wall [2002] showed that about 7% of all radio sources are resolved into multiple components by NVSS. This multiple–component effect is seen within the NVSS sources selected in the current sample, as discussed above. However, it is clearly also important to consider whether radio sources which should be above the flux density limit have been excluded from the sample due to being split into different NVSS components, each of which fell below the flux density limit. This was tested in two ways. Firstly the entire NVSS map of the EIS field was eyeballed to search for potential extended sources with more than two NVSS components, or of physical extent in excess of 3 arcminutes. No promising candidates were found (it should be noted that Lara et al. [2001] estimated that only 1 in 10000 NVSS radio sources are larger than 3 arcmins in size, and so in a small field like this, none would be expected). Secondly, using the NVSS catalogue of this region, a search was made for all NVSS source pairs separated by less than 3 arcminutes, where the two NVSS sources were both fainter than 6.5 mJy but the combined flux would put them in to the sample. From the results of Blake & Wall [2002] about 15% of all pairs with 3 arcmin separations are expected to be true double sources, rising to nearly 50% at 2 arcmins, and the vast majority of smaller separation doubles.
Only two NVSS pairs not already included in the sample were found with separations below 2 arcmins. One of these is clearly two distinct radio sources, since one of the sources has a bright optical counterpart. For the other, neither NVSS source has a clear optical counterpart, but one of the NVSS sources appears off-centre in one of the BnA radio maps, and appears unresolved. Also, there is no evidence in the NVSS map for any extension between the sources. Therefore it appears that both of these two pairs are chance alignments. A further 6 NVSS source pairs are found with separations between 2 and 3 arcmins. Three of these can be excluded as doubles on the basis of the radio and optical data; a further two are ambiguous, with no bright optical identifications for either NVSS source, but insufficient positional accuracy to rule out faint counterparts. However, these have no apparent extensions in the NVSS, no obvious bright candidate host galaxy between the two radio lobes (the majority of large angular separation radio sources have relatively low redshifts), and flux density ratios between the two NVSS sources, and so are unlikely to be double radio sources. These source pairs are therefore not considered further. The final NVSS source pair, however, NVSS-J095218-2038 and NVSS-J095223-2041 with flux densities of 3.6 and 3.8mJy and a separation of 2.8 arcmins, provide a promising candidate (cf Figure 18). These sources show extensions in the NVSS indicative of a possible double, have a flux density ratio close to unity, have no obvious optical counterparts individually, but have an galaxy situated roughly midway between them. This pair is therefore provisionally added to the final sample (called CENSORS-D1) as a possible large double.
8 Conclusions
A new sample of radio sources has been defined by combining the NVSS radio survey with the EIS optical observations over a 3 by 2 degree patch of sky. The median radio flux density of these sources is mJy, corresponding to a factor of a few lower flux densities than existing samples of radio sources with complete redshift information. These sources are selected at an ideal flux density limit to carry out a census of the high redshift space density of radio sources, and specifically to investigate the reality of a high redshift cut–off in the radio luminosity function. It is shown that the field studied is large enough that the effects of radio source clustering will not dominate the results.
High resolution VLA radio observations have cleared up ambiguities in the radio selected sample and provided accurate positions and morphologies for these sources. The median radio size of the sources is 6 arcsec, and approximately half of the sources appear as single radio component sources; these results are in line with the trend for lower flux density radio sources to be typically less extended. The lobe flux ratio asymmetries of the sources are comparable to those of the brightest radio sources.
Comparison with the EIS optical imaging has allowed optical counterparts to be identified for over two–thirds of the radio sources. Estimated redshifts for these sources, based upon their optical magnitudes, suggest that over a third of the galaxies lie at redshifts confirming the interest in spectroscopic follow–up of this sample. Infrared imaging to identify the remainder of the sample and the results of spectroscopic follow–up observations will be presented in subsequent papers.
Acknowledgements
PNB would like to thank the Royal Society for generous financial support through its University Research Fellowship scheme. MHB is grateful for the support of a PPARC research studentship. The authors wish to thank the referee, Mark Lacy, for some useful comments. The National Radio Astronomy Observatory is a facility of the National Science Foundation operated under cooperative agreement by Associated Universities, Inc. The observations of the EIS–WIDE survey were carried out using the ESO New Technology Telescope (NTT) at the La Silla observatory under Program-ID Nos. 59.A-9005(A) and 61.A-9005(A); those of WFI Pilot Survey were carried out using the MPG/ESO 2.2m Telescope at the La Silla observatory under Program-ID No. 163.O-0741. This research has made use of the NASA/IPAC Extragalactic Database (NED) which is operated by the Jet Propulsion Laboratory, California Institute of Technology, under contract with NASA.
References
- [1984] Allington-Smith J. R., 1984, MNRAS, 209, 665
- [1977] Baars J. W. M., Genzel R., Pauliny-Toth I. I. K., Witzel A., 1977, A&A, 61, 99
- [1999] Benoist C., da Costa L., Olsen L. F., Deul E., Erben T., Guarnieri M. D., Hook R., Nonino M., Prandoni I., Scodeggio M., Slijkhuis R., Wicenec A., Zaggia S., 1999, A&A, 346, 58
- [1996] Bertin E., Arnouts S., 1996, A&A Supp., 117, 393
- [1995] Best P. N., Bailer D. M., Longair M. S., Riley J. M., 1995, MNRAS, 275, 1171
- [1998] Best P. N., Longair M. S., Röttgering H. J. A., 1998, MNRAS, 295, 549
- [1999] Best P. N., Röttgering H. J. A., Lehnert M. D., 1999, MNRAS, 310, 223
- [2000] Best P. N., Röttgering H. J. A., Lehnert M. D., 2000, MNRAS, 315, 21
- [2002] Blake C., Wall J., 2002, MNRAS, 329, L37
- [1999] Bremer M. N., Rengelink R., Saunders R., Röttgering H. J. A., Miley G. K., Snellen I. A. G., 1999, in Bremer M. N., Jackson N., Pérez–Fournon I., eds, Observational Cosmology with the New Radio Surveys. Kluwer Academic Publishers
- [1987] Chambers K. C., Miley G. K., van Breugel W. J. M., 1987, Nat, 329, 604
- [1997] Condon J. J., 1997, PASP, 109, 166
- [1998] Condon J. J., Cotton W. D., Greisen E. W., Yin Q. F., Perley R. A., Taylor G. B., Broderick J. J., 1998, AJ, 115, 1693
- [2003] Daddi E., Röttgering H. J. A., Labbé I., Rudnick G., Franx M., Moorwood A. F. M., Rix H. W., van der Werf P. P., van Dokkum P. G., 2003, ApJ, 558, 50
- [1977] de Ruiter H. R., Arp H. C., Willis A. G., 1977, A&A Supp., 28, 211
- [1990] Dunlop J. S., Peacock J., 1990, MNRAS, 247, 19
- [1989] Dunlop J. S., Peacock J. A., Savage A., Lilly S. J., Heasley J. N., Simon A. J. B., 1989, MNRAS, 238, 1171
- [1985a] Eales S. A., 1985a, MNRAS, 217, 167
- [1985b] Eales S. A., 1985b, MNRAS, 217, 149
- [1985c] Eales S. A., 1985c, MNRAS, 213, 899
- [1996] Eales S. A., Rawlings S., 1996, ApJ, 460, 68
- [1974] Fanaroff B. L., Riley J. M., 1974, MNRAS, 167, 31P
- [2001] Finn R. A., Impey C. D., Hooper E. J., 2001, ApJ, 557, 578
- [1999] Gavazzi G., Boselli A., 1999, A&A, 343, 86
- [2002] Greisen E. W., Calabretta M. R., 2002, A&A, 395, 1061
- [2002] Inskip K. J., Best P. N., Longair M. S., MacKay D. J. C., 2002, MNRAS, 329, 277
- [2003] Inskip K. J., Best P. N., Longair M. S., Rawlings S., Röttgering H. J. A., Eales S., 2003, MNRAS, submitted
- [2001] Jarvis M. J., Rawlings S., Willott C. J., Blundell K. M., Eales S., Lacy M., 2001, MNRAS, 327, 907
- [2001] Kormendy J., Gebhardt K., 2001, p. 363
- [1993] Lacy M., Hill G., Kaiser M. E., Rawlings S., 1993, MNRAS, 263, 707
- [1983] Laing R. A., Riley J. M., Longair M. S., 1983, MNRAS, 204, 151
- [2001] Lara L., Cotton W. D., Feretti L., Giovannini G., Marcaide J. M., Marquez I., Venturi T., 2001, A&A, 370, 409
- [1984] Lilly S. J., Longair M. S., 1984, MNRAS, 211, 833
- [2000] Machalski J., Godlowski W., 2000, A&A, 360, 463
- [1996] McCarthy P. J., Kapahi V. K., van Breugel W., Persson S. E., Athreya R. M., Subrahmanya C. R., 1996, ApJ Supp., 107, 19
- [1991] McCarthy P. J., van Breugel W. J. M., Kapahi V. K., 1991, ApJ, 371, 478
- [1987] McCarthy P. J., van Breugel W. J. M., Spinrad H., Djorgovski S., 1987, ApJ, 321, L29
- [1999] Mobasher B., Cram L., Georgakakis A., Hopkins A., 1999, MNRAS, 308, 45
- [1995] Neeser M. J., Eales S. A., Law–Green J. D., Leahy J. P., Rawlings S., 1995, ApJ, 451, 76
- [1999] Nonino M., Bertin E., da Costa L., Deul E., Erben T., Olsen L., Prandoni I., Scodeggio M., Wicenec A., Wichmann R., Benoist C., Freudling W., Guarnieri M. D., Hook I., Hook R., Mendez R., Savaglio S., Silva D., Slijkhuis R., 1999, A&A Supp., 137, 51
- [1987] Oort M. J. A., Katgert P., Windhorst R. A., 1987, Nat, 328, 500
- [2003] Overzier R. A., Röttgering H. J. A., Rengelink R. B., Wilman R., 2003, A&A, in press, astro-ph/0304160
- [1985] Peacock J. A., 1985, MNRAS, 217, 601
- [1997] Poggianti B. M., 1997, A&A Supp., 122, 399
- [1998] Pooley D. M., Waldrum E. M., Riley J. M., 1998, MNRAS, 298, 637
- [2002] Porciani C., Giavalisco M., 2002, ApJ, 565, 24
- [1988] Prestage R. M., Peacock J. A., 1988, MNRAS, 230, 131
- [2001] Rawlings S., Eales S. A., Lacy M., 2001, MNRAS, 322, 523
- [1998] Rengelink R. B., 1998, Ph.D. thesis, Sterrewacht, University of Leiden
- [1998] Richards E. A., Kellermann K. I., Formalont E. B., Windhorst R. A., Partridge R. B., 1998, AJ, 116, 1039
- [1998] Richstone D., 1998, Nat, 395, 138
- [1975] Richter G. A., 1975, Astronomische Nachrichten, 295, 65
- [2002] Sadler E. M. et al. 2002, MNRAS, 329, 227
- [2001] Snellen I. A. G., Best P. N., 2001, MNRAS, 328, 897
- [1996] Snellen I. A. G., Bremer M. N., Schilizzi R. T., Miley G. K., van Ojik R., 1996, MNRAS, 279, 1294
- [1977] Soneira R. M., Peebles P. J. E., 1977, ApJ, 211, 1
- [1978] Soneira R. M., Peebles P. J. E., 1978, AJ, 83, 845
- [1985] Spinrad H., Djorgovski S., Marr J., Aguilar L. A., 1985, PASP, 97, 932
- [2001] Waddington I., Dunlop J. S., Peacock J. A., Windhorst R. A., 2001, MNRAS, 328, 882
- [1997] Wall J. V., Jackson C. A., 1997, MNRAS, 290, L22
- [1985] Wall J. V., Peacock J. A., 1985, MNRAS, 216, 173
- [1998] Willott C. J., Rawlings S., Blundell K. M., Lacy M., 1998, MNRAS, 300, 625
- [2001] Willott C. J., Rawlings S., Blundell K. M., Lacy M., Eales S. A., 2001, MNRAS, 322, 536
- [2002] Willott C. J., Rawlings S., Blundell K. M., Lacy M., Hill G., Scott S. E., 2002, MNRAS, 335, 1120
- [2003] Willott C. J., Rawlings S., Jarvis M. J., Blundell K. M., 2003, MNRAS, in press; astro-ph/0209439
- [2000] Wold M., Lacy M., Lilje P. B., Serjeant S., 2000, MNRAS, 316, 267
- [2002] Woo J.-H., Urry C. M., 2002, ApJ, 581, L5
Appendix A Properties of the Radio Sources
In this appendix, properties of the radio sources are provided. Table 2 provides details of the original EIS–NVSS sample of radio sources, and the observations of these. Radio maps of those sources which are located within the region of optical imaging of the EIS survey are shown in Figure 16, overlaid upon greyscale images taken from the –band EIS data. Radio maps of those which lie outside of the EIS Patch D are shown in Figure 17. Table 3 provides the properties of the radio source components, as derived from these new radio maps.
| Source | IAU Name | RA (NVSS) Dec | Observation Date | rms | |||
|---|---|---|---|---|---|---|---|
| (J2000) | [mJy] | BnA array | CnB array | [Jy] | |||
| EISD1 | NVSS-J095129-2050 | 09 51 29.17 | -20 50 28.6 | 659.5 19.8 | 15/06/1998 | — | 65 |
| EISD2 | NVSS-J094650-2020 | 09 46 50.28 | -20 20 44.1 | 452.3 13.6 | 15/06/1998 | — | 58 |
| EISD3 | NVSS-J095031-2102 | 09 50 31.40 | -21 02 43.0 | 355.3 10.7 | 15/06/1998 | — | 49 |
| EISD4 | NVSS-J094905-1957 | 09 49 05.67 | -19 57 10.6 | 302.1 10.0 | 15/06/1998 | — | 35 |
| EISD5 | NVSS-J095953-2148 | 09 59 53.89 | -21 48 47.7 | 299.6 10.5 | 15/06/1998 | — | 47 |
| EISD6 | NVSS-J094953-2156 | 09 49 53.57 | -21 56 17.4 | 283.0 9.5 | 15/06/1998 | — | 33 |
| EISD7 | NVSS-J095143-2123 | 09 51 43.69 | -21 23 56.4 | 246.2 7.4 | 15/06/1998 | 30/04/2001 | 32 |
| EISD8 | NVSS-J095344-2135 | 09 53 44.01 | -21 35 51.7 | 244.7 8.2 | 15/06/1998 | — | 34 |
| EISD9 | NVSS-J095812-2144 | 09 58 12.96 | -21 44 41.0 | 196.9 5.9 | 15/06/1998 | — | 48 |
| EISD10 | NVSS-J094557-2116 | 09 45 57.05 | -21 16 48.2 | 148.2 5.1 | 15/06/1998 | — | 42 |
| EISD11 | NVSS-J095730-2130 | 09 57 30.00 | -21 30 58.2 | 126.3 3.8 | 15/06/1998 | — | 44 |
| EISD12 | NVSS-J094935-2156 | 09 49 35.38 | -21 56 23.2 | 118.2 3.6 | 15/06/1998 | — | 40 |
| EISD13 | NVSS-J094427-2116 | 09 44 27.26 | -21 16 10.8 | 100.8 3.1 | 15/06/1998 | — | 48 |
| EISD14 | NVSS-J095951-2053 | 09 59 51.08 | -20 53 18.9 | 87.2 2.7 | 15/06/1998 | — | 38 |
| EISD15 | NVSS-J095329-2002 | 09 53 29.54 | -20 02 13.0 | 78.1 2.4 | 15/06/1998 | — | 40 |
| EISD16 | NVSS-J094727-2126 | 09 47 27.03 | -21 26 21.0 | 79.4 2.9 | 15/06/1998 | 30/04/2001 | 28 |
| EISD17 | NVSS-J094433-2105 | 09 44 33.17 | -21 05 07.2 | 73.9 2.3 | 15/06/1998 | — | 45 |
| EISD18 | NVSS-J094641-2029 | 09 46 41.16 | -20 29 26.0 | 70.4 2.6 | 15/06/1998 | — | 47 |
| EISD19 | NVSS-J094508-2038 | 09 45 08.44 | -20 38 07.9 | 69.1 2.1 | 15/06/1998 | — | 42 |
| EISD20 | NVSS-J095428-2156 | 09 54 28.91 | -21 56 53.6 | 66.3 2.7 | 15/06/1998 | — | 29 |
| EISD21 | NVSS-J095447-2059 | 09 54 47.70 | -20 59 43.4 | 65.6 2.4 | 15/06/1998 | — | 43 |
| EISD22 | NVSS-J094651-2053 | 09 46 51.17 | -20 53 17.5 | 63.0 1.9 | 15/06/1998 | — | 35 |
| EISD23 | NVSS-J095751-2133 | 09 57 51.31 | -21 33 21.5 | 61.7 2.3 | 15/06/1998 | — | 60 |
| EISD24 | NVSS-J095242-1958 | 09 52 42.99 | -19 58 20.0 | 61.5 2.3 | 15/06/1998 | — | 32 |
| EISD25 | NVSS-J095513-2123 | 09 55 13.61 | -21 23 03.2 | 58.3 1.8 | 15/06/1998 | — | 32 |
| EISD26 | NVSS-J095904-2008 | 09 59 04.87 | -20 08 05.0 | 57.7 2.2 | 15/06/1998 | — | 37 |
| EISD27 | NVSS-J095330-2135 | 09 53 30.49 | -21 35 58.9 | 55.1 2.1 | 15/06/1998 | — | 46 |
| EISD28 | NVSS-J094758-2121 | 09 47 58.99 | -21 21 50.6 | 54.0 1.7 | 15/06/1998 | — | 41 |
| EISD29 | NVSS-J095730-2132 | 09 57 30.82 | -21 32 37.7 | 52.9 1.7 | 15/06/1998 | — | 32 |
| EISD30 | NVSS-J094604-2115 | 09 46 04.78 | -21 15 08.8 | 54.2 2.1 | 15/06/1998 | — | 36 |
| EISD31 | NVSS-J095629-2001 | 09 56 29.93 | -20 01 30.5 | 52.4 2.0 | 15/06/1998 | — | 32 |
| EISD32 | NVSS-J095438-2104 | 09 54 38.38 | -21 04 25.3 | 51.0 1.6 | 15/06/1998 | — | 46 |
| EISD33 | NVSS-J095433-2205 | 09 54 33.72 | -22 05 22.2 | 50.1 1.9 | 15/06/1998 | — | 40 |
| EISD34 | NVSS-J094804-2147 | 09 48 04.06 | -21 47 36.5 | 49.2 1.9 | 15/06/1998 | — | 33 |
| EISD35 | NVSS-J095902-2039 | 09 59 02.43 | -20 39 45.7 | 47.0 2.1 | 15/06/1998 | — | 42 |
| EISD36 | NVSS-J095217-2008 | 09 52 17.76 | -20 08 35.3 | 44.4 1.4 | 15/06/1998 | — | 29 |
| EISD37 | NVSS-J095825-2044 | 09 58 25.97 | -20 44 51.3 | 42.5 1.4 | 15/06/1998 | — | 31 |
| EISD38 | NVSS-J094631-2026 | 09 46 31.42 | -20 26 10.2 | 40.1 1.9 | 15/06/1998 | — | 46 |
| EISD39 | NVSS-J094815-2140 | 09 48 15.71 | -21 40 05.1 | 38.2 1.6 | 15/06/1998 | — | 36 |
| EISD40 | NVSS-J094556-2028 | 09 45 56.53 | -20 28 31.3 | 37.8 2.0 | 15/06/1998 | 30/04/2001 | 35 |
| EISD41 | NVSS-J094519-2142 | 09 45 19.62 | -21 42 39.5 | 37.3 1.5 | 15/06/1998 | — | 45 |
| EISD42 | NVSS-J095827-2105 | 09 58 27.40 | -21 05 26.5 | 36.0 1.2 | 15/06/1998 | — | 35 |
| EISD43 | NVSS-J095141-2011 | 09 51 41.06 | -20 11 17.9 | 35.3 1.5 | 15/06/1998 | — | 25 |
| EISD44 | NVSS-J095150-2125 | 09 51 50.39 | -21 25 14.4 | 33.9 2.3 | 15/06/1998 | 30/04/2001 | 22 |
| EISD45 | NVSS-J095304-2044 | 09 53 04.75 | -20 44 09.6 | 34.3 1.1 | 15/06/1998 | — | 33 |
| EISD46 | NVSS-J094455-2017 | 09 44 55.53 | -20 17 14.6 | 34.3 1.4 | 15/06/1998 | — | 45 |
| EISD47 | NVSS-J094753-2147 | 09 47 53.64 | -21 47 19.2 | 34.2 1.1 | 15/06/1998 | — | 34 |
| EISD48 | NVSS-J095452-2119 | 09 54 52.43 | -21 19 28.8 | 34.1 1.4 | 15/06/1998 | — | 34 |
| EISD49 | NVSS-J095925-2006 | 09 59 25.82 | -20 06 40.3 | 32.9 2.0 | 15/06/1998 | — | 39 |
| EISD50 | NVSS-J095724-2203 | 09 57 24.19 | -22 03 52.6 | 33.1 1.1 | 15/06/1998 | — | 44 |
| EISD51 | NVSS-J094933-2127 | 09 49 33.26 | -21 27 07.7 | 32.3 1.1 | 15/06/1998 | — | 29 |
| EISD52 | NVSS-J094919-2151 | 09 49 19.33 | -21 51 35.4 | 31.8 1.4 | 15/06/1998 | — | 35 |
| EISD53 | NVSS-J095116-2056 | 09 51 16.85 | -20 56 35.2 | 31.7 1.1 | 15/06/1998 | — | 50 |
| EISD54 | NVSS-J094836-2106 | 09 48 36.08 | -21 06 23.0 | 31.5 1.1 | 15/06/1998 | — | 32 |
| EISD55 | NVSS-J095058-2114 | 09 50 58.79 | -21 14 18.8 | 30.9 1.3 | 15/06/1998 | — | 35 |
| EISD56 | NVSS-J094728-2128 | 09 47 28.89 | -21 28 35.8 | 28.5 2.9 | 15/06/1998 | 30/04/2001 | 28 |
| EISD57 | NVSS-J095816-2018 | 09 58 16.61 | -20 18 54.3 | 29.6 1.3 | 15/06/1998 | — | 42 |
| EISD58 | NVSS-J094918-2054 | 09 49 18.12 | -20 54 52.5 | 27.5 1.7 | 15/06/1998 | — | 45 |
| EISD59 | NVSS-J094453-2046 | 09 44 53.65 | -20 46 35.9 | 28.6 1.0 | 15/06/1998 | — | 39 |
| EISD60 | NVSS-J095201-2115 | 09 52 01.84 | -21 15 50.7 | 26.5 0.9 | 15/06/1998 | — | 29 |
| EISD61 | NVSS-J095940-2034 | 09 59 40.85 | -20 34 48.3 | 26.3 1.2 | 15/06/1998 | — | 40 |
| Source | IAU Name | RA (NVSS) Dec | Observation Date | rms | |||
|---|---|---|---|---|---|---|---|
| (J2000) | [mJy] | BnA array | CnB array | [Jy] | |||
| EISD62 | NVSS-J095427-2029 | 09 54 27.08 | -20 29 46.7 | 26.1 0.9 | 15/06/1998 | — | 28 |
| EISD63 | NVSS-J094703-2050 | 09 47 03.48 | -20 50 02.0 | 25.2 0.9 | 15/06/1998 | — | 33 |
| EISD64 | NVSS-J095259-2148 | 09 52 59.24 | -21 48 41.4 | 26.4 0.9 | 15/06/1998 | — | 34 |
| EISD65 | NVSS-J095403-2025 | 09 54 03.09 | -20 25 13.3 | 25.2 0.9 | 15/06/1998 | — | 31 |
| EISD66 | NVSS-J095743-2006 | 09 57 43.07 | -20 06 36.1 | 25.5 1.2 | 15/06/1998 | — | 46 |
| EISD67 | NVSS-J095323-2013 | 09 53 23.15 | -20 13 43.6 | 23.8 0.9 | 15/06/1998 | — | 26 |
| EISD68 | NVSS-J095428-2039 | 09 54 28.16 | -20 39 28.2 | 24.2 0.9 | 15/06/1998 | — | 46 |
| EISD69 | NVSS-J095212-2102 | 09 52 12.79 | -21 02 36.2 | 22.3 0.8 | 15/06/1998 | — | 36 |
| EISD70 | NVSS-J095130-2204 | 09 51 30.71 | -22 04 27.7 | 22.3 1.1 | 15/06/1998 | — | 30 |
| EISD71 | NVSS-J094930-2023 | 09 49 30.68 | -20 23 33.4 | 21.4 0.8 | 15/06/1998 | — | 27 |
| EISD72 | NVSS-J094542-2115 | 09 45 42.59 | -21 15 42.3 | 21.7 0.8 | 15/06/1998 | — | 41 |
| EISD73 | NVSS-J095546-2126 | 09 55 46.10 | -21 26 55.6 | 18.9 3.3 | 15/06/1998 | 30/04/2001 | 20 |
| EISD74 | NVSS-J095320-2143 | 09 53 20.62 | -21 43 58.7 | 21.4 0.8 | 15/06/1998 | — | 53 |
| EISD75 | NVSS-J095122-2151 | 09 51 22.83 | -21 51 52.0 | 21.7 0.8 | 15/06/1998 | — | 32 |
| EISD76 | NVSS-J095132-2100 | 09 51 32.53 | -21 00 27.2 | 21.6 1.1 | 15/06/1998 | — | 36 |
| EISD77 | NVSS-J095523-2128 | 09 55 23.78 | -21 28 30.5 | 19.6 2.3 | 15/06/1998 | 30/04/2001 | 18 |
| EISD78 | NVSS-J095043-2126 | 09 50 43.23 | -21 26 37.6 | 20.8 1.1 | 15/06/1998 | — | 34 |
| EISD79 | NVSS-J094855-2103 | 09 48 55.29 | -21 03 57.4 | 20.7 0.8 | 15/06/1998 | — | 29 |
| EISD80 | NVSS-J095121-2129 | 09 51 21.17 | -21 29 54.6 | 20.7 1.1 | 15/06/1998 | — | 36 |
| EISD81 | NVSS-J094842-2152 | 09 48 42.34 | -21 52 26.1 | 19.1 1.1 | 15/06/1998 | — | 34 |
| EISD82 | NVSS-J094801-2009 | 09 48 01.89 | -20 09 11.7 | 18.5 0.7 | 15/06/1998 | — | 37 |
| EISD83 | NVSS-J095148-2031 | 09 51 48.71 | -20 31 53.4 | 18.9 0.7 | 15/06/1998 | — | 28 |
| EISD84 | NVSS-J094945-2150 | 09 49 45.77 | -21 50 04.8 | 18.4 0.7 | 15/06/1998 | — | 35 |
| EISD85 | NVSS-J094859-2050 | 09 48 59.96 | -20 50 07.9 | 18.1 1.0 | 15/06/1998 | 09/06/2002 | 27 |
| EISD86 | NVSS-J095512-2123 | 09 55 12.44 | -21 23 09.6 | 15.3 3.3 | 15/06/1998 | — | 33 |
| EISD87 | NVSS-J095726-2013 | 09 57 26.12 | -20 13 04.3 | 17.9 1.0 | 15/06/1998 | — | 28 |
| EISD88 | NVSS-J094529-2118 | 09 45 29.43 | -21 18 48.8 | 18.3 0.7 | 15/06/1998 | — | 49 |
| EISD89 | NVSS-J095731-2120 | 09 57 31.82 | -21 20 25.4 | 17.3 0.7 | 15/06/1998 | — | 52 |
| EISD90 | NVSS-J095046-2132 | 09 50 46.78 | -21 32 51.1 | 17.4 1.1 | 15/06/1998 | — | 29 |
| EISD91 | NVSS-J095451-2130 | 09 54 51.94 | -21 30 17.5 | 17.2 0.7 | 15/06/1998 | — | 28 |
| EISD92 | NVSS-J095602-2156 | 09 56 02.35 | -21 56 02.9 | 17.0 0.7 | 15/06/1998 | — | 29 |
| EISD93 | NVSS-J095541-2039 | 09 55 41.86 | -20 39 39.3 | 16.7 0.7 | 15/06/1998 | — | 37 |
| EISD94 | NVSS-J095628-2048 | 09 56 28.15 | -20 48 44.5 | 16.2 0.7 | 15/06/1998 | — | 40 |
| EISD95 | NVSS-J094428-2038 | 09 44 28.80 | -20 38 00.3 | 16.2 1.0 | 15/06/1998 | — | 43 |
| EISD96 | NVSS-J094929-2129 | 09 49 29.71 | -21 29 38.8 | 16.0 0.7 | 15/06/1998 | — | 28 |
| EISD97 | NVSS-J094925-2037 | 09 49 25.95 | -20 37 24.5 | 16.5 0.7 | 15/06/1998 | — | 30 |
| EISD98 | NVSS-J094526-2033 | 09 45 26.88 | -20 33 52.8 | 15.7 1.0 | 15/06/1998 | — | 43 |
| EISD99 | NVSS-J094446-2050 | 09 44 46.39 | -20 50 00.8 | 15.7 1.1 | 15/06/1998 | — | 45 |
| EISD100 | NVSS-J095843-2051 | 09 58 43.82 | -20 51 30.1 | 15.4 0.7 | 15/06/1998 | — | 35 |
| EISD101 | NVSS-J095844-2031 | 09 58 44.74 | -20 31 15.0 | 14.8 0.7 | 15/06/1998 | — | 27 |
| EISD102 | NVSS-J095746-2123 | 09 57 46.01 | -21 23 26.5 | 15.3 0.7 | 15/06/1998 | — | 37 |
| EISD103 | NVSS-J095545-2125 | 09 55 45.86 | -21 25 27.0 | 13.5 1.2 | 15/06/1998 | 30/04/2001 | 20 |
| EISD104 | NVSS-J094942-2037 | 09 49 42.89 | -20 37 44.5 | 15.0 0.7 | 15/06/1998 | — | 31 |
| EISD105 | NVSS-J095416-2129 | 09 54 16.90 | -21 29 12.4 | 14.5 1.4 | 19/06/1998 | 30/04/2001 | 40 |
| EISD106 | NVSS-J094548-2159 | 09 45 48.34 | -21 59 08.6 | 14.6 1.1 | 15/06/1998 | — | 43 |
| EISD107 | NVSS-J095559-2042 | 09 55 59.27 | -20 42 53.2 | 14.6 0.7 | 15/06/1998 | — | 26 |
| EISD108 | NVSS-J095741-1955 | 09 57 41.91 | -19 55 57.0 | 14.2 1.0 | 15/06/1998 | — | 25 |
| EISD109 | NVSS-J094447-2058 | 09 44 47.38 | -20 58 14.7 | 14.0 0.6 | 15/06/1998 | — | 42 |
| EISD110 | NVSS-J095453-2115 | 09 54 53.16 | -21 15 12.3 | 14.5 0.6 | 15/06/1998 | — | 32 |
| EISD111 | NVSS-J094556-2120 | 09 45 56.28 | -21 20 48.9 | 13.2 0.6 | 15/06/1998 | 30/04/2001 | 15 |
| EISD112 | NVSS-J095523-2130 | 09 55 23.96 | -21 30 02.9 | 13.4 1.0 | 15/06/1998 | 30/04/2001 | 18 |
| EISD113 | NVSS-J095053-2133 | 09 50 53.40 | -21 33 01.4 | 13.6 0.6 | 15/06/1998 | — | 37 |
| EISD114 | NVSS-J094734-2126 | 09 47 34.67 | -21 26 58.5 | 12.8 0.6 | 15/06/1998 | 30/04/2001 | 28 |
| EISD115 | NVSS-J094445-2146 | 09 44 45.29 | -21 46 21.0 | 13.4 0.6 | 15/06/1998 | — | 36 |
| EISD116 | NVSS-J095129-2016 | 09 51 29.60 | -20 16 41.5 | 13.5 0.6 | 15/06/1998 | — | 28 |
| EISD117 | NVSS-J095309-2001 | 09 53 09.44 | -20 01 22.3 | 13.0 1.0 | 15/06/1998 | — | 37 |
| EISD118 | NVSS-J095724-2129 | 09 57 24.26 | -21 29 43.3 | 10.6 1.9 | 15/06/1998 | — | 35 |
| EISD119 | NVSS-J094520-2201 | 09 45 20.94 | -22 01 18.1 | 13.1 0.6 | 15/06/1998 | — | 43 |
| EISD120 | NVSS-J094804-2034 | 09 48 04.23 | -20 34 35.9 | 13.2 0.6 | 15/06/1998 | — | 33 |
| EISD121 | NVSS-J095456-2205 | 09 54 56.93 | -22 05 05.8 | 10.8 1.6 | 15/06/1998 | — | 27 |
| EISD122 | NVSS-J095255-2052 | 09 52 55.86 | -20 52 07.0 | 12.6 1.1 | 15/06/1998 | 30/04/2001 | 18 |
| EISD123 | NVSS-J095421-2148 | 09 54 21.85 | -21 48 04.1 | 12.2 1.2 | 15/06/1998 | — | 37 |
| EISD124 | NVSS-J094810-2001 | 09 48 10.05 | -20 01 58.1 | 12.1 1.4 | 15/06/1998 | 30/04/2001 | 18 |
| Source | IAU Name | RA (NVSS) Dec | Observation Date | rms | |||
|---|---|---|---|---|---|---|---|
| (J2000) | [mJy] | BnA array | CnB array | [Jy] | |||
| EISD125 | NVSS-J094521-2043 | 09 45 21.17 | -20 43 18.3 | 12.2 0.6 | 15/06/1998 | — | 42 |
| EISD126 | NVSS-J095436-2144 | 09 54 36.25 | -21 44 37.9 | 12.0 1.2 | 15/06/1998 | — | 42 |
| EISD127 | NVSS-J094822-2105 | 09 48 22.17 | -21 05 08.4 | 12.7 0.6 | 15/06/1998 | — | 36 |
| EISD128 | NVSS-J095816-2058 | 09 58 16.47 | -20 58 23.7 | 10.5 1.3 | 15/06/1998 | — | 32 |
| EISD129 | NVSS-J095620-2203 | 09 56 20.42 | -22 03 47.7 | 11.3 0.6 | 15/06/1998 | — | 40 |
| EISD130 | NVSS-J094935-2158 | 09 49 35.26 | -21 58 08.4 | 11.8 0.6 | 15/06/1998 | — | 42 |
| EISD131 | NVSS-J094925-2005 | 09 49 25.83 | -20 05 18.4 | 12.0 0.6 | 15/06/1998 | — | 36 |
| EISD132 | NVSS-J094618-2037 | 09 46 18.92 | -20 37 58.4 | 12.2 0.6 | 15/06/1998 | — | 44 |
| EISD133 | NVSS-J095702-2156 | 09 57 02.06 | -21 56 50.7 | 11.6 0.6 | 15/06/1998 | — | 33 |
| EISD134 | NVSS-J094649-2116 | 09 46 49.75 | -21 16 47.0 | 11.1 1.1 | 15/06/1998 | 30/04/2001 | 13 |
| EISD135 | NVSS-J095851-2110 | 09 58 51.31 | -21 10 20.4 | 11.4 1.1 | 15/06/1998 | — | 38 |
| EISD136 | NVSS-J095048-2154 | 09 50 48.49 | -21 54 55.0 | 11.5 0.6 | 15/06/1998 | — | 40 |
| EISD137 | NVSS-J094813-1959 | 09 48 13.10 | -19 59 54.7 | 10.0 1.2 | 15/06/1998 | 30/04/2001 | 18 |
| EISD138 | NVSS-J094724-2105 | 09 47 24.55 | -21 05 05.6 | 10.6 0.6 | 15/06/1998 | — | 39 |
| EISD139 | NVSS-J095250-2131 | 09 52 50.33 | -21 31 47.3 | 11.4 0.6 | 15/06/1998 | — | 39 |
| EISD140 | NVSS-J095933-2114 | 09 59 33.68 | -21 14 50.8 | 8.9 1.6 | 15/06/1998 | — | 40 |
| EISD141 | NVSS-J095511-2030 | 09 55 11.87 | -20 30 20.6 | 10.1 1.3 | 15/06/1998 | 30/04/2001 | 25 |
| EISD142 | NVSS-J095607-2005 | 09 56 07.01 | -20 05 40.6 | 10.5 0.6 | 15/06/1998 | — | 36 |
| EISD143 | NVSS-J095735-2029 | 09 57 35.04 | -20 29 31.7 | 9.6 0.6 | 15/06/1998 | — | 36 |
| EISD144 | NVSS-J094450-2017 | 09 44 50.70 | -20 17 35.2 | 10.5 0.6 | 15/06/1998 | — | 60 |
| EISD145 | NVSS-J095739-2003 | 09 57 39.46 | -20 03 18.5 | 10.7 0.6 | 15/06/1998 | — | 28 |
| EISD146 | NVSS-J095642-2119 | 09 56 42.22 | -21 19 41.8 | 9.8 0.6 | 15/06/1998 | — | 39 |
| EISD147 | NVSS-J095857-2034 | 09 58 57.31 | -20 34 19.2 | 8.1 1.3 | 15/06/1998 | — | 38 |
| EISD148 | NVSS-J094538-2111 | 09 45 38.34 | -21 11 12.1 | 10.3 1.0 | 15/06/1998 | 09/06/2002 | 30 |
| EISD149 | NVSS-J094744-2112 | 09 47 44.72 | -21 12 29.8 | 10.0 0.6 | 15/06/1998 | — | 48 |
| EISD150 | NVSS-J094710-2035 | 09 47 10.23 | -20 35 53.0 | 9.7 0.6 | 15/06/1998 | — | 53 |
| EISD151 | NVSS-J095553-2127 | 09 55 53.71 | -21 27 12.1 | 4.5 0.8 | 15/06/1998 | 30/04/2001 | 20 |
| EISD152 | NVSS-J095927-2003 | 09 59 27.65 | -20 03 14.8 | 9.7 0.6 | 15/06/1998 | — | 43 |
| EISD153 | NVSS-J095649-2035 | 09 56 49.68 | -20 35 23.9 | 10.2 0.6 | 15/06/1998 | — | 36 |
| EISD154 | NVSS-J095210-2050 | 09 52 10.86 | -20 50 08.2 | 10.1 0.6 | 15/06/1998 | — | 52 |
| EISD155 | NVSS-J095724-2022 | 09 57 24.53 | -20 22 36.3 | 9.6 1.0 | 15/06/1998 | — | 37 |
| EISD156 | NVSS-J095637-2019 | 09 56 37.01 | -20 19 02.6 | 9.0 0.6 | 15/06/1998 | — | 37 |
| EISD157 | NVSS-J094902-2115 | 09 49 02.13 | -21 15 04.7 | 9.4 0.6 | 15/06/1998 | — | 42 |
| EISD158 | NVSS-J094443-2144 | 09 44 43.88 | -21 44 38.5 | 9.3 0.6 | 15/06/1998 | — | 60 |
| EISD159 | NVSS-J095357-2036 | 09 53 57.45 | -20 36 52.0 | 9.1 0.6 | 15/06/1998 | — | 34 |
| EISD160 | NVSS-J095849-2117 | 09 58 49.60 | -21 17 35.5 | 8.8 0.6 | 19/06/1998 | — | 29 |
| EISD161 | NVSS-J094748-2048 | 09 47 48.46 | -20 48 35.7 | 9.4 0.6 | 15/06/1998 | — | 39 |
| EISD162 | NVSS-J095638-2010 | 09 56 38.86 | -20 10 44.1 | 4.1 0.8 | 19/06/1998 | 09/06/2002 | 30 |
| EISD163 | NVSS-J094910-2021 | 09 49 10.67 | -20 21 52.5 | 8.7 0.6 | 19/06/1998 | — | 33 |
| EISD164 | NVSS-J095201-2024 | 09 52 01.26 | -20 24 54.0 | 9.0 0.5 | 19/06/1998 | — | 39 |
| EISD165 | NVSS-J095410-2158 | 09 54 10.47 | -21 58 00.6 | 9.5 0.6 | 19/06/1998 | — | 45 |
| EISD166 | NVSS-J095604-2144 | 09 56 04.41 | -21 44 36.3 | 9.6 0.6 | 19/06/1998 | — | 41 |
| EISD167 | NVSS-J094602-2151 | 09 46 02.57 | -21 51 40.4 | 7.9 0.6 | 19/06/1998 | — | 20 |
| EISD168 | NVSS-J094450-2007 | 09 44 50.35 | -20 07 35.5 | 8.4 0.6 | 19/06/1998 | — | 48 |
| EISD169 | NVSS-J095148-2133 | 09 51 48.92 | -21 33 37.2 | 8.2 0.6 | 19/06/1998 | — | 58 |
| EISD170 | NVSS-J095226-2001 | 09 52 26.52 | -20 01 05.2 | 8.3 0.6 | 19/06/1998 | — | 46 |
| EISD171 | NVSS-J094750-2142 | 09 47 50.04 | -21 42 17.2 | 8.4 1.3 | 19/06/1998 | — | 43 |
| EISD172 | NVSS-J095722-2101 | 09 57 22.22 | -21 01 03.4 | 8.2 0.5 | 19/06/1998 | — | 35 |
| EISD173 | NVSS-J095431-2035 | 09 54 31.12 | -20 35 40.0 | 8.7 0.5 | 19/06/1998 | — | 40 |
| EISD174 | NVSS-J094902-2016 | 09 49 02.62 | -20 16 09.8 | 8.3 0.5 | 19/06/1998 | — | 46 |
| EISD175 | NVSS-J094922-2118 | 09 49 22.34 | -21 18 19.5 | 8.4 0.5 | 19/06/1998 | — | 45 |
| EISD176 | NVSS-J095820-2139 | 09 58 20.40 | -21 39 13.3 | 7.5 1.2 | 19/06/1998 | — | 58 |
| EISD177 | NVSS-J095527-2046 | 09 55 27.05 | -20 46 07.9 | 7.1 0.6 | 19/06/1998 | — | 43 |
| EISD178 | NVSS-J094748-2100 | 09 47 48.27 | -21 00 44.9 | 7.8 0.6 | 19/06/1998 | — | 37 |
| EISD179 | NVSS-J094959-2127 | 09 49 59.68 | -21 27 19.0 | 6.0 0.6 | 19/06/1998 | — | 48 |
| EISD180 | NVSS-J094912-2200 | 09 49 12.22 | -22 00 29.2 | 6.9 0.6 | 19/06/1998 | — | 53 |
| EISD181 | NVSS-J095441-2049 | 09 54 41.98 | -20 49 47.1 | 7.5 0.6 | 19/06/1998 | — | 33 |
| EISD182 | NVSS-J094949-2134 | 09 49 49.04 | -21 34 32.8 | 7.8 0.6 | 19/06/1998 | — | 40 |
| EISD183 | NVSS-J095129-2025 | 09 51 29.20 | -20 25 40.9 | 7.8 1.2 | 19/06/1998 | 30/04/2001 | 14 |
| EISD184 | NVSS-J094507-2109 | 09 45 07.57 | -21 09 28.0 | 6.4 0.6 | 19/06/1998 | — | 52 |
| EISD185 | NVSS-J095212-2140 | 09 52 12.69 | -21 40 27.6 | 4.0 0.7 | 19/06/1998 | 30/04/2001 | 18 |
| EISD186 | NVSS-J094924-2111 | 09 49 24.70 | -21 11 10.0 | 8.3 0.5 | 19/06/1998 | — | 52 |
| EISD187 | NVSS-J095038-2141 | 09 50 38.48 | -21 41 15.1 | 7.4 1.2 | 19/06/1998 | 30/04/2001 | 23 |
| Source | IAU Name | RA (NVSS) Dec | Observation Date | rms | |||
|---|---|---|---|---|---|---|---|
| (J2000) | [mJy] | BnA array | CnB array | [Jy] | |||
| EISD188 | NVSS-J094746-2127 | 09 47 46.11 | -21 27 44.3 | 6.1 0.6 | 19/06/1998 | — | 47 |
| EISD189 | NVSS-J094552-2014 | 09 45 52.01 | -20 14 41.8 | 6.6 0.6 | 19/06/1998 | — | 60 |
| EISD190 | NVSS-J095937-2038 | 09 59 37.53 | -20 38 21.9 | 7.4 0.5 | 19/06/1998 | — | 44 |
| EISD191 | NVSS-J095027-2148 | 09 50 27.69 | -21 48 09.2 | 5.4 0.6 | 19/06/1998 | — | 41 |
| EISD192 | NVSS-J095912-2012 | 09 59 12.27 | -20 12 54.4 | 5.4 0.6 | 19/06/1998 | — | 49 |
| EISD193 | NVSS-J095056-1955 | 09 50 56.59 | -19 55 08.3 | 5.9 0.6 | 19/06/1998 | — | 36 |
| EISD194 | NVSS-J094527-2057 | 09 45 27.50 | -20 57 47.8 | 3.8 0.7 | 19/06/1998 | 30/04/2001 | 17 |
| EISD195 | NVSS-J095715-2030 | 09 57 15.62 | -20 30 34.0 | 6.3 0.6 | 19/06/1998 | — | 42 |
| EISD196 | NVSS-J095002-2205 | 09 50 02.94 | -22 05 34.9 | 5.1 0.6 | 19/06/1998 | — | 57 |
| EISD197 | NVSS-J094522-2036 | 09 45 22.09 | -20 36 12.9 | 4.2 0.7 | 19/06/1998 | — | 57 |
| EISD198 | NVSS-J095850-2108 | 09 58 50.83 | -21 08 14.9 | 6.1 0.6 | 19/06/1998 | — | 43 |
| EISD199 | NVSS-J094526-2154 | 09 45 26.51 | -21 54 57.3 | 6.8 0.5 | 19/06/1998 | — | 43 |
| Name | Morph. | PA | (J2000) | (J2000) | Notes | ||||||
|---|---|---|---|---|---|---|---|---|---|---|---|
| (mJy) | ( ) | ( ) | (mJy/bm) | (mJy) | (h m s) | () | (h m s) | () | |||
| EISD1 | D | 634.9 1.2 | 113 | 5.0 | 392.3 | 434.4 0.3 | 09 51 29.00 | 20 50 29.7 | 09 51 29.07 | 20 50 30.1 | |
| 162.9 | 196.7 0.3 | 09 51 29.33 | 20 50 31.7 | ||||||||
| EISD2 | S | 434.7 1.3 | 132 | 0.9 | 427.0 | 432.2 0.4 | 09 46 50.21 | 20 20 44.4 | 09 46 50.21 | 20 20 44.4 | |
| EISD3 | S | 348.7 1.2 | 130 | 0.7 | 340.0 | 346.4 0.4 | 09 50 31.39 | 21 02 44.8 | 09 50 31.39 | 21 02 44.8 | |
| EISD4 | M | 221.1 2.5 | 130 | 38.4 | 28.1 | 34.5 0.2 | 09 49 04.82 | 19 56 58.5 | 09 49 05.81 | 19 57 11.2 | |
| 6.7 | 119.8 2.5 | 09 49 05.43 | 19 57 07.7 | ||||||||
| 24.2 | 24.1 0.2 | 09 49 05.81 | 19 57 11.2 | ||||||||
| 52.3 | 57.1 0.2 | 09 49 06.91 | 19 57 23.0 | ||||||||
| EISD5 | T | 262.8 2.0 | 148 | 14.8 | 51.2 | 118.6 0.4 | 09 59 53.73 | 21 48 42.5 | 09 59 53.99 | 21 48 48.3 | |
| 20.8 | 75.8 0.3 | 09 59 54.12 | 21 48 51.4 | ||||||||
| 52.2 | 68.1 0.2 | 09 59 54.30 | 21 48 55.1 | ||||||||
| EISD6 | T | 230.9 2.1 | 57 | 29.5 | 49.3 | 60.7 0.2 | 09 49 52.46 | 21 56 28.9 | 09 49 53.60 | 21 56 18.4 | |
| 10.2 | 24.5 0.3 | 09 49 52.79 | 21 56 24.1 | ||||||||
| 82.3 | 146.7 0.5 | 09 49 54.24 | 21 56 12.9 | ||||||||
| EISD7 | S | 236.2 1.3 | 53 | 1.8 | 196.9 | 230.5 0.4 | 09 51 43.63 | 21 23 58.0 | 09 51 43.63 | 21 23 58.0 | N |
| EISD8 | T | 235.3 2.1 | 145 | 31.7 | 154.0 | 164.6 0.4 | 09 53 43.67 | 21 35 44.5 | 09 53 44.42 | 21 36 02.5 | |
| 0.4 | 0.4 0.1 | 09 53 44.42 | 21 36 02.5 | ||||||||
| 58.0 | 63.5 0.2 | 09 53 44.96 | 21 36 10.6 | ||||||||
| EISD9 | D | 189.5 1.3 | 179 | 8.1 | 56.7 | 86.8 0.3 | 09 58 13.08 | 21 44 38.7 | 09 58 13.08 | 21 44 43.0 | |
| 56.5 | 99.4 0.3 | 09 58 13.09 | 21 44 46.8 | ||||||||
| EISD10 | M | 114.7 2.7 | 41 | 32.2 | 5.6 | 25.9 0.7 | 09 45 55.97 | 21 17 06.3 | 09 45 56.71 | 21 16 54.4 | |
| 3.3 | 3.4 0.2 | 09 45 56.71 | 21 16 54.4 | ||||||||
| 27.1 | 30.5 0.3 | 09 45 57.14 | 21 16 48.2 | ||||||||
| 24.2 | 47.6 0.3 | 09 45 57.48 | 21 16 41.9 | ||||||||
| EISD11 | S | 143.5 1.2 | 61 | 5.8 | 91.7 | 141.6 0.5 | 09 57 30.07 | 21 30 59.8 | 09 57 30.07 | 21 30 59.8 | |
| EISD12 | S | 109.0 0.3 | 0.6 | 108.2 | 109.0 0.3 | 09 49 35.43 | 21 56 23.5 | 09 49 35.43 | 21 56 23.5 | ||
| EISD13 | S | 87.9 1.4 | 105 | 2.0 | 73.4 | 83.8 0.2 | 09 44 27.14 | 21 16 11.0 | 09 44 27.14 | 21 16 11.0 | |
| EISD14 | D | 80.8 1.0 | 121 | 3.3 | 35.4 | 39.4 0.2 | 09 59 51.06 | 20 53 19.0 | 09 59 51.16 | 20 53 19.9 | |
| 39.8 | 42.6 0.2 | 09 59 51.26 | 20 53 20.7 | ||||||||
| EISD15 | S | 101.1 0.4 | 0.6 | 100.4 | 101.1 0.2 | 09 53 29.51 | 20 02 12.5 | 09 53 29.51 | 20 02 12.5 | N | |
| EISD16 | T | 78.2 2.1 | 176 | 66.5 | 2.9 | 13.6 0.4 | 09 47 26.86 | 21 26 25.1 | 09 47 26.99 | 21 26 22.6 | N |
| 33.9 | 51.2 0.3 | 09 47 26.98 | 21 26 16.7 | ||||||||
| 2.6 | 7.9 0.3 | 09 47 27.32 | 21 27 21.7 | ||||||||
| EISD17 | S | 79.2 0.4 | 121 | 1.3 | 78.0 | 79.2 0.2 | 09 44 33.14 | 21 05 08.0 | 09 44 33.14 | 21 05 08.0 | |
| EISD18 | S | 66.8 1.5 | 73 | 1.8 | 51.7 | 61.6 0.2 | 09 46 41.13 | 20 29 27.3 | 09 46 41.13 | 20 29 27.3 | |
| EISD19 | S | 58.8 1.0 | 85 | 2.4 | 46.7 | 59.5 0.2 | 09 45 08.38 | 20 38 09.1 | 09 45 08.38 | 20 38 09.1 | |
| EISD20 | S/T | 53.2 2.3 | 152 | 2.1/41.3 | 39.5 | 50.8 0.3 | 09 54 28.97 | 21 56 55.0 | 09 54 28.97 | 21 56 55.0 | N |
| 0.6 | 0.6 0.1 | 09 54 28.09 | 21 56 34.0 | ||||||||
| 1.5 | 1.6 0.1 | 09 54 27.58 | 21 56 17.7 | ||||||||
| EISD21 | D | 57.9 1.2 | 22 | 10.0 | 17.5 | 27.8 0.3 | 09 54 47.52 | 20 59 48.6 | 09 54 47.66 | 20 59 43.8 | |
| 20.6 | 30.4 0.2 | 09 54 47.79 | 20 59 39.4 | ||||||||
| EISD22 | D | 60.7 1.1 | 43 | 6.1 | 19.1 | 20.6 0.2 | 09 46 50.92 | 20 53 20.7 | 09 46 51.12 | 20 53 17.8 | |
| 38.3 | 39.6 0.2 | 09 46 51.22 | 20 53 16.2 | ||||||||
| EISD23 | D | 54.7 1.7 | 140 | 13.1 | 12.4 | 18.4 0.2 | 09 57 51.08 | 21 33 18.6 | 09 57 51.42 | 21 33 24.2 | |
| 12.4 | 23.2 0.3 | 09 57 51.68 | 21 33 28.6 | ||||||||
| EISD24 | D | 47.5 1.7 | 143 | 11.2 | 19.4 | 24.1 0.3 | 09 52 42.74 | 19 58 16.5 | 09 52 42.95 | 19 58 20.4 | N |
| 15.1 | 19.0 0.3 | 09 52 43.22 | 19 58 25.4 | ||||||||
| EISD25 | S | 59.3 0.8 | 34 | 0.8 | 55.1 | 56.8 0.3 | 09 55 13.60 | 21 23 03.1 | 09 55 13.60 | 21 23 03.1 | N |
| EISD26 | D | 55.6 2.2 | 57 | 39.9 | 1.8 | 2.1 0.2 | 09 59 02.60 | 20 08 27.2 | 09 59 04.88 | 20 08 06.6 | |
| 41.7 | 48.5 0.2 | 09 59 04.98 | 20 08 05.7 | ||||||||
| EISD27 | M | 51.7 1.6 | 11 | 23.9 | 3.7 | 8.6 0.5 | 09 53 30.40 | 21 36 11.4 | 09 53 30.69 | 21 35 50.0 | |
| 4.0 | 10.1 0.4 | 09 53 30.44 | 21 36 05.0 | ||||||||
| 3.9 | 7.0 0.5 | 09 53 30.48 | 21 35 52.6 | ||||||||
| 2.4 | 17.1 0.8 | 09 53 30.74 | 21 35 47.9 | ||||||||
| EISD28 | S | 50.8 0.4 | 1.0 | 50.6 | 50.8 0.2 | 09 47 58.94 | 21 21 50.9 | 09 47 58.94 | 21 21 50.9 | ||
| EISD29 | D | 59.6 1.1 | 3 | 4.6 | 29.5 | 31.6 0.2 | 09 57 30.92 | 21 32 41.6 | 09 57 30.92 | 21 32 39.5 | |
| 23.6 | 27.1 0.2 | 09 57 30.93 | 21 32 37.0 | ||||||||
| EISD30 | D | 44.0 0.6 | 163 | 7.1 | 41.5 | 43.2 0.3 | 09 46 04.74 | 21 15 10.7 | 09 46 04.75 | 21 15 11.4 | |
| 0.9 | 0.8 0.1 | 09 46 04.58 | 21 15 04.0 | ||||||||
| Name | Morph. | PA | (J2000) | (J2000) | Notes | ||||||
|---|---|---|---|---|---|---|---|---|---|---|---|
| (mJy) | ( ) | ( ) | (mJy/bm) | (mJy) | (h m s) | () | (h m s) | () | |||
| EISD31 | D | 44.5 1.2 | 11 | 21.7 | 21.5 | 27.4 0.4 | 09 56 29.90 | 20 01 39.0 | 09 56 30.01 | 20 01 31.0 | |
| 9.5 | 16.4 0.5 | 09 56 30.19 | 20 01 17.7 | ||||||||
| EISD32 | S | 48.2 0.8 | 143 | 1.4 | 43.1 | 48.4 0.3 | 09 54 38.33 | 21 04 25.1 | 09 54 38.33 | 21 04 25.1 | |
| EISD33 | D | 46.0 1.7 | 5 | 37.0 | 6.0 | 15.2 0.5 | 09 54 33.58 | 22 05 43.1 | 09 54 33.70 | 22 05 22.3 | |
| 7.0 | 19.6 0.6 | 09 54 33.79 | 22 05 06.2 | ||||||||
| EISD34 | S | 41.2 0.3 | 0.7 | 40.6 | 41.2 0.3 | 09 48 04.05 | 21 47 36.8 | 09 48 04.05 | 21 47 36.8 | ||
| EISD35 | D | 29.8 2.3 | 131 | 29.3 | 9.6 | 15.7 0.5 | 09 59 02.22 | 20 39 53.6 | 09 59 02.35 | 20 39 51.0 | |
| 0.4 | 1.5 0.5 | 09 59 03.50 | 20 39 31.0 | ||||||||
| EISD36 | S | 38.7 0.9 | 82 | 2.1 | 34.8 | 39.3 0.4 | 09 52 17.69 | 20 08 36.2 | 09 52 17.69 | 20 08 36.2 | |
| EISD37 | S | 36.5 0.4 | 0.8 | 36.5 | 36.5 0.4 | 09 58 26.09 | 20 44 52.7 | 09 58 26.09 | 20 44 52.7 | ||
| EISD38 | T | 35.0 2.8 | 115 | 17.6 | 7.7 | 15.7 0.7 | 09 46 30.97 | 20 26 07.6 | 09 46 31.32 | 20 26 07.2 | N |
| 2.5 | 2.6 0.2 | 09 46 31.51 | 20 25 46.4 | ||||||||
| 5.0 | 6.3 0.3 | 09 46 32.11 | 20 26 14.9 | ||||||||
| EISD39 | M | 32.5 1.7 | 157 | 27.6 | 3.5 | 9.8 0.4 | 09 48 15.54 | 21 39 55.8 | 09 48 15.71 | 21 40 06.3 | |
| 10.6 | 11.4 0.4 | 09 48 15.71 | 21 40 06.3 | ||||||||
| 1.1 | 3.1 0.4 | 09 48 15.80 | 21 40 15.9 | ||||||||
| 0.3 | 1.1 0.3 | 09 48 16.32 | 21 40 21.2 | ||||||||
| EISD40 | T | 23.8 1.4 | 154 | 50.1 | 3.2 | 11.8 0.4 | 09 45 55.77 | 20 28 13.1 | 09 45 55.86 | 20 28 30.2 | |
| 1.9 | 4.3 0.4 | 09 45 55.86 | 20 28 30.2 | ||||||||
| 2.1 | 7.3 0.2 | 09 45 57.29 | 20 28 58.4 | ||||||||
| EISD41 | D | 28.6 1.3 | 1 | 28.5 | 13.9 | 17.6 0.3 | 09 45 19.59 | 21 42 50.7 | 09 45 19.60 | 21 42 43.8 | |
| 4.7 | 5.7 0.3 | 09 45 19.62 | 21 42 22.2 | ||||||||
| EISD42 | S | 38.6 1.0 | 24 | 0.6 | 35.5 | 36.4 0.2 | 09 58 27.58 | 21 05 27.5 | 09 58 27.58 | 21 05 27.5 | |
| EISD43 | D | 21.2 1.5 | 100 | 36.3 | 4.5 | 5.9 0.4 | 09 51 39.63 | 20 11 15.1 | 09 51 41.02 | 20 11 18.4 | |
| 4.5 | 8.5 0.4 | 09 51 42.17 | 20 11 21.2 | ||||||||
| EISD44 | M | 18.8 1.7 | 146 | 115.2 | 2.3 | 3.1 0.2 | 09 51 46.97 | 21 24 01.9 | 09 51 49.78 | 21 24 57.7 | N |
| 0.7 | 1.2 0.1 | 09 51 47.21 | 21 24 16.4 | ||||||||
| 0.4 | 0.5 0.1 | 09 51 49.78 | 21 24 57.7 | ||||||||
| 1.2 | 6.4 0.3 | 09 51 50.02 | 21 25 25.2 | ||||||||
| 2.9 | 4.6 0.2 | 09 51 51.60 | 21 25 37.1 | ||||||||
| EISD45 | D | 33.6 1.4 | 144 | 23.2 | 21.4 | 24.6 0.3 | 09 53 04.59 | 20 44 07.5 | 09 53 04.71 | 20 44 09.8 | |
| 1.5 | 3.5 0.5 | 09 53 05.56 | 20 44 26.2 | ||||||||
| EISD46 | D | 30.3 1.2 | 105 | 6.7 | 9.2 | 11.7 0.3 | 09 44 55.10 | 20 17 12.0 | 09 44 55.38 | 20 17 13.1 | |
| 11.9 | 17.9 0.4 | 09 44 55.56 | 20 17 13.7 | ||||||||
| EISD47 | S | 27.4 0.4 | 0.9 | 27.3 | 27.4 0.4 | 09 47 53.55 | 21 47 19.6 | 09 47 53.55 | 21 47 19.6 | ||
| EISD48 | D | 23.9 1.2 | 64 | 12.2 | 6.6 | 11.7 0.5 | 09 54 52.06 | 21 19 31.5 | 09 54 52.43 | 21 19 29.0 | |
| 5.5 | 10.7 0.5 | 09 54 52.85 | 21 19 26.3 | ||||||||
| EISD49 | D | 31.9 2.9 | 55 | 61.3 | 1.8 | 12.3 1.4 | 09 59 24.16 | 20 06 57.9 | 09 59 24.91 | 20 06 50.4 | |
| 1.7 | 3.3 0.5 | 09 59 27.73 | 20 06 22.8 | ||||||||
| EISD50 | S | 34.3 0.3 | 0.7 | 34.4 | 34.3 0.3 | 09 57 24.17 | 22 03 53.4 | 09 57 24.17 | 22 03 53.4 | ||
| EISD51 | S | 34.0 1.0 | 113 | 0.7 | 31.6 | 32.7 0.3 | 09 49 33.23 | 21 27 08.3 | 09 49 33.23 | 21 27 08.3 | |
| EISD52 | T | 26.5 1.3 | 90 | 21.3 | 6.2 | 11.0 0.5 | 09 49 18.76 | 21 51 35.6 | 09 49 19.44 | 21 51 35.4 | |
| 3.3 | 6.0 0.5 | 09 49 19.75 | 21 51 35.0 | ||||||||
| 5.5 | 6.6 0.4 | 09 49 20.29 | 21 51 35.6 | ||||||||
| EISD53 | S | 32.6 1.0 | 70 | 3.4 | 21.3 | 30.8 0.5 | 09 51 16.77 | 20 56 38.4 | 09 51 16.77 | 20 56 38.4 | |
| EISD54 | D | 25.1 1.0 | 50 | 6.4 | 8.5 | 9.8 0.3 | 09 48 35.79 | 21 06 25.0 | 09 48 35.99 | 21 06 22.6 | |
| 11.7 | 13.2 0.4 | 09 48 36.14 | 21 06 20.9 | ||||||||
| EISD55 | D | 23.5 0.5 | 134 | 11.3 | 22.0 | 22.9 0.3 | 09 50 58.61 | 21 14 19.8 | 09 50 58.63 | 21 14 20.3 | |
| 0.4 | 0.4 0.1 | 09 50 59.19 | 21 14 27.7 | ||||||||
| EISD56 | D | 10.5 0.8 | 174 | 12.6 | 3.4 | 6.4 0.4 | 09 47 28.10 | 21 28 53.3 | 09 47 28.14 | 21 28 57.9 | N |
| 2.6 | 3.9 0.2 | 09 47 28.21 | 21 29 05.8 | ||||||||
| EISD57 | S | 25.5 1.6 | 49 | 23.5 | 19.8 | 20.3 0.4 | 09 58 16.61 | 20 18 59.2 | 09 58 16.61 | 20 18 59.2 | |
| EISD58 | T | 26.8 1.9 | 163 | 42.2 | 2.1 | 6.7 0.7 | 09 49 17.95 | 20 54 30.4 | 09 49 18.18 | 20 54 45.4 | |
| 1.6 | 8.1 1.1 | 09 49 18.18 | 20 54 45.4 | ||||||||
| 1.6 | 2.1 0.2 | 09 49 18.86 | 20 55 10.7 | ||||||||
| EISD59 | S | 26.7 0.4 | 1.2 | 26.8 | 26.7 0.4 | 09 44 53.53 | 20 46 37.3 | 09 44 53.53 | 20 46 37.3 | ||
| EISD60 | D | 24.6 1.2 | 74 | 18.2 | 8.0 | 10.1 0.3 | 09 52 01.58 | 21 15 53.6 | 09 52 01.86 | 21 15 52.3 | |
| 6.3 | 10.1 0.4 | 09 52 02.14 | 21 15 50.9 | ||||||||
| EISD61 | D | 6.0 0.7 | 126 | 38.1 | 0.7 | 0.9 0.2 | 09 59 38.41 | 20 34 22.6 | 09 59 40.04 | 20 34 38.7 | |
| 2.3 | 2.8 0.3 | 09 59 40.56 | 20 34 44.5 | ||||||||
| EISD62 | S | 31.1 0.3 | 1.1 | 30.2 | 31.1 0.3 | 09 54 27.06 | 20 29 46.5 | 09 54 27.06 | 20 29 46.5 | ||
| EISD63 | D | 19.1 1.1 | 118 | 9.0 | 3.5 | 10.6 0.6 | 09 47 03.06 | 20 50 00.3 | 09 47 03.32 | 20 50 02.2 | |
| 4.2 | 8.7 0.6 | 09 47 03.63 | 20 50 04.5 | ||||||||
| Name | Morph. | PA | (J2000) | (J2000) | Notes | ||||||
|---|---|---|---|---|---|---|---|---|---|---|---|
| (mJy) | ( ) | ( ) | (mJy/bm) | (mJy) | (h m s) | () | (h m s) | () | |||
| EISD64 | D | 18.3 1.0 | 153 | 5.7 | 8.5 | 10.9 0.4 | 09 52 59.10 | 21 48 40.3 | 09 52 59.17 | 21 48 42.4 | |
| 5.8 | 7.4 0.4 | 09 52 59.28 | 21 48 45.4 | ||||||||
| EISD65 | S | 21.2 0.3 | 1.1 | 21.0 | 21.2 0.3 | 09 54 03.02 | 20 25 13.2 | 09 54 03.02 | 20 25 13.2 | ||
| EISD66 | S | 23.6 1.0 | 161 | 6.2 | 7.6 | 23.1 0.5 | 09 57 42.91 | 20 06 36.1 | 09 57 42.91 | 20 06 36.1 | |
| EISD67 | S | 26.0 0.3 | 1.0 | 25.5 | 26.0 0.3 | 09 53 23.18 | 20 13 43.5 | 09 53 23.18 | 20 13 43.5 | ||
| EISD68 | S | 24.2 1.1 | 7 | 1.4 | 17.7 | 19.9 0.4 | 09 54 28.28 | 20 39 26.6 | 09 54 28.28 | 20 39 26.6 | |
| EISD69 | D | 19.4 1.0 | 104 | 5.0 | 6.9 | 7.5 0.4 | 09 52 12.50 | 21 02 35.6 | 09 52 12.71 | 21 02 36.3 | |
| 8.7 | 10.8 0.3 | 09 52 12.85 | 21 02 36.8 | ||||||||
| EISD70 | D | 19.0 1.7 | 108 | 35.3 | 2.1 | 2.3 0.2 | 09 51 28.36 | 22 04 18.4 | 09 51 30.48 | 22 04 28.1 | |
| 16.9 | 17.7 0.3 | 09 51 30.77 | 22 04 29.4 | ||||||||
| EISD71 | D | 16.6 1.0 | 72 | 14.0 | 8.1 | 9.9 0.4 | 09 49 30.24 | 20 23 35.8 | 09 49 30.56 | 20 23 34.2 | |
| 1.9 | 5.2 0.8 | 09 49 31.18 | 20 23 31.3 | ||||||||
| EISD72 | S | 23.4 0.3 | 1.2 | 24.0 | 23.4 0.3 | 09 45 42.64 | 21 15 44.9 | 09 45 42.64 | 21 15 44.9 | ||
| EISD73 | 09 55 46.10 | 21 26 55.6 | N | ||||||||
| EISD74 | S | 15.9 0.6 | 2.3 | 13.8 | 15.9 0.6 | 09 53 20.56 | 21 43 59.2 | 09 53 20.56 | 21 43 59.2 | ||
| EISD75 | D | 17.4 0.9 | 29 | 5.8 | 15.8 | 15.6 0.3 | 09 51 22.87 | 21 51 55.5 | 09 51 22.89 | 21 51 55.1 | |
| 1.7 | 1.2 0.3 | 09 51 23.08 | 21 51 50.4 | ||||||||
| EISD76 | D | 24.6 1.7 | 69 | 10.9 | 6.2 | 8.8 0.4 | 09 51 32.02 | 21 00 31.6 | 09 51 32.40 | 21 00 29.6 | |
| 4.3 | 9.4 0.5 | 09 51 32.74 | 21 00 27.7 | ||||||||
| EISD77 | 09 55 23.78 | 21 28 30.5 | N | ||||||||
| EISD78 | D | 20.2 1.3 | 13 | 20.4 | 4.4 | 9.3 0.5 | 09 50 43.08 | 21 26 47.8 | 09 50 43.20 | 21 26 40.7 | |
| 3.8 | 5.2 0.4 | 09 50 43.41 | 21 26 27.9 | ||||||||
| EISD79 | S | 18.6 0.4 | 1.7 | 16.9 | 18.6 0.4 | 09 48 55.25 | 21 03 55.6 | 09 48 55.25 | 21 03 55.6 | ||
| EISD80 | D | 13.3 1.6 | 26 | 22.5 | 4.4 | 8.4 0.5 | 09 51 20.69 | 21 30 04.7 | 09 51 21.02 | 21 29 55.4 | |
| 3.8 | 7.1 0.5 | 09 51 21.40 | 21 29 44.5 | ||||||||
| EISD81 | T | 4.3 1.1 | 21 | 33.1 | 0.9 | 1.2 0.1 | 09 48 42.09 | 21 52 39.5 | 09 48 42.44 | 21 52 24.8 | |
| 0.5 | 0.6 0.1 | 09 48 42.44 | 21 52 24.8 | ||||||||
| 0.3 | 0.6 0.1 | 09 48 42.94 | 21 52 08.7 | ||||||||
| EISD82 | D | 9.5 1.3 | 114 | 21.3 | 5.8 | 6.3 0.2 | 09 48 01.25 | 20 09 07.6 | 09 48 01.87 | 20 09 11.4 | |
| 3.9 | 5.0 0.3 | 09 48 02.64 | 20 09 16.2 | ||||||||
| EISD83 | S | 17.8 0.3 | 0.8 | 17.6 | 17.8 0.3 | 09 51 48.66 | 20 31 52.9 | 09 51 48.66 | 20 31 52.9 | ||
| EISD84 | D | 14.8 1.3 | 97 | 17.7 | 3.6 | 9.4 0.5 | 09 49 45.24 | 21 50 05.4 | 09 49 45.67 | 21 50 06.2 | |
| 3.0 | 4.8 0.5 | 09 49 46.50 | 21 50 07.7 | ||||||||
| EISD85 | S | 11.9 0.7 | 179 | 6.5 | 6.2 | 11.9 0.2 | 09 48 59.78 | 20 50 08.5 | 09 48 59.78 | 20 50 08.5 | |
| EISD86 | 09 55 12.44 | 21 23 09.6 | N | ||||||||
| EISD87 | S | 14.7 1.4 | 62 | 7.3 | 7.9 | 14.4 0.8 | 09 57 26.04 | 20 13 05.7 | 09 57 26.04 | 20 13 05.7 | |
| EISD88 | D | 12.3 1.1 | 169 | 6.3 | 5.1 | 9.8 0.2 | 09 45 29.50 | 21 18 49.7 | 09 45 29.51 | 21 18 50.5 | |
| 0.9 | 1.2 0.3 | 09 45 29.58 | 21 18 55.9 | ||||||||
| EISD89 | T | 16.6 1.6 | 77 | 38.8 | 1.6 | 7.2 0.5 | 09 57 31.17 | 21 20 29.7 | 09 57 31.87 | 21 20 26.7 | |
| 1.9 | 6.6 0.4 | 09 57 32.41 | 21 20 25.6 | ||||||||
| 0.9 | 1.2 0.1 | 09 57 33.54 | 21 20 17.1 | ||||||||
| EISD90 | S | 17.4 1.7 | 75 | 7.1 | 4.4 | 12.9 1.0 | 09 50 46.38 | 21 32 55.1 | 09 50 46.38 | 21 32 55.1 | |
| EISD91 | S | 13.9 0.3 | 0.9 | 13.7 | 13.9 0.2 | 09 54 51.96 | 21 30 16.1 | 09 54 51.96 | 21 30 16.1 | ||
| EISD92 | S | 15.7 0.3 | 1.4 | 15.0 | 15.7 0.2 | 09 56 02.36 | 21 56 04.2 | 09 56 02.36 | 21 56 04.2 | ||
| EISD93 | S | 12.7 0.3 | 3.5 | 10.2 | 12.7 0.2 | 09 55 41.89 | 20 39 39.2 | 09 55 41.89 | 20 39 39.2 | ||
| EISD94 | T | 22.3 1.2 | 153 | 15.8 | 4.7 | 6.0 0.3 | 09 56 27.88 | 20 48 37.9 | 09 56 28.10 | 20 48 45.3 | |
| 0.4 | 0.4 0.1 | 09 56 28.10 | 20 48 45.3 | ||||||||
| 7.4 | 11.1 0.4 | 09 56 28.38 | 20 48 52.1 | ||||||||
| EISD95 | D | 15.6 1.5 | 42 | 23.9 | 9.5 | 10.1 0.3 | 09 44 28.62 | 20 38 04.3 | 09 44 28.90 | 20 37 59.9 | |
| 2.4 | 3.4 0.2 | 09 44 29.74 | 20 37 46.5 | ||||||||
| EISD96 | S | 15.7 1.2 | 66 | 2.5 | 9.4 | 13.1 0.4 | 09 49 29.75 | 21 29 38.6 | 09 49 29.75 | 21 29 38.6 | |
| EISD97 | S | 19.1 0.3 | 0.7 | 18.9 | 19.1 0.3 | 09 49 25.99 | 20 37 24.2 | 09 49 25.99 | 20 37 24.2 | ||
| EISD98 | D | 10.4 1.2 | 148 | 10.9 | 0.6 | 3.1 0.6 | 09 45 26.76 | 20 33 51.5 | 09 45 26.97 | 20 33 55.0 | N |
| 2.4 | 3.3 0.3 | 09 45 27.17 | 20 33 57.7 | ||||||||
| EISD99 | D | 10.7 1.8 | 119 | 12.3 | 3.4 | 5.3 0.3 | 09 44 46.45 | 20 49 57.4 | 09 44 46.77 | 20 49 59.9 | |
| 3.1 | 3.6 0.2 | 09 44 47.22 | 20 50 03.4 | ||||||||
| EISD100 | S | 11.6 0.3 | 1.8 | 10.6 | 11.6 0.3 | 09 58 43.94 | 20 51 32.3 | 09 58 43.94 | 20 51 32.3 | ||
| EISD101 | S | 11.9 0.3 | 1.5 | 12.3 | 11.9 0.3 | 09 58 44.87 | 20 31 18.1 | 09 58 44.87 | 20 31 18.1 | ||
| EISD102 | D | 23.6 1.4 | 149 | 10.9 | 1.6 | 7.3 0.6 | 09 57 45.68 | 21 23 18.7 | 09 57 45.89 | 21 23 23.6 | |
| 6.1 | 8.1 0.4 | 09 57 46.08 | 21 23 28.0 | ||||||||
| EISD103 | D | 8.4 1.3 | 78 | 45.9 | 3.7 | 3.5 0.2 | 09 55 43.52 | 21 25 27.8 | 09 55 45.19 | 21 25 23.0 | N |
| 1.0 | 3.1 0.4 | 09 55 46.67 | 21 25 18.7 | ||||||||
| EISD104 | S | 12.7 0.3 | 2.2 | 10.9 | 12.7 0.3 | 09 49 42.98 | 20 37 45.5 | 09 49 42.98 | 20 37 45.5 | ||
| Name | Morph. | PA | (J2000) | (J2000) | Notes | ||||||
|---|---|---|---|---|---|---|---|---|---|---|---|
| (mJy) | ( ) | ( ) | (mJy/bm) | (mJy) | (h m s) | () | (h m s) | () | |||
| EISD105 | D | 16.4 2.1 | 158 | 40.1 | 1.7 | 4.2 0.6 | 09 54 15.95 | 21 28 45.1 | 09 54 16.43 | 21 29 01.6 | |
| 1.2 | 3.4 0.6 | 09 54 17.02 | 21 29 22.3 | ||||||||
| EISD106 | S | 11.8 0.8 | 154 | 5.3 | 6.3 | 8.7 0.4 | 09 45 48.48 | 21 59 06.1 | 09 45 48.48 | 21 59 06.1 | |
| EISD107 | D | 16.0 1.1 | 177 | 6.9 | 3.4 | 8.0 0.6 | 09 55 59.22 | 20 42 48.8 | 09 55 59.23 | 20 42 51.6 | |
| 3.0 | 5.3 0.4 | 09 55 59.24 | 20 42 55.7 | ||||||||
| EISD108 | D | 6.9 0.6 | 29 | 33.4 | 2.7 | 6.1 0.4 | 09 57 42.32 | 19 56 00.9 | 09 57 42.23 | 19 56 02.8 | |
| 0.3 | 0.4 0.1 | 09 57 41.16 | 19 56 30.0 | ||||||||
| EISD109 | D | 6.9 0.9 | 110 | 8.5 | 2.0 | 4.1 0.4 | 09 44 46.73 | 20 58 22.0 | 09 44 46.93 | 20 58 23.1 | |
| 1.7 | 2.3 0.3 | 09 44 47.30 | 20 58 25.0 | ||||||||
| EISD110 | S | 11.1 0.9 | 82 | 10.9 | 2.7 | 8.7 0.5 | 09 54 53.26 | 21 15 12.9 | 09 54 53.26 | 21 15 12.9 | |
| EISD111 | D | 7.7 1.2 | 115 | 9.4 | 2.2 | 2.7 0.2 | 09 45 55.71 | 21 20 53.3 | 09 45 56.03 | 21 20 51.0 | |
| 0.8 | 2.9 0.2 | 09 45 56.31 | 21 20 49.9 | ||||||||
| EISD112 | D | 9.8 1.1 | 37 | 34.4 | 1.4 | 6.8 0.4 | 09 55 23.77 | 21 29 58.8 | 09 55 23.82 | 21 29 57.2 | N |
| 0.2 | 0.3 0.1 | 09 55 25.28 | 21 29 31.6 | ||||||||
| EISD113 | D | 18.1 1.4 | 113 | 22.1 | 3.3 | 3.3 0.4 | 09 50 53.72 | 21 33 08.6 | 09 50 53.62 | 21 33 07.5 | |
| 0.3 | 0.4 0.1 | 09 50 52.25 | 21 32 59.4 | ||||||||
| EISD114 | S | 11.9 0.4 | 3.1 | 8.3 | 11.9 0.4 | 09 47 34.47 | 21 26 58.0 | 09 47 34.47 | 21 26 58.0 | N | |
| EISD115 | S | 9.3 0.3 | 2.7 | 9.4 | 9.3 0.3 | 09 44 45.31 | 21 46 23.7 | 09 44 45.31 | 21 46 23.7 | ||
| EISD116 | S | 13.6 0.3 | 1.2 | 14.1 | 13.6 0.3 | 09 51 29.69 | 20 16 42.8 | 09 51 29.69 | 20 16 42.8 | ||
| EISD117 | T | 10.8 1.3 | 72 | 18.9 | 2.2 | 4.1 0.3 | 09 53 08.65 | 20 01 24.1 | 09 53 09.24 | 20 01 21.3 | |
| 1.4 | 1.8 0.2 | 09 53 09.44 | 20 01 20.3 | ||||||||
| 1.6 | 3.2 0.3 | 09 53 09.92 | 20 01 18.2 | ||||||||
| EISD118 | 09 57 24.26 | 21 29 43.3 | N | ||||||||
| EISD119 | S | 12.0 0.8 | 123 | 2.3 | 9.0 | 10.5 0.3 | 09 45 20.95 | 22 01 22.2 | 09 45 20.95 | 22 01 22.2 | |
| EISD120 | S | 11.8 0.3 | 1.3 | 12.2 | 11.8 0.2 | 09 48 04.20 | 20 34 34.8 | 09 48 04.20 | 20 34 34.8 | ||
| EISD121 | D | 6.6 1.2 | 159 | 29.1 | 1.9 | 2.6 0.2 | 09 54 56.54 | 22 04 59.2 | 09 54 56.87 | 22 05 10.9 | |
| 1.5 | 2.0 0.2 | 09 54 57.30 | 22 05 26.3 | ||||||||
| EISD122 | T | 12.9 1.4 | 20 | 94.1 | 1.3 | 3.7 0.1 | 09 52 55.18 | 20 52 19.3 | 09 52 55.92 | 20 51 45.4 | |
| 3.1 | 3.3 0.3 | 09 52 55.92 | 20 51 45.4 | ||||||||
| 1.4 | 3.3 0.3 | 09 52 57.55 | 20 50 51.2 | ||||||||
| EISD123 | S | 6.8 0.8 | 45 | 1.6 | 4.8 | 6.3 0.3 | 09 54 21.48 | 21 48 07.2 | 09 54 21.48 | 21 48 07.2 | |
| EISD124 | M | 12.4 0.7 | 10 | 154.3 | 1.0 | 1.6 0.1 | 09 48 10.13 | 20 02 00.4 | 09 48 10.91 | 20 00 59.9 | N |
| 0.4 | 2.4 0.5 | 09 48 10.24 | 20 01 53.6 | ||||||||
| 1.2 | 1.7 0.1 | 09 48 11.83 | 19 59 28.0 | ||||||||
| 0.3 | 1.1 0.5 | 09 48 12.06 | 19 59 56.8 | ||||||||
| EISD125 | S | 10.4 0.9 | 129 | 8.5 | 5.4 | 11.0 0.5 | 09 45 21.12 | 20 43 21.4 | 09 45 21.12 | 20 43 21.4 | |
| EISD126 | D | 7.7 2.0 | 10 | 51.8 | 1.4 | 3.0 0.5 | 09 54 35.99 | 21 44 54.2 | 09 54 36.32 | 21 44 26.6 | |
| 1.3 | 3.5 0.6 | 09 54 36.60 | 21 44 03.1 | ||||||||
| EISD127 | S | 10.7 0.3 | 1.3 | 11.4 | 10.7 0.3 | 09 48 22.16 | 21 05 08.9 | 09 48 22.16 | 21 05 08.9 | ||
| EISD128 | T? | 1.9 0.7 | 115 | 43.1 | 0.3 | 0.4 0.1 | 09 58 14.71 | 20 58 18.8 | 09 58 16.37 | 20 58 19.4 | |
| 0.2 | 0.4 0.1 | 09 58 14.81 | 20 58 10.5 | ||||||||
| 0.4 | 0.6 0.1 | 09 58 17.59 | 20 58 28.5 | ||||||||
| EISD129 | S | 10.3 0.4 | 2.6 | 7.9 | 10.3 0.4 | 09 56 20.42 | 22 03 50.5 | 09 56 20.42 | 22 03 50.5 | ||
| EISD130 | S | 9.4 0.3 | 1.1 | 9.7 | 9.4 0.2 | 09 49 35.13 | 21 58 10.5 | 09 49 35.13 | 21 58 10.5 | ||
| EISD131 | S | 11.5 0.3 | 1.0 | 11.4 | 11.5 0.2 | 09 49 25.99 | 20 05 20.2 | 09 49 25.99 | 20 05 20.2 | ||
| EISD132 | D | 9.5 1.1 | 106 | 14.5 | 1.7 | 5.7 0.6 | 09 46 18.63 | 20 37 56.6 | 09 46 18.86 | 20 37 57.4 | |
| 0.4 | 1.4 0.5 | 09 46 19.62 | 20 38 00.7 | ||||||||
| EISD133 | S | 6.8 0.8 | 44 | 4.0 | 2.9 | 3.9 0.4 | 09 57 02.25 | 21 56 51.8 | 09 57 02.25 | 21 56 51.8 | |
| EISD134 | D | 7.3 0.4 | 48 | 12.0 | 0.4 | 1.7 0.1 | 09 46 49.44 | 21 16 45.4 | 09 46 49.27 | 21 16 48.7 | |
| 0.3 | 0.8 0.1 | 09 46 48.90 | 21 16 55.0 | ||||||||
| EISD135 | S | 9.5 0.3 | 2.0 | 9.8 | 9.5 0.3 | 09 58 51.76 | 21 10 23.0 | 09 58 51.76 | 21 10 23.0 | ||
| EISD136 | S | 13.4 0.9 | 57 | 4.7 | 6.7 | 11.7 0.3 | 09 50 48.57 | 21 54 57.1 | 09 50 48.57 | 21 54 57.1 | |
| EISD137 | S | 5.7 0.3 | 6.8 | 3.9 | 5.7 0.3 | 09 48 14.15 | 19 59 56.0 | 09 48 14.15 | 19 59 56.0 | N | |
| EISD138 | S | 9.0 0.4 | 6.8 | 5.7 | 9.0 0.3 | 09 47 24.38 | 21 05 02.3 | 09 47 24.38 | 21 05 02.3 | ||
| EISD139 | S | 10.8 0.3 | 3.0 | 7.9 | 10.8 0.3 | 09 52 50.38 | 21 31 48.0 | 09 52 50.38 | 21 31 48.0 | ||
| EISD140 | S | 4.2 0.6 | 20 | 5.5 | 2.5 | 3.6 0.4 | 09 59 33.76 | 21 14 54.6 | 09 59 33.76 | 21 14 54.6 | |
| EISD141 | T | 6.2 0.3 | 167 | 83.4 | 0.4 | 1.0 0.2 | 09 55 11.38 | 20 29 14.8 | 09 55 11.49 | 20 30 18.7 | |
| 1.1 | 3.0 0.2 | 09 55 11.49 | 20 30 18.7 | ||||||||
| 0.9 | 2.2 0.3 | 09 55 12.69 | 20 30 36.1 | ||||||||
| EISD142 | S | 10.9 0.9 | 116 | 5.6 | 2.8 | 8.8 0.5 | 09 56 06.94 | 20 05 43.8 | 09 56 06.94 | 20 05 43.8 | |
| EISD143 | S | 7.9 0.3 | 1.3 | 8.0 | 7.9 0.2 | 09 57 35.35 | 20 29 35.4 | 09 57 35.35 | 20 29 35.4 | ||
| EISD144 | S | 9.0 0.5 | 3.3 | 6.8 | 9.0 0.3 | 09 44 50.69 | 20 17 36.1 | 09 44 50.69 | 20 17 36.1 | ||
| Name | Morph. | PA | (J2000) | (J2000) | Notes | ||||||
|---|---|---|---|---|---|---|---|---|---|---|---|
| (mJy) | ( ) | ( ) | (mJy/bm) | (mJy) | (h m s) | () | (h m s) | () | |||
| EISD145 | D | 9.2 1.3 | 127 | 31.8 | 1.5 | 1.8 0.2 | 09 57 38.30 | 20 03 10.1 | 09 57 39.51 | 20 03 22.6 | |
| 2.4 | 3.5 0.4 | 09 57 40.12 | 20 03 29.0 | ||||||||
| EISD146 | S | 10.4 0.3 | 1.1 | 10.1 | 10.4 0.2 | 09 56 42.31 | 21 19 44.6 | 09 56 42.31 | 21 19 44.6 | ||
| EISD147 | T | 3.5 0.7 | 16 | 8.6 | 0.5 | 0.9 0.3 | 09 58 57.19 | 20 34 14.3 | 09 58 57.26 | 20 34 10.4 | |
| 0.5 | 0.5 0.2 | 09 58 57.26 | 20 34 10.4 | ||||||||
| 0.4 | 0.9 0.3 | 09 58 57.35 | 20 34 06.0 | ||||||||
| EISD148 | D | 3.9 0.4 | 89 | 7.0 | 1.4 | 2.5 0.2 | 09 45 37.59 | 21 11 14.2 | 09 45 37.77 | 21 11 14.2 | |
| 1.1 | 1.4 0.1 | 09 45 38.09 | 21 11 14.1 | ||||||||
| EISD149 | S | 7.7 0.8 | 49 | 2.3 | 4.6 | 6.4 0.3 | 09 47 44.76 | 21 12 23.6 | 09 47 44.76 | 21 12 23.6 | |
| EISD150 | D | 13.8 1.2 | 95 | 19.7 | 2.4 | 7.3 0.5 | 09 47 09.55 | 20 35 52.3 | 09 47 10.01 | 20 35 52.8 | |
| 1.6 | 3.5 0.4 | 09 47 10.95 | 20 35 54.0 | ||||||||
| EISD151 | 09 55 53.71 | 21 27 12.1 | N | ||||||||
| EISD152 | S | 9.3 0.5 | 5.1 | 4.3 | 9.3 0.5 | 09 59 27.68 | 20 03 17.1 | 09 59 27.68 | 20 03 17.1 | ||
| EISD153 | S | 10.3 0.3 | 1.3 | 9.6 | 10.3 0.3 | 09 56 49.76 | 20 35 25.9 | 09 56 49.76 | 20 35 25.9 | ||
| EISD154 | S | 4.9 0.5 | 3.9 | 3.0 | 4.9 0.5 | 09 52 10.91 | 20 50 11.2 | 09 52 10.91 | 20 50 11.2 | ||
| EISD155 | D | 7.6 1.0 | 173 | 13.1 | 1.2 | 3.0 0.6 | 09 57 24.88 | 20 22 42.5 | 09 57 24.93 | 20 22 48.0 | |
| 1.4 | 2.1 0.4 | 09 57 25.00 | 20 22 55.5 | ||||||||
| EISD156 | T | 3.8 0.7 | 163 | 28.4 | 0.6 | 1.6 0.2 | 09 56 36.81 | 20 18 55.0 | 09 56 37.11 | 20 19 05.5 | |
| 0.6 | 0.6 0.1 | 09 56 37.11 | 20 19 05.5 | ||||||||
| 0.4 | 0.8 0.2 | 09 56 37.36 | 20 19 17.4 | ||||||||
| EISD157 | S | 7.3 0.8 | 104 | 7.9 | 4.0 | 8.5 0.5 | 09 49 02.22 | 21 15 05.5 | 09 49 02.22 | 21 15 05.5 | |
| EISD158 | D | 5.4 0.7 | 87 | 6.0 | 2.0 | 2.8 0.3 | 09 44 43.45 | 21 44 37.1 | 09 44 43.55 | 21 44 37.1 | |
| 0.8 | 1.4 0.4 | 09 44 43.87 | 21 44 36.8 | 09 44 43.55 | 21 44 37.1 | ||||||
| EISD159 | S | 7.3 0.2 | 1.2 | 7.1 | 7.3 0.2 | 09 53 57.38 | 20 36 51.3 | 09 53 57.38 | 20 36 51.3 | ||
| EISD160 | S | 7.5 0.3 | 1.2 | 7.6 | 7.5 0.3 | 09 58 49.71 | 21 17 37.1 | 09 58 49.71 | 21 17 37.1 | ||
| EISD161 | S | 8.3 0.7 | 157 | 3.7 | 6.1 | 9.1 0.3 | 09 47 48.55 | 20 48 34.0 | 09 47 48.55 | 20 48 34.0 | |
| EISD162 | S | 2.5 0.4 | 3.8 | 2.2 | 2.5 0.2 | 09 56 39.20 | 20 10 43.6 | 09 56 39.20 | 20 10 43.6 | ||
| EISD163 | E | 3.4 2.1 | 4.7 | 24.8 | 0.4 | 2.1 0.6 | 09 49 10.88 | 20 21 53.0 | 09 49 10.88 | 20 21 53.0 | |
| EISD164 | S | 7.6 0.3 | 0.9 | 7.9 | 7.6 0.2 | 09 52 01.20 | 20 24 56.5 | 09 52 01.20 | 20 24 56.5 | ||
| EISD165 | D | 8.7 0.9 | 71 | 5.6 | 3.4 | 4.4 0.3 | 09 54 10.35 | 21 58 01.8 | 09 54 10.54 | 21 58 00.9 | |
| 4.1 | 4.2 0.2 | 09 54 10.73 | 21 57 60.0 | ||||||||
| EISD166 | S | 10.9 0.3 | 1.8 | 11.5 | 10.9 0.2 | 09 56 04.45 | 21 44 36.7 | 09 56 04.45 | 21 44 36.7 | ||
| EISD167 | S | 6.1 0.3 | 2.7 | 5.6 | 6.1 0.2 | 09 46 02.36 | 21 51 44.2 | 09 46 02.36 | 21 51 44.2 | ||
| EISD168 | S | 6.6 0.4 | 1.2 | 6.6 | 6.6 0.2 | 09 44 50.11 | 20 07 38.3 | 09 44 50.11 | 20 07 38.3 | ||
| EISD169 | D | 5.6 0.8 | 13 | 9.5 | 1.4 | 2.7 0.3 | 09 51 48.87 | 21 33 46.2 | 09 51 48.94 | 21 33 41.6 | |
| 1.5 | 2.7 0.3 | 09 51 49.03 | 21 33 37.0 | ||||||||
| EISD170 | S | 5.7 0.3 | 2.1 | 5.3 | 5.7 0.2 | 09 52 26.51 | 20 01 07.1 | 09 52 26.51 | 20 01 07.1 | ||
| EISD171 | D | 6.7 1.3 | 76 | 38.3 | 1.0 | 2.4 0.4 | 09 47 49.10 | 21 42 13.4 | 09 47 50.58 | 21 42 08.2 | |
| 2.2 | 3.0 0.3 | 09 47 51.77 | 21 42 04.1 | ||||||||
| EISD172 | S | 6.3 0.3 | 1.2 | 6.4 | 6.3 0.2 | 09 57 22.18 | 21 01 06.0 | 09 57 22.18 | 21 01 06.0 | ||
| EISD173 | S | 8.7 0.3 | 1.2 | 8.7 | 8.7 0.2 | 09 54 31.06 | 20 35 38.0 | 09 54 31.06 | 20 35 38.0 | ||
| EISD174 | S | 8.5 0.3 | 1.3 | 8.7 | 8.5 0.2 | 09 49 02.78 | 20 16 11.5 | 09 49 02.78 | 20 16 11.5 | ||
| EISD175 | D | 8.3 1.1 | 28 | 11.8 | 1.8 | 3.0 0.3 | 09 49 22.11 | 21 18 24.6 | 09 49 22.31 | 21 18 19.4 | |
| 1.6 | 3.0 0.3 | 09 49 22.52 | 21 18 14.2 | ||||||||
| EISD176 | 09 58 20.40 | 21 39 13.3 | N | ||||||||
| EISD177 | S | 6.8 0.8 | 60 | 4.4 | 1.5 | 3.0 0.4 | 09 55 26.95 | 20 46 06.0 | 09 55 26.95 | 20 46 06.0 | |
| EISD178 | D | 3.5 0.8 | 42 | 10.4 | 1.2 | 1.2 0.2 | 09 47 47.95 | 21 00 46.2 | 09 47 48.33 | 21 00 40.4 | |
| 3.9 | 3.5 0.2 | 09 47 48.45 | 21 00 38.4 | ||||||||
| EISD179 | S | 7.5 0.3 | 1.0 | 7.8 | 7.5 0.2 | 09 49 59.72 | 21 27 19.0 | 09 49 59.72 | 21 27 19.0 | ||
| EISD180 | S | 2.8 0.3 | 2.8 | 2.2 | 2.8 0.2 | 09 49 12.72 | 22 00 23.4 | 09 49 12.72 | 22 00 23.4 | ||
| EISD181 | S | 4.2 0.4 | 3.8 | 3.7 | 4.2 0.2 | 09 54 41.85 | 20 49 43.0 | 09 54 41.85 | 20 49 43.0 | ||
| EISD182 | D | 10.1 1.2 | 125 | 22.4 | 1.2 | 2.4 0.3 | 09 49 48.06 | 21 34 24.4 | 09 49 49.00 | 21 34 33.7 | |
| 3.9 | 6.0 0.3 | 09 49 49.37 | 21 34 37.4 | ||||||||
| EISD183 | D | 3.7 0.5 | 151 | 11.4 | 1.4 | 2.3 0.3 | 09 51 29.23 | 20 25 31.2 | 09 51 29.36 | 20 25 34.6 | |
| 0.6 | 1.2 0.2 | 09 51 29.62 | 20 25 41.2 | ||||||||
| EISD184 | S | 5.9 0.7 | 68 | 4.4 | 2.4 | 5.1 0.4 | 09 45 07.54 | 21 09 25.8 | 09 45 07.54 | 21 09 25.8 | |
| EISD185 | S | 2.2 0.3 | 2.9 | 1.2 | 1.5 0.2 | 09 52 14.34 | 21 40 19.0 | 09 52 14.34 | 21 40 19.0 | ||
| EISD186 | S | 9.1 0.3 | 1.0 | 9.4 | 9.1 0.2 | 09 49 24.64 | 21 11 12.0 | 09 49 24.64 | 21 11 12.0 | ||
| EISD187 | D | 3.4 0.5 | 159 | 33.0 | 0.9 | 1.5 0.3 | 09 50 38.44 | 21 40 55.3 | 09 50 38.80 | 21 41 08.4 | |
| 0.9 | 1.1 0.2 | 09 50 39.29 | 21 41 26.1 | ||||||||
| EISD188 | S | 5.2 0.3 | 1.7 | 5.1 | 5.2 0.2 | 09 47 46.12 | 21 27 51.2 | 09 47 46.12 | 21 27 51.2 | ||
| EISD189 | S | 6.7 0.3 | 1.2 | 6.9 | 6.7 0.2 | 09 45 51.03 | 20 14 46.9 | 09 45 51.03 | 20 14 46.9 | ||
| EISD190 | S | 6.3 0.2 | 1.6 | 6.9 | 6.3 0.2 | 09 59 37.64 | 20 38 26.0 | 09 59 37.64 | 20 38 26.0 | ||
| Name | Morph. | PA | (J2000) | (J2000) | Notes | ||||||
|---|---|---|---|---|---|---|---|---|---|---|---|
| (mJy) | ( ) | ( ) | (mJy/bm) | (mJy) | (h m s) | () | (h m s) | () | |||
| EISD191 | E | 0.7 0.4 | 0.5 | 0.6 0.3 | 09 50 27.68 | 21 48 08.7 | 09 50 27.68 | 21 48 08.7 | |||
| EISD192 | S | 4.4 0.3 | 2.1 | 3.8 | 4.4 0.3 | 09 59 12.53 | 20 12 53.2 | 09 59 12.53 | 20 12 53.2 | ||
| EISD193 | S | 3.9 0.4 | 2.5 | 3.7 | 3.9 0.3 | 09 50 55.91 | 19 55 12.0 | 09 50 55.91 | 19 55 12.0 | ||
| EISD194 | D | 1.9 0.4 | 29 | 23.1 | 0.7 | 1.0 0.2 | 09 45 27.39 | 20 57 44.1 | 09 45 27.69 | 20 57 35.2 | |
| 0.3 | 0.6 0.2 | 09 45 28.18 | 20 57 23.9 | ||||||||
| EISD195 | S | 5.2 0.3 | 1.9 | 5.6 | 5.2 0.3 | 09 57 15.56 | 20 30 34.8 | 09 57 15.56 | 20 30 34.8 | ||
| EISD196 | 09 50 02.94 | 22 05 34.9 | N | ||||||||
| EISD197 | S | 4.7 0.3 | 1.7 | 4.2 | 4.7 0.3 | 09 45 21.73 | 20 36 00.3 | 09 45 21.73 | 20 36 00.3 | ||
| EISD198 | S | 6.3 0.7 | 151 | 1.7 | 4.2 | 5.5 0.3 | 09 58 50.93 | 21 08 18.3 | 09 58 50.93 | 21 08 18.3 | |
| EISD199 | S | 5.1 0.2 | 1.1 | 5.2 | 5.1 0.2 | 09 45 26.34 | 21 55 00.4 | 09 45 26.34 | 21 55 00.4 | ||
Appendix B The optical counterparts
In this appendix, the technique used to identify optical galaxies in the EIS catalogue as the host galaxies of the radio sources is described. Then, Table 4 provides details of the optical counterparts, as determined from the EIS database.
B.1 Maximum likelihood analysis
The likelihood ratio technique (e.g. Richter 1975, de Ruiter et al. 1977) can be used to statistically investigate whether a proposed optical identification is the real counterpart of a radio source. In this method, the dimensionless difference between the radio and optical positions is defined as:
where and are the differences in right ascension and declination between the radio and optical positions, and and are the positional standard errors on these differences. These have contributions from the uncertainties in both the radio and optical positions: , and . The radio uncertainties for a typical unresolved component are about arcsec in each direction. Defining the astrometry of the radio frames to be absolute, the uncertainties in the optical positions are dominated by the radio–optical astrometric errors, which are of order arcsec.
Assuming a random distribution of objects in the EIS survey, the probability of the nearest random object (c) lying at a radius of between and is governed by a Poisson process and can be written as , where and is the number of objects per square arcsecond in the EIS catalogue. The probability of finding the true optical counterpart (id) of the radio source at a distance between and can be represented by a Rayleigh distribution: . The likelihood ratio, defined as:
is therefore an effective estimator to distinguish whether individual optical galaxies are true optical counterparts in the tail of the Rayleigh distribution or confusing background sources.
B.2 Radio sources with well–defined positions
The likelihood ratio was calculated in this way for every optical galaxy within 5 arcseconds of any single–component radio source, or any radio source with a clear radio core. To investigate the appropriate cut–off value of the likelihood ratio, , then (following de Ruiter et al. 1977) the completeness (the fraction of real identifications which are accepted) and the reliability (the fraction of accepted identifications which are correct) of the sample can be determined for different values of according to the equations:
where and are the posteriori probabilities for an object found at a normalised distance to be the true optical counterpart of the radio source or a confusing background object respectively, and is the total number of real identifications obtained by summing for all sources. If the a priori probability of finding an optical counterpart to a source is written as then these probabilities can be written as:
and hence, from and the values of , the completeness and the reliability of the sample can be computed as a function of .
To obtain an estimate of , for all of the single–component radio sources or those with a clear core, the angular separation between the radio position and the nearest optical galaxy was calculated, and the distribution of these is shown in Figure 19. There is a clear peak of optical objects associated with the radio sources at small angular offsets, with the excess essentially continuing out to about 1 arcsec. 55 of the 87 sources are found within this radius, and a value of is adopted.
Adopting this value of , the completeness and reliability of the optical identifications are shown as a function of the likelihood ratio cut–off in Figure 20. The average of these two functions peaks for likelihood ratio cut-offs in the range ; a cut-off value of is therefore adopted. At this value, the completeness of the optical identifications should be % (meaning that for all radio sources whose optical host is bright enough to be detected in the EIS-D catalogue, 99% of them will have been found), and a reliability of over 94%.


B.3 Extended radio sources
Where no clear radio core is detected for a double, triple, or multiple component radio source, the source extendness introduces an additional uncertainty into the radio position which must be correctly accounted for in order to accurately estimate the reliability, completeness and identification fraction of the sample.
Bright radio source samples such as the revised 3CR sample [1983], for which optical identifications have been made for essentially all sources, are known to frequently have two radio lobes of unequal length, or to show a bend in their radio jets. These parameters can be quantified as the separation quotient, , where and are the angular distances from the cores to the hotspots of the longer and shorter lobes respectively, and the asymmetry angle, , that is defined as 180∘ minus the observed angle between vectors drawn from the nucleus of the radio source to the hotspots. From these two parameters and the size of the radio source (, assuming that is small), expressions can be derived for the expected displacement of the central optical object along and perpendicular to (respectively) the main radio axis that connects the two hotspots:
assuming that Q is close to unity and is relatively small.
Best et al. [1995] investigated the distribution of and within a complete subsample of 95 radio sources from the revised 3CR sample. They find mean values of and ; these mean values were adopted as input for the determination of the revised positional uncertainties of the extended radio sources in the sample333One important point to note with this analysis, however, is that although Best et al. [1995] find no evidence for any dependence of or upon radio luminosity, the current sample is of significantly lower luminosity, and is selected at 1.4 GHz instead of at 178 MHz. Therefore the distributions of and may not be entirely appropriate, which could potentially bias the statistics of this investigation., according to:
where PA is the position angle of the radio source and the 1.0 arcsecond term corresponds to the uncertainties in the measurement of the radio source positions; this was the only term used in the analysis of the single component sources, where a value of 0.3 arcsec was adopted. A larger value is adopted here to account for the increased uncertainty in measuring the precise positions of the lobes, since these structures are extended and faint, but in most cases this term is negligible anyway.

Adopting these values for the radio positional uncertainties of each source, the likelihood analysis was repeated for the extended radio sources considering all optical counterparts within 0.25 or 10′′ (whichever was larger) of the position midway between the two radio hotspots. A value of was adopted, as for the single–component sources; this ignores the possibility that the redshift or magnitude distribution of the extended sources may be different from that of the unresolved sources, but there is no better approximation that can be made, and the overall results vary only slightly if the value of is changed.
The resulting dependence of the completeness and reliability of the identified optical hosts are shown in Figure 21 as a function of the likelihood ratio cut–off. The situation is understandably worse than in the previous case, due to the larger uncertainties in the radio position. At the peak in the average of the two functions, , the completeness of the optical identifications is % and the reliability %. Optical counterparts above this threshold were found for 34 sources, with two potential counterparts above the threshold in 2 cases.
It was further noted that for 6 of the sources (see Table 4) for which no optical counterpart with a likelihood ratio above the cut–off were found, clear optical counterparts were seen to be associated with one of the two apparent radio lobes. These optical galaxies are also accepted as possible identifications, due to the possibility of radio sources with very asymmetric flux ratios, where the detected “lobe” is actually the radio core and a fainter lobe on the other side is not detected in the new radio observations.
| Source | Class | RA (J2000) Dec | -magnitude | -magnitude | -magnitude | S/G | Notes | ||
|---|---|---|---|---|---|---|---|---|---|
| EISD1 | 2 | 11.35 | 09 51 29.22 | -20 50 30.7 | 21.74 0.10 | 22.93 0.09 | 23.27 0.09 | 0.26 | |
| EISD2 | 1 | 77.73 | 09 46 50.22 | -20 20 44.4 | 22.59 0.18 | 24.02 0.17 | 0.01 | ||
| EISD3 | 1 | 5.81 | 09 50 31.40 | -21 02 44.4 | 20.60 0.20 | 23.11 0.11 | 23.77 0.16 | 0.02 | N |
| EISD6 | 2 | 2.91 | 09 49 53.26 | -21 56 19.9 | 21.30 0.08 | 23.36 0.12 | 23.41 0.13 | 0.00 | N |
| 2 | 2.39 | 09 49 53.23 | -21 56 22.0 | 22.58 0.15 | 0.29 | ||||
| EISD7 | 1 | 38.80 | 09 51 43.60 | -21 23 57.9 | 18.26 0.01 | 18.65 0.01 | 18.40 0.01 | 1.00 | |
| EISD8 | 1 | 1.22 | 09 53 44.47 | -21 36 01.7 | 22.15 0.12 | 22.73 0.06 | 22.57 0.15 | 0.19 | |
| EISD10 | 1 | 3.31 | 09 45 56.68 | -21 16 53.6 | 22.62 0.17 | 23.54 0.19 | 23.38 0.11 | 0.64 | |
| EISD11 | 1 | 2.65 | 09 57 30.06 | -21 30 58.9 | 17.77 0.01 | 19.38 0.02 | 20.35 0.03 | 0.25 | |
| EISD12 | 1 | 37.18 | 09 49 35.46 | -21 56 23.3 | 18.28 0.01 | 20.08 0.01 | 20.96 0.02 | 0.03 | |
| EISD15 | 1 | 19.77 | 09 53 29.55 | -20 02 12.6 | 21.75 0.07 | 22.49 0.05 | 22.74 0.05 | 0.91 | |
| EISD16 | 2 | 0.31 | 09 47 27.00 | -21 26 33.4 | 18.26 0.01 | 18.73 0.01 | 19.15 0.01 | 0.99 | N |
| EISD18 | 1 | 24.93 | 09 46 41.13 | -20 29 26.7 | 21.88 0.09 | 23.35 0.15 | 23.90 0.19 | 0.00 | |
| EISD21 | 2 | 6.34 | 09 54 47.59 | -20 59 44.3 | 23.60 0.25 | 0.58 | |||
| EISD22 | 2 | 5.50 | 09 46 50.99 | -20 53 18.2 | 20.57 0.06 | 20.91 0.04 | 21.45 0.03 | 0.00 | |
| EISD24 | 2 | 8.45 | 09 52 43.02 | -19 58 21.6 | 21.38 0.07 | 23.63 0.14 | 0.15 | ||
| EISD25 | 1 | 12.94 | 09 55 13.59 | -21 23 02.4 | 14.88 0.00 | 16.13 0.01 | 16.96 0.01 | 0.03 | |
| EISD28 | 1 | 41.89 | 09 47 58.95 | -21 21 50.5 | 22.11 0.10 | 24.38 0.19 | 24.52 0.14 | 0.26 | |
| EISD38 | 3 | N/A | 09 46 32.15 | -20 26 15.5 | 19.02 0.02 | 20.86 0.04 | 21.59 0.03 | 0.03 | N |
| EISD39 | 1 | 32.38 | 09 48 15.74 | -21 40 06.1 | 18.73 0.01 | 19.02 0.01 | 19.23 0.01 | 0.97 | |
| EISD40 | 1 | 7.02 | 09 45 55.92 | -20 28 29.7 | 16.41 0.00 | 18.58 0.01 | 19.50 0.05 | 0.86 | |
| EISD43 | 2 | 1.45 | 09 51 40.85 | -20 11 16.3 | 22.25 0.12 | 0.00 | |||
| EISD44 | 1 | 6.79 | 09 51 49.83 | -21 24 57.5 | 18.29 0.01 | 20.12 0.02 | 21.14 0.02 | 0.03 | |
| EISD47 | 1 | 5.78 | 09 47 53.61 | -21 47 19.3 | 24.95 0.63 | 0.36 | N | ||
| EISD48 | 2 | 12.52 | 09 54 52.46 | -21 19 28.6 | 18.71 0.01 | 21.11 0.03 | 22.12 0.04 | 0.03 | |
| EISD51 | 1 | 16.75 | 09 49 33.24 | -21 27 07.7 | 22.90 0.17 | 24.74 0.16 | 0.68 | ||
| EISD52 | 2 | 1.87 | 09 49 19.57 | -21 51 34.1 | 23.67 0.19 | 24.55 0.26 | 24.52 0.20 | 0.44 | |
| EISD54 | 2 | 1.78 | 09 48 36.08 | -21 06 22.4 | 20.60 0.03 | 21.73 0.03 | 21.61 0.02 | 0.92 | |
| EISD55 | 2 | 2.35 | 09 50 59.01 | -21 14 24.4 | 21.54 0.10 | 23.18 0.13 | 23.66 0.12 | 0.00 | |
| EISD58 | 1 | 15.30 | 09 49 18.16 | -20 54 44.8 | 17.10 0.01 | 18.92 0.03 | 20.09 0.01 | 0.03 | |
| EISD60 | 3 | N/A | 09 52 01.59 | -21 15 53.0 | 23.70 0.19 | 25.06 0.28 | 0.49 | N | |
| EISD62 | 1 | 47.94 | 09 54 27.09 | -20 29 46.6 | 19.85 0.02 | 20.48 0.01 | 20.80 0.02 | 0.98 | |
| EISD63 | 2 | 0.70 | 09 47 03.25 | -20 50 00.8 | 19.34 0.02 | 21.08 0.02 | 21.82 0.04 | 0.02 | |
| EISD64 | 2 | 11.64 | 09 52 59.15 | -21 48 42.5 | 20.93 0.05 | 24.37 0.14 | 0.24 | ||
| EISD65 | 1 | 32.03 | 09 54 03.05 | -20 25 13.1 | 20.39 0.05 | 22.70 0.10 | 23.53 0.13 | 0.01 | |
| EISD66 | 1 | 8.08 | 09 57 42.91 | -20 06 36.9 | 20.50 0.04 | 23.33 0.10 | 24.16 0.15 | 0.04 | |
| EISD67 | 1 | 40.69 | 09 53 23.21 | -20 13 43.5 | 19.20 0.02 | 20.57 0.16 | 20.55 0.01 | 0.04 | |
| EISD68 | 1 | 14.13 | 09 54 28.32 | -20 39 26.9 | 19.48 0.02 | 20.44 0.01 | 20.41 0.01 | 0.97 | |
| EISD71 | 2 | 2.25 | 09 49 30.81 | -20 23 34.7 | 19.61 0.03 | 22.00 0.18 | 22.94 0.11 | 0.03 | |
| EISD74 | 1 | 21.23 | 09 53 20.60 | -21 43 58.9 | 15.75 0.00 | 17.43 0.01 | 18.59 0.01 | 0.03 | |
| EISD76 | 2 | 10.61 | 09 51 32.39 | -21 00 29.0 | 17.50 0.01 | 19.89 0.02 | 20.95 0.05 | 0.03 | |
| EISD78 | 2 | 0.35 | 09 50 43.16 | -21 26 41.3 | 22.58 0.14 | 0.04 | |||
| EISD80 | 2 | 7.00 | 09 51 21.03 | -21 29 54.8 | 22.19 0.13 | 0.14 | |||
| EISD81 | 1 | 1.17 | 09 48 42.52 | -21 52 24.8 | 21.69 0.10 | 0.00 | |||
| EISD83 | 1 | 29.40 | 09 51 48.67 | -20 31 52.4 | 23.48 0.26 | 0.20 | |||
| EISD84 | 2 | 09.66 | 09 49 45.86 | -21 50 06.5 | 20.25 0.03 | 22.94 0.07 | 24.30 0.14 | 0.04 | |
| EISD88 | 2 | 7.58 | 09 45 29.53 | -21 18 51.7 | 17.96 0.01 | 19.96 0.01 | 20.89 0.01 | 0.98 | |
| EISD89 | 2 | 1.95 | 09 57 31.77 | -21 20 29.2 | 18.62 0.01 | 20.87 0.03 | 21.95 0.04 | 0.03 | |
| EISD90 | 1 | 2.55 | 09 50 46.42 | -21 32 55.7 | 21.96 0.11 | 22.47 0.06 | 23.34 0.13 | 0.25 | |
| EISD91 | 3 | N/A | 09 54 51.95 | -21 30 16.4 | 19.88 0.20 | 21.54 0.20 | 22.55 0.20 | 0.02 | N |
| EISD98 | 2 | 1.49 | 09 45 26.93 | -20 33 52.8 | 16.73 0.01 | 18.37 0.01 | 19.88 0.01 | 0.03 | |
| EISD102 | 3 | N/A | 09 57 46.06 | -21 23 27.7 | 17.23 0.01 | 18.99 0.01 | 20.16 0.01 | 0.03 | N |
| EISD104 | 1 | 66.46 | 09 49 42.99 | -20 37 45.6 | 23.60 0.20 | 24.99 0.31 | 0.53 | ||
| EISD105 | 2 | 2.98 | 09 54 16.45 | -21 29 04.3 | 21.16 0.06 | 22.44 0.08 | 22.87 0.08 | 0.13 | |
| EISD106 | 1 | 48.67 | 09 45 48.50 | -21 59 06.1 | 22.57 0.15 | 24.27 0.19 | 0.16 | ||
| EISD107 | 2 | 10.73 | 09 55 59.27 | -20 42 52.8 | 19.24 0.02 | 21.05 0.03 | 22.27 0.05 | 0.03 | |
| EISD110 | 3 | N/A | 09 54 53.46 | -21 15 13.1 | 20.01 0.02 | 21.25 0.03 | 23.94 0.05 | 0.03 | N |
| EISD113 | 2 | 4.42 | 09 50 53.09 | -21 33 04.0 | 14.49 0.00 | 14.39 0.01 | 14.65 0.01 | 0.98 | |
| EISD116 | 1 | 72.10 | 09 51 29.71 | -20 16 42.8 | 20.13 0.03 | 21.72 0.08 | 22.77 0.10 | 0.02 | |
| EISD120 | 1 | N/A | 09 48 04.32 | -20 34 36.3 | 23.00 0.30 | 0.00 | N | ||
| Source | Class | RA (J2000) Dec | -magnitude | -magnitude | -magnitude | S/G | Notes | ||
|---|---|---|---|---|---|---|---|---|---|
| EISD122 | 1 | 43.12 | 09 52 55.92 | -20 51 45.0 | 18.68 0.01 | 19.29 0.01 | 19.41 0.01 | 0.97 | |
| EISD123 | 3 | N/A | No position obtainable | Saturated | Saturated | Saturated | 0.00 | N | |
| EISD126 | 2 | 1.94 | 09 54 36.24 | -21 44 30.9 | 22.54 0.14 | 0.07 | |||
| EISD127 | 1 | 17.18 | 09 48 22.19 | -21 05 08.4 | 22.43 0.12 | 0.00 | |||
| EISD132 | 2 | 5.74 | 09 46 19.15 | -20 37 57.7 | 17.41 0.01 | 18.86 0.01 | 19.84 0.01 | 0.03 | |
| EISD133 | 1 | 7.56 | 09 57 02.29 | -21 56 51.2 | 19.49 0.03 | 22.22 0.07 | 24.15 0.14 | 0.03 | |
| EISD134 | 2 | 0.68 | 09 46 49.47 | -21 16 46.4 | 18.36 0.01 | 20.83 0.02 | 21.82 0.04 | 0.03 | |
| EISD136 | 1 | 22.21 | 09 50 48.54 | -21 54 56.7 | 23.77 0.25 | 24.69 0.18 | 24.60 0.22 | 0.65 | |
| EISD137 | 1 | 11.63 | 09 48 14.19 | -19 59 56.3 | 18.93 0.02 | 20.84 0.02 | 21.92 0.04 | 0.03 | |
| EISD139 | 1 | 15.07 | 09 52 50.42 | -21 31 47.6 | 22.35 0.14 | 24.33 0.25 | 0.41 | ||
| EISD141 | 1 | 10.38 | 09 55 11.46 | -20 30 19.2 | 17.52 0.01 | 19.17 0.01 | 20.25 0.10 | 0.03 | |
| EISD142 | 1 | 3.29 | 09 56 07.00 | -20 05 44.3 | 21.96 0.10 | 24.37 0.18 | 0.02 | ||
| EISD143 | 1 | 78.31 | 09 57 35.36 | -20 29 35.4 | 19.97 0.02 | 20.57 0.03 | 20.90 0.02 | 0.97 | |
| EISD145 | 2 | 2.25 | 09 57 39.07 | -20 03 20.2 | 23.33 0.19 | 0.74 | |||
| EISD146 | 1 | 51.27 | 09 56 42.30 | -21 19 44.3 | 23.50 0.23 | 23.90 0.17 | 22.95 0.07 | 0.51 | |
| EISD148 | 3 | N/A | 09 45 38.08 | -21 11 13.5 | 18.92 0.02 | 21.38 0.03 | 22.23 0.05 | 0.03 | N |
| EISD149 | 1 | 71.30 | 09 47 44.76 | -21 12 23.4 | 18.34 0.01 | 20.77 0.02 | 21.73 0.03 | 0.03 | |
| EISD150 | 2 | 5.38 | 09 47 10.31 | -20 35 52.4 | 22.10 0.11 | 24.30 0.24 | 0.07 | ||
| EISD153 | 1 | 48.44 | 09 56 49.79 | -20 35 25.9 | 17.09 0.01 | 18.63 0.01 | 19.70 0.01 | 0.03 | |
| EISD155 | 3 | N/A | 09 57 24.90 | -20 22 43.0 | 17.84 0.01 | 20.10 0.02 | 21.09 0.02 | 0.03 | N |
| EISD156 | 1 | 49.46 | 09 56 37.10 | -20 19 05.8 | 16.94 0.01 | 18.38 0.01 | 19.60 0.01 | 0.03 | |
| EISD157 | 1 | 9.38 | 09 49 02.26 | -21 15 05.1 | 23.58 0.26 | 25.42 0.19 | 0.48 | ||
| EISD159 | 1 | 9.01 | 09 53 57.43 | -20 36 51.0 | 21.10 0.06 | 22.28 0.06 | 22.41 0.05 | 0.31 | |
| EISD162 | 3 | N/A | 09 56 39.22 | -20 10 44.3 | 19.20 0.30 | — | N | ||
| EISD163 | 3 | N/A | No position obtainable | Saturated | Saturated | Saturated | 0.00 | N | |
| EISD164 | 1 | 42.18 | 09 52 01.22 | -20 24 56.2 | 17.15 0.01 | 18.58 0.01 | 19.57 0.01 | 0.03 | |
| EISD165 | 2 | 11.66 | 09 54 10.51 | -21 58 01.5 | 22.73 0.15 | 0.11 | |||
| EISD166 | 1 | 82.75 | 09 56 04.45 | -21 44 36.6 | 22.73 0.22 | 23.62 0.16 | 23.68 0.10 | 0.48 | |
| EISD169 | 2 | 1.31 | 09 51 49.02 | -21 33 40.0 | 17.15 0.01 | 19.50 0.01 | 19.97 0.02 | 0.03 | |
| EISD171 | 2 | 1.94 | 09 47 50.33 | -21 42 10.1 | 14.84 0.00 | 14.99 0.01 | 15.34 0.01 | 0.98 | N |
| 2 | 0.41 | 09 47 50.64 | -21 42 11.4 | 17.43 0.00 | 18.84 0.01 | 19.34 0.01 | 0.92 | ||
| EISD173 | 1 | 54.15 | 09 54 31.06 | -20 35 37.7 | 21.05 0.07 | 22.96 0.14 | 0.00 | ||
| EISD174 | 1 | 28.36 | 09 49 02.79 | -20 16 11.0 | 22.50 0.13 | 22.97 0.12 | 23.99 0.12 | 0.26 | |
| EISD175 | 2 | 2.96 | 09 49 22.34 | -21 18 17.7 | 18.95 0.02 | 21.83 0.05 | 23.00 0.25 | 0.03 | |
| EISD177 | 1 | 80.27 | 09 55 26.95 | -20 46 05.9 | 19.99 0.04 | 22.63 0.06 | 23.45 0.13 | 0.05 | |
| EISD178 | 3 | N/A | 09 47 47.93 | -21 00 45.4 | 21.42 0.08 | 22.63 0.10 | 23.12 0.06 | 0.52 | N |
| EISD179 | 1 | 10.44 | 09 49 59.71 | -21 27 18.3 | 19.95 0.03 | 22.29 0.07 | 22.60 0.15 | 0.04 | |
| EISD180 | 1 | 48.63 | 09 49 12.74 | -22 00 23.4 | 17.61 0.01 | 19.85 0.02 | 20.81 0.02 | 0.03 | |
| EISD181 | 1 | 20.07 | 09 54 41.88 | -20 49 43.4 | 24.85 0.35 | 0.37 | N | ||
| EISD185 | 1 | 14.39 | 09 52 14.36 | -21 40 18.4 | 14.84 0.00 | 15.87 0.01 | 16.15 0.01 | 0.04 | |
| EISD186 | 1 | 35.36 | 09 49 24.62 | -21 11 11.6 | 20.77 0.04 | 22.83 0.07 | 23.10 0.10 | 0.04 | |
| EISD187 | 2 | 0.42 | 09 50 38.66 | -21 41 11.4 | 18.73 0.02 | 21.49 0.05 | 22.43 0.08 | 0.03 | |
| EISD191 | 3 | N/A | No position obtainable | Saturated | Saturated | Saturated | 0.00 | N | |
| EISD199 | 1 | 53.54 | 09 45 26.32 | -21 55 00.1 | 17.99 0.01 | 19.64 0.01 | 20.71 0.02 | 0.03 | |
Appendix C The final CENSORS sample
Table 5 provides the definition of the final CENSORS sample.
| New | Old | New | Old | New | Old | |||||
|---|---|---|---|---|---|---|---|---|---|---|
| name | name | (mJy) | name | name | (mJy) | name | name | (mJy) | ||
| CENSORS1 | EISD1 | 659.5 19.8 | CENSORS53 | EISD76 | 21.6 1.1 | CENSORS105 | EISD138 | 10.6 0.6 | ||
| CENSORS2 | EISD2 | 452.3 13.6 | CENSORS54 | EISD74 | 21.4 0.8 | CENSORS106 | EISD142 | 10.5 0.6 | ||
| CENSORS3 | EISD3 | 355.3 10.7 | CENSORS55 | EISD71 | 21.4 0.8 | CENSORS107 | EISD148 | 10.3 1.0 | ||
| CENSORS4 | EISD6 | 283.0 9.5 | CENSORS56 | EISD78 | 20.8 1.1 | CENSORS108 | EISD153 | 10.2 0.6 | ||
| CENSORS5 | EISD8 | 244.7 8.2 | CENSORS57 | EISD80 | 20.7 1.1 | CENSORS109 | EISD154 | 10.1 0.6 | ||
| CENSORS6 | EISD7* | 239.7 1.3 | CENSORS58 | EISD79 | 20.7 0.8 | CENSORS110 | EISD141 | 10.1 1.3 | ||
| CENSORS7 | EISD10 | 148.2 5.1 | CENSORS59 | EISD81 | 19.1 1.1 | CENSORS111 | EISD149 | 10.0 0.6 | ||
| CENSORS8 | EISD11 | 126.3 3.8 | CENSORS60 | EISD83 | 18.9 0.7 | CENSORS112 | EISD146 | 9.8 0.6 | ||
| CENSORS9 | EISD12 | 118.2 3.6 | CENSORS61 | EISD82 | 18.5 0.7 | CENSORS113 | EISD150 | 9.7 0.6 | ||
| CENSORS10 | EISD16 | 79.4 2.9 | CENSORS62 | EISD84 | 18.4 0.7 | CENSORS114 | EISD166 | 9.6 0.6 | ||
| CENSORS11 | EISD15 | 78.1 2.4 | CENSORS63 | EISD88 | 18.3 0.7 | CENSORS115 | EISD155 | 9.6 1.0 | ||
| CENSORS12 | EISD18 | 70.4 2.6 | CENSORS64 | EISD85 | 18.1 1.0 | CENSORS116 | EISD143 | 9.6 0.6 | ||
| CENSORS13 | EISD20 | 66.3 2.7 | CENSORS65 | EISD87 | 17.9 1.0 | CENSORS117 | EISD165 | 9.5 0.6 | ||
| CENSORS14 | EISD21 | 65.6 2.4 | CENSORS66 | EISD90 | 17.4 1.1 | CENSORS118 | EISD161 | 9.4 0.6 | ||
| CENSORS15 | EISD22 | 63.0 1.9 | CENSORS67 | EISD89 | 17.3 0.7 | CENSORS119 | EISD157 | 9.4 0.6 | ||
| CENSORS16 | EISD23 | 61.7 2.3 | CENSORS68 | EISD91 | 17.2 0.7 | CENSORS120 | EISD159 | 9.1 0.6 | ||
| CENSORS17 | EISD24 | 61.5 2.3 | CENSORS69 | EISD92 | 17.0 0.7 | CENSORS121 | EISD164 | 9.0 0.5 | ||
| CENSORS18 | EISD25 | 58.3 1.8 | CENSORS70 | EISD124* | 17.0 2.0 | CENSORS122 | EISD156 | 9.0 0.6 | ||
| CENSORS19 | EISD27 | 55.1 2.1 | CENSORS71 | EISD93 | 16.7 0.7 | CENSORS123 | EISD173 | 8.7 0.5 | ||
| CENSORS20 | EISD30 | 54.2 2.1 | CENSORS72 | EISD97 | 16.5 0.7 | CENSORS124 | EISD163 | 8.7 0.6 | ||
| CENSORS21 | EISD28 | 54.0 1.7 | CENSORS73 | EISD94 | 16.2 0.7 | CENSORS125 | EISD175 | 8.4 0.5 | ||
| CENSORS22 | EISD29 | 52.9 1.7 | CENSORS74 | EISD96 | 16.0 0.7 | CENSORS126 | EISD171 | 8.4 1.3 | ||
| CENSORS23 | EISD31 | 52.4 2.0 | CENSORS75 | EISD98 | 15.7 1.0 | CENSORS127 | EISD186 | 8.3 0.5 | ||
| CENSORS24 | EISD32 | 51.0 1.6 | CENSORS76 | EISD102 | 15.3 0.7 | CENSORS128 | EISD174 | 8.3 0.5 | ||
| CENSORS25 | EISD34 | 49.2 1.9 | CENSORS77 | EISD104 | 15.0 0.7 | CENSORS129 | EISD170 | 8.3 0.6 | ||
| CENSORS26 | EISD36 | 44.4 1.4 | CENSORS78 | EISD107 | 14.6 0.7 | CENSORS130 | EISD172 | 8.2 0.5 | ||
| CENSORS27 | EISD44* | 40.4 2.3 | CENSORS79 | EISD106 | 14.6 1.1 | CENSORS131 | EISD169 | 8.2 0.6 | ||
| CENSORS28 | EISD38 | 40.1 1.9 | CENSORS80 | EISD110 | 14.5 0.6 | CENSORS132 | EISD167 | 7.9 0.6 | ||
| CENSORS29 | EISD39 | 38.2 1.6 | CENSORS81 | EISD105 | 14.5 1.4 | CENSORS133 | EISD183 | 7.8 1.2 | ||
| CENSORS30 | EISD40 | 37.8 2.0 | CENSORS82 | EISD113 | 13.6 0.6 | CENSORS134 | EISD182 | 7.8 0.6 | ||
| CENSORS31 | EISD41 | 37.3 1.5 | CENSORS83 | EISD116 | 13.5 0.6 | CENSORS135 | EISD178 | 7.8 0.6 | ||
| CENSORS32 | EISD43 | 35.3 1.5 | CENSORS84 | EISD103 | 13.5 1.2 | CENSORS136 | EISD181 | 7.5 0.6 | ||
| CENSORS33 | EISD45 | 34.3 1.1 | CENSORS85 | EISD112 | 13.4 1.0 | CENSORS137 | EISD187 | 7.4 1.2 | ||
| CENSORS34 | EISD47 | 34.2 1.1 | CENSORS86 | EISD120 | 13.2 0.6 | CENSORS138 | EISD177 | 7.1 0.6 | ||
| CENSORS35 | EISD48 | 34.1 1.4 | CENSORS87 | EISD111 | 13.2 0.6 | CENSORS139 | EISD180 | 6.9 0.6 | ||
| CENSORS36 | EISD51 | 32.3 1.1 | CENSORS88 | EISD119 | 13.1 0.6 | CENSORS140 | EISD199 | 6.8 0.5 | ||
| CENSORS37 | EISD52 | 31.8 1.4 | CENSORS89 | EISD117 | 13.0 1.0 | CENSORS141 | EISD189 | 6.6 0.6 | ||
| CENSORS38 | EISD53 | 31.7 1.1 | CENSORS90 | EISD114 | 12.8 0.6 | CENSORS142 | EISD195 | 6.3 0.6 | ||
| CENSORS39 | EISD54 | 31.5 1.1 | CENSORS91 | EISD127 | 12.7 0.6 | CENSORS143 | EISD188 | 6.1 0.6 | ||
| CENSORS40 | EISD55 | 30.9 1.3 | CENSORS92 | EISD122 | 12.6 1.1 | CENSORS144 | EISD179 | 6.0 0.6 | ||
| CENSORS41 | EISD58 | 27.5 1.7 | CENSORS93 | EISD132 | 12.2 0.6 | CENSORS145 | EISD137* | 5.8 0.3 | ||
| CENSORS42 | EISD60 | 26.5 0.9 | CENSORS94 | EISD125 | 12.2 0.6 | CENSORS146 | EISD191 | 5.4 0.6 | ||
| CENSORS43 | EISD64 | 26.4 0.9 | CENSORS95 | EISD123 | 12.2 1.2 | CENSORS147 | EISD197 | 4.2 0.7 | ||
| CENSORS44 | EISD62 | 26.1 0.9 | CENSORS96 | EISD131 | 12.0 0.6 | CENSORS148 | EISD162 | 4.1 0.8 | ||
| CENSORS45 | EISD66 | 25.5 1.2 | CENSORS97 | EISD126 | 12.0 1.2 | CENSORS149 | EISD185 | 4.0 0.7 | ||
| CENSORS46 | EISD65 | 25.2 0.9 | CENSORS98 | EISD130 | 11.8 0.6 | CENSORS150 | EISD194 | 3.8 0.7 | ||
| CENSORS47 | EISD63 | 25.2 0.9 | CENSORS99 | EISD133 | 11.6 0.6 | CENSORS-X1 | J094651-2125 | 7.2 0.5 | ||
| CENSORS48 | EISD68 | 24.2 0.9 | CENSORS100 | EISD136 | 11.5 0.6 | CENSORS-X2 | J095233-2129 | 6.8 0.5 | ||
| CENSORS49 | EISD67 | 23.8 0.9 | CENSORS101 | EISD139 | 11.4 0.6 | CENSORS-X3 | J095240-2123 | 6.7 0.5 | ||
| CENSORS50 | EISD69 | 22.3 0.8 | CENSORS102 | EISD134 | 11.1 1.1 | CENSORS-D1 | J095218-2038 | 3.6 0.6 | ||
| CENSORS51 | EISD75 | 21.7 0.8 | CENSORS103 | EISD56* | 10.7 0.6 | J095223-2041 | 3.8 0.7 | |||
| CENSORS52 | EISD72 | 21.7 0.8 | CENSORS104 | EISD145 | 10.7 0.6 |