Chapter 1 Processing of the Signals from the Surface Detectors of the Pierre Auger Observatory
Abstract
The detectors of the surface array of the Pierre Auger Observatory are water Cherenkov tanks. The signals from each tank are read out using three photomultipliers. The energy of the primary particle is inferred from signal densities and requires good linearity of the PMTs and a large dynamic range. The absolute time of arrival of the shower front at each tank is obtained from the Global Positioning System (GPS) with a resolution of about 10 ns, ensuring an accurate primary angular reconstruction. Additionally, it is intended to use the rise time and shape of the signals to constrain the nature of the primary particle: this sets further requirements on the signal processing. In this paper, the main features of the signal processing associated with the surface detector will be presented and its performance will be discussed in the context of the extraction of shower parameters.
1. Introduction
The Cherenkov light from the water tanks of the Pierre Auger Observatory is read out by three large photomultipliers (PMTs). The 9” XP1805 Photonis PMTs have been chosen for the production array. PMTs are equipped with a resistive base having two outputs: anode and amplified last dynode. The charge ratio between the two outputs is 32. This allows a large dynamic range, extending from few photoelectrons (pe) to about pe. The high voltage (HV) is provided locally by a custom made ETL low power consumption (max 0.5 W) module. The nominal operating gain of the PMTs is 2x and can be extended to . The base, together with the HV module, is protected against humidity by silicone potting.
The signals from anode and dynode are filtered with a 5 pole anti-aliasing Bessel filter with a cut-off at 20 MHz, and digitized at 40 MHz using 10 bit Flash Analog-Digital converters (FADC). The total dynamic range is 15 bits with an overlap of 5 bits between the anode and dynode outputs. Each detector station has a digital trigger circuitry implemented with Altera ACEX100 Programmable Logical Devices (PLD), an IBM 403 PowerPC micro-controller and memory for data storage. The time information is obtained from the Global Positioning Satellite (GPS) system. The station electronics, except for the FE board, is implemented on a single board, called the Unified Board (UB). The FE board is plugged in the UB with a connector. The ensemble of electronics is packed in an aluminum enclosure. The electronics is mounted on top of the hatch cover of one of the PMTs and protected against rain and dust by an aluminum dome. In addition, each station has a Light Emitting Diode (LED) monitoring systems with two LEDs (L-7113NBC with dominant wavelength of 445 nm) placed on a window on top of the liner, in the middle of the tank. The ensemble of electronics is powered by solar energy limited to 10 W by detector station. A more detailed description of the Surface Detector electronics can be found in [1,2].
The Surface Detector ”Engineering Array” (EA) consisting of 32 water tanks has been in operation since June 2001 and the next phase, pre-production, consisting of 100 tanks with production PMTs and electronics is currently being deployed. The performance of the surface detector electronics has been demonstrated by simulations, by analysis of the EA data and by additional studies performed in various test tanks. In the following, this performance will be discussed in the context of extraction of shower parameters.
2. Dynamic range and linearity
The energy of the primary particle is inferred using the signal densities from a range of distances, including those from close (below 1000 m) to the shower core. Based on simulations, the maximum peak current at the photocathode that should be considered is about 250 nA. To have a linear PMT response up to this value, a low operating gain, 2x, is required yielding a maximum current of about 50 mA for the anode. The calibration is based on the measurement of the background muon spectrum. The maximum of the muon charge spectrum is located at the lower part of the dynamic range (dynode output). To infer the absolute calibration for the whole dynamic range a very good linearity is required for the PMTs and the electronics.
The performance of the PMTs and of their bases has been studied by using the Orsay test tank. This tank is similar to the Auger tanks and has identical LED system [3]. The linearity of a PMT can be estimated by varying the light intensity of the two LEDs (A and B) and plotting the ratio of the measured charges: (f(A+B)-f(A)-f(B))/f(A+B). The PMTs linearity is better than about 2% up to 60 mA anode current. The specifications for the PMTs were set to better than 5% linearity up to 50 mA and are confirmed in systematic tests performed for all PMTs by the Auger collaboration. The LED monitoring system implemented in each tank can be used to recheck the linearity of the PMTs and electronics.
3. Event timing
A common time base is established for different detector stations by using the GPS system. Each tank is equipped with a commercial GPS receiver (Motorola OnCore UT) providing a one pulse per second output and software corrections. This signal is used to synchronize a 100 MHz clock which is recorded at the time of each trigger. The intrinsic resolution of the system is about 8 ns requiring a good precision for the station location. An accuracy of one meter is obtained for the tank position by using the differential method. The time resolution has been studied in the EA by comparing the time signals from two tanks, Carmen and Miranda, separated by 11 m. A Gaussian distribution with a 17 ns width was obtained. This resolution combines the dispersion due to arrival angles (15 ns) and the timing resolution of each tank and confirms the expected intrinsic time dispersion of about 8 ns.
To perform an angle reconstruction, the starting points of the FADC traces need to be determined. This can be done with a resolution of about 7 ns due to the 25 ns FADC bins. Therefore, a total time resolution of 10 ns (sigma) is achieved. This time resolution is sufficient to obtain a good angular resolution, better than one degree, for the incoming primaries.
4. Signal shaping
The discrimination of the primary composition can be inferred from the ground observables related to the age of the shower, hadronic heavy primaries yielding showers with larger muon content and earlier development. Several estimators for the primary identification are currently being studied: the muon counting in the FADC traces, the analysis of the overall shape of the traces and the curvature of the shower front. The typical rise time for a muon signal is about 15 ns and decay time of the order of 80 ns. The electromagnetic signals far from the shower core are small, of the order of a few photoelectrons. It is important that the shaping of the signal preserves the characteristic rise times but is also sufficient not to lose the small electromagnetic component of the trace in the sampling.
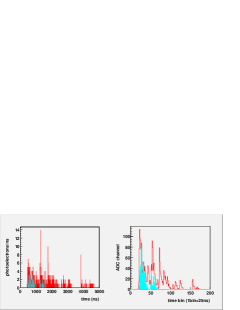
Figure 1 compares a simulated tank signal to a simulated processed signal including filter and digitization effects. Two, nearly vertical muons can be seen at around 2000 ns at the photocathode. After the filtering and digitization the amplitude of each muon peak is at around 30 channels in the dynode output. The signals after 2000 ns are at the level of one or two photoelectrons and correspond to electromagnetic component only. These signals can be found with an amplitude of around 2-4 channels in the FADC trace. The integrated ratio electromagnetic over total signal is preserved in the signal processing. In the case of the example of Fig.1, even in the late part of the signal where the electromagnetic component is small (after 2500 ns or 100 time bins) less than 10 % is lost in the signal processing. Therefore, systematic errors due to electronics in the primary identification are estimated to be negligible.
5. Conclusions
The performance of the surface detector electronics has been analyzed in the context of the extraction of shower parameters. The combination of two output signals, anode and last, amplified dynode, covers a large dynamic range (15 bits). This allows measurement of shower densities close to the core to extract the primary energy as well as to detect background muons and electromagnetic particles leaving only weak signals in the tank. The PMTs are linear up to anode currents larger than 50 mA which allows to infer accurately the calibration from the background muons for the whole dynamic range. An excellent time resolution, 10 ns, is obtained allowing an accurate angle reconstruction. Finally, the shaping and digitizing electronics preserve the weak electromagnetic signals far from shower core allowing to extract primary composition from the trace analysis.
1. Suomijärvi T., Pierre Auger Collaboration,
27th International Cosmic Ray
Conference, Contributed papers vol. 1, session HE contents, 2001, 756,
Copernicus Gesellschaft, 27. International Cosmic Ray Conference, ICRC,
Hamburg, 07-15/08/2001 and references therein.
2. Szadkowski Z. et al. Contribution to this conference.
3. Aynutdinov V. M. et al. Contribution to this conference.