First INTEGRAL observations of Cygnus X-3††thanks: Based on observations with INTEGRAL, an ESA project with instruments and science data center funded by ESA and member states (especially the PI countries: Denmark, France, Germany, Italy, Switzerland, and Spain), the Czech Republic, and Poland and with the participation of Russia and the US.
We present the first INTEGRAL results on Cyg X-3 from the PV phase observations of the Cygnus region. The source was clearly detected by the JEM-X, ISGRI and SPI detectors. The INTEGRAL observations were supported by simultaneous pointed RXTE observations. Their lightcurves folded over the 4.8 hour binary period are compatible with the mean RXTE/ASM and CGRO/BATSE light curves. We fit our broad-band X-ray/-ray spectra with a physical model, which represents the first such published model for Cyg X-3. The main physical processes in the source are thermal Comptonization and Compton reflection with parameters similar to those found for black-hole binaries at high Eddington rates.
Key Words.:
gamma rays: observations – radiation mechanisms: non-thermal – stars: individual: Cyg X-3 – X-rays: binaries – X-rays: general – X-rays: stars1 Introduction
The bright X-ray binary Cyg X-3 was discovered during an early rocket flight already in 1966 (Giacconi et al. 1967) but it remains still poorly understood. It is a massive system with the donor star and the compact object orbiting each other in a tight orbit. The system is embedded in a dense wind from the donor star, presumably a massive nitrogen-rich Wolf-Rayet star with huge mass loss (van Keerkwijk et al. 1992). The nature of the compact object is not known but recent mass estimates suggest it might be a black hole (e.g. Schmutz, Geballe & Schild 1996).
The system has been observed throughout a wide range of the electromagnetic spectrum (e.g. McCollough et al. 1999). It is one of the brightest Galactic X-ray sources, displaying high and low states and rapid variability in X-rays. It is also the strongest radio source among X-ray binaries, and shows both huge radio outbursts and relativistic jets. The most striking feature in the lightcurve is a 4.8-hr quasi-sinusoidal modulation, present both in X-rays and infrared. The modulation is believed to reflect the orbital motion of the binary with the emission from the X-ray source being scattered by the wind from the companion.
2 Observations and data analysis
On 2002 Dec. 22–23, Cyg X-3 was observed by all the X/-ray instruments aboard INTEGRAL – the JEM-X (Lund et al. 2003), IBIS/ISGRI (Lebrun et al. 2003), IBIS/PICsIT (Di Cocco et al. 2003) and SPI (Vedrenne et al. 2003). The INTEGRAL observations were supported by simultaneous RXTE/PCA and HEXTE observations making possible a comparison of the results from the two X-ray telescopes. At the time of the INTEGRAL observations, Cyg X-3 was in a relatively high state with the X-ray flux varying between 130 and 330 mCrab, according to the RXTE/ASM dwell-by-dwell data. Cyg X-3 was also observed in radio by the RATAN and Ryle telescopes. The results of the radio observations will be presented elsewhere (Hjalmarsdotter et al., in preparation).
2.1 JEM-X
The observations were performed with the second (JEM-X2) of the two identical X-ray monitors. The data were taken from 43 pointings (science windows), 2200 s each, performed between IJD 1085.6–1087.5 (IJD=fractional number of days since 2000 Jan. 1 00.00 UT, which corresponds to MJD = IJD + 51544) during the 23rd rev. of INTEGRAL (2002 Dec. 22–23), which corresponds to 10 binary periods and the net exposure of 90 ks. In a half of the pointings, Cyg X-3 was in the fully coded field-of-view (FOV, within from the FOV center), while in the rest, it was in the partially coded FOV (within from the FOV center). In all the pointings, Cyg X-1 and SAX J2103.5+4545 (an X-ray pulsar, discovered by Hulleman, in ’t Zand & Heise 1998) were from the FOV center and hence the data were not contaminated by those sources. The offsets were rather uniformly distributed as a function of the binary phase.
Source spectra were extracted individually per pointing. Then the average spectrum was obtained from the sum of the individual spectra weighted by the exposure time. The spectral response was Crab-corrected appropriately for this time period (instance 0004). The spectra were implicitly background-subtracted by a deconvolution algorithm assuming a spatially flat background. We used the energy range of 2.6–27 keV for spectral fitting.
2.2 IBIS/ISGRI
The ISGRI fully coded FOV is about , while the partially coded FOV extends up to . Standard spectral extraction is at present feasible only in the fully coded FOV, therefore we limited ourselves to the science windows where Cyg X-3 was at a distance of from the pointing direction. The selected ISGRI data contain about 40 science windows (of an average duration of 2200 s each with exception of two with 500 s duration each) for a total duration of 79 ks.
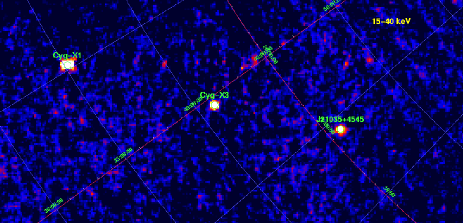
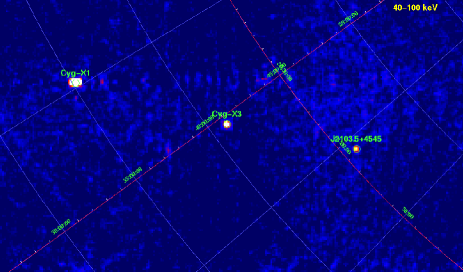
Imaging analysis was performed using the current version of the Offline Scientific Analysis (OSA) software, using the procedure described in Goldwurm et al. (2003). Cyg X-3 was detected at a high signal-to-noise in the 15–40 and 40–100 keV energy bands in this as well as in previous ISGRI observations (Goldoni et al. 2003). The source position was obtained with an offset of with respect to the catalog position. Mosaic images in the 20–40 and 40–100 keV bands are shown in Fig. 1, showing Cyg X-1, Cyg X-3, and SAX J2103.5+4545.
Spectral extraction was performed independently for every science window in 24 channels linearly rebinned in the 13–200 keV range from a 2048-channel response matrix developed at CEA/Saclay. We took the source position as obtained from the imaging procedure and then fitted source and background fluxes in each energy band. The resulting individual spectra were added to obtain the total spectrum. A 5 systematic error was then added in quadrature to each channel.
Cyg X-3 was not detected by the IBIS/PICsIT (Foschini, private comm.), which becomes efficient only at energies keV (Di Cocco et al. 2003). Given the low flux from the source above 250 keV, a significantly longer exposure would be required for detection.
2.3 SPI
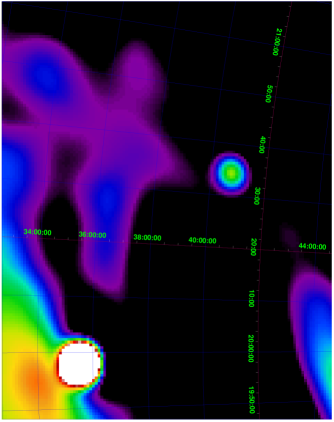
Out of the 95 dithering pointings taken during the rev. 23 on the Cygnus field, 10 had to be excluded from the SPI analysis as they were either affected by strong solar activity or by the radiation belts. This left 85 dithering pointings with a total exposure of 169 ks for the present analysis. As the SPI data are background-dominated, a careful background substraction is essential in order to get reliable results, especially for weak sources. A time-dependent background model has been applied to the data, based on the saturated events seen by the detector. The image reconstruction was done using the SPI Iterative Removal Of Sources program (SPIROS; Skinner & Connell 2003). To get precise flux values, the source positions of the two brightest sources in the field (Cyg X-1 and Cyg X-3) have been fixed to their catalogue values. No source confusion is expected in the SPI data as there are no other sources visible within around Cyg X-3. The SPI image is shown in Fig. 2.
For spectral extraction, 20 logarithmic bins in the 20–300 keV energy range have been used. The instrumental response function used here has been derived from on-the-ground calibration and then corrected based on the Crab calibration observation. A 5% systematic error has been added to the spectrum.
2.4 PCA/HEXTE
The RXTE data overlapping with the INTEGRAL observations are from two pointings on 2002 Dec. 22–23, of duration of 8224 s (data set 1) and 9584 s (data sets 2 and 3), respectively. For the second pointing, there was a change in the number of PCUs used, which required breaking it into two parts, with the lightcurves corrected to the five PCUs. The data sets 1, 2 and 3 then cover the binary phases of (0.86–0.06, 0.16–0.34), 0.47–0.67 and 0.82–1.0, respectively. Hence, data sets 2 and 3 are from around the maximum and minimum phases, respectively. The INTEGRAL spectra, accumulated from all phases, should have flux levels in the middle of that from these two sets.
A 1% systematic error has been added to the PCA spectra. The relative normalization of each of the data sets from the two HEXTE clusters with respect to the PCA data has been allowed free in the fits. The response matrices and background files have been obtained using the FTOOLS v. 5.2.
3 Lightcurves
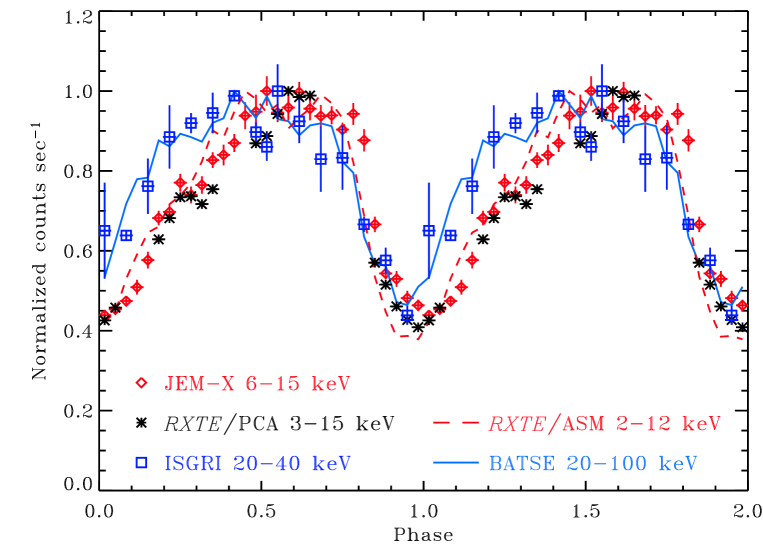
From the JEM-X observations, lightcurves in four energy bands (3–6, 6–10, 10–15 and 15–35 keV) were created. The ISGRI lightcurve was extracted in the 20–40 keV band. The lightcurves were folded using the latest published ephemeris for Cyg X-3 (Singh et al. 2002).
The results are plotted in Fig. 3. Two middle JEM-X bands were used since calibration for the 3–6 and 15–35 keV bands has not been yet consolidated. For comparison, we also plot the folded RXTE/ASM (2–12 keV) and CGRO/BATSE (20–100 keV) lightcurves from monitoring of the source during 1996–2002 and 1991–2000 respectively. The JEM-X 6–15 keV band shows good agreement with the ASM data and the ISGRI 20–40 keV follows the shape of the BATSE curve. Modelling of the lightcurves will be presented elsewhere (Hjalmarsdotter et al., in preparation).
4 Broad-band spectral modelling
-
a
The uncertainties are for 90% confidence, i.e., ; ‘f’ denotes a parameter fixed in the fit.
-
b
Calculated from the energy balance, i.e., not a free fit parameter.
-
c
Assumed in the fits.
-
d
The bolometric flux of the absorbed model spectrum.
The RXTE/PCA-HEXTE, JEM-X, ISGRI and SPI data were fitted using the XSPEC package (Arnaud 1996). We analyze here three RXTE spectra and the average INTEGRAL spectrum.
We interpret the intrinsic spectra of Cyg X-3 in terms of Comptonization of soft X-ray seed photons, assumed here to be a blackbody with a temperature, . We use a Comptonization model by Coppi (1992, 1999), eqpair, described in detail by Gierliński et al. (1999). This model was also used to fit X-ray spectra of GRS 1915+105 and Cyg X-1 by Vilhu et al. (1999), Zdziarski et al. (2001) and by Poutanen & Coppi (1998), Gierliński et al. (1999), Zdziarski et al. (2002b), respectively. In general, the electron distribution in this model can be purely thermal or hybrid, i.e., Maxwellian at low energies and non-thermal at high energies, if an acceleration process is present. This distribution, including the electron temperature, , is calculated self-consistently from the assumed form of the acceleration (if present) and from the luminosities corresponding to the plasma heating rate, , and to the seed photons irradiating the cloud, . The plasma optical depth, , includes a contribution from e± pairs. The importance of pairs depends on the ratio of the luminosity to the characteristic size, , which is usually expressed in dimensionless form as the compactness parameter, , where is the Thomson cross section and is the electron mass. Hereafter, the indices of have the same meaning as those of .
We find all the studied spectra compatible with the hot plasma being completely thermal, and with keV. Then, the pair production is negligible, and the absolute value of the compactness is only weakly important. Accordingly, we assume a constant (which is typical for accreting X-ray sources, e.g., Gierliński et al. 1999).
A complex issue in Cyg X-3 is the structure of its X-ray absorber and the presence of additional spectral components in soft X-rays (e.g. Molnar & Mauche 1986; Nakamura et al. 1993). Given that our data cover energies keV only, we neglect any additional soft X-ray components and we use a relatively simple model of the absorber. Namely, we assume that an absorbing medium with the column density, , fully covers the source, and another medium with the column, , covers a fraction, , of the source. A similar model is often used to model the similarly complex absorption of the Seyfert galaxy NGC 4151 (see, e.g. Zdziarski et al. 2002a). We assume the elemental abundances of Anders & Ebihara (1982). We include Compton reflection (Magdziarz & Zdziarski 1995), parametrized by an effective solid angle subtended by the reflector as seen from the hot plasma, , and assuming an inclination of . We also include an Fe K fluorescent line, which we model as a Gaussian (with the physical and equivalent widths of and , respectively, and the peak energy at ). We allow the reflecting medium to be ionized, using the ionization calculations of Done et al. (1992). We define the ionizing parameter as , where is the ionizing flux and is the reflector density. Given the simplified treatment of the ionized reflection of Done et al. (1992), we impose a condition of . We assume the temperature of the reflecting medium of K.
Given the above approximated treatment of the absorption and ionized reflection, the full description of the part of the spectrum keV is likely to be more complex than that given by our model. However, it provides a statistically satisfactory description of the data, including the absorbed part of the spectrum, and allows us to calculate the broad-band intrinsic spectrum of the source.
During our fits, we have found that the data, covering only photon energies keV, rather poorly constrain the temperature of the seed blackbody photons. For example, we get 0.3 keV keV within 90% confidence for the RXTE data set 1. For simplicity, we fix it at the respective best-fit value for each spectrum when determining the confidence regions of other parameters.
On the other hand, our data yield accurate spectral information only for energies keV. Thus, they poorly constrain possible electron acceleration, which can be present in the plasma in addition to the thermal heating. Nonthermal processes are, in fact, clearly observed in some other spectral states of Cyg X-3 observed by RXTE and the CGRO/OSSE (work in preparation). However, allowing for the presence of nonthermal electrons improves the fit only weakly, e.g. by for the RXTE data set 1, and thus it is not required in our models statistically. The fraction of the total power supplied to the plasma in electron acceleration is constrained to , and the power law index, , of the acceleration process is not constrained at all at 90% confidence (typical obtained values are –4). We also note that the presence of nonthermal processes in a very similar state of GRS 1915+105 is required only by the data at keV (see Fig. 3a in Zdziarski et al. 2001).
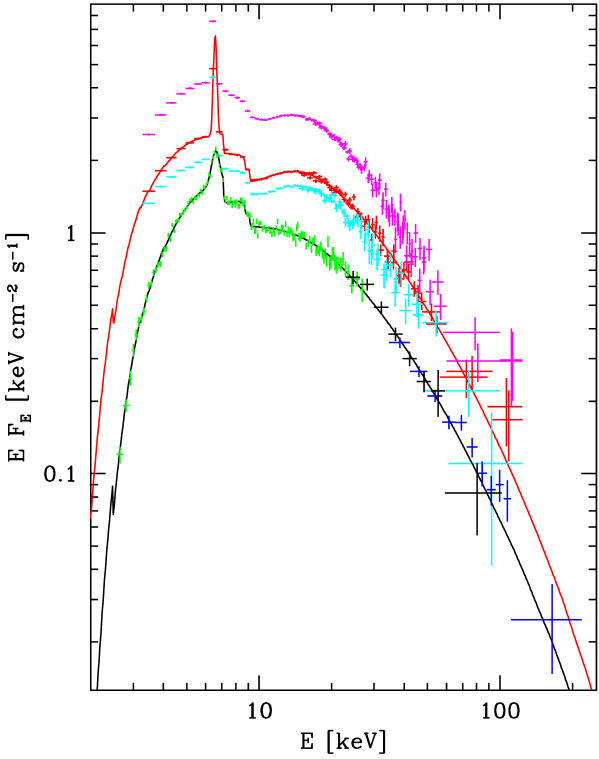
The Fe K line is found to be narrow in all the RXTE spectra, with the width much below the instrumental resolution of the PCA. The plasma parameters obtained are given in Table 1, and the spectra for the 3 data sets are shown in Fig. 4.
The INTEGRAL spectrum has been found to be rather similar in shape to the RXTE ones. However, unlike the PCA, the JEM-X data appear to require the Fe line to be broadened, with the corresponding decrease of . Thus, we have decided to allow for the broadening, but, given the limited resolution of JEM-X, we kept it then frozen at the best-fit value of keV. The resulting parameters are given in Table 1, and the spectrum is shown in Fig. 4. We see that the although the fit parameters are similar to those of the RXTE fits, the normalization of the JEM-X spectrum is lower than that the avarage of the PCA spectra by a factor of , which is due to instrumental effects, see below.
5 Comparison between individual INTEGRAL and RXTE spectra
The INTEGRAL spectra were accumulated over the entire binary orbit, unlike the three RXTE data sets (see Fig. 3). The mean flux levels of the INTEGRAL spectra should then correspond closely to the mean of the (extreme) RXTE data sets 2 and 3. However, as we see in Fig. 4, the flux level of the JEM-X spectrum is about a half of that. Furthermore, the normalizations of the HEXTE, ISGRI and SPI differ from each other, with the ISGRI spectrum having the flux level about wice of that of the average PCA. Those differences are instrumental. To facilitate appropriate corrections to the fluxes from various instruments, we list the relative normalizations between the instruments in Table 2. The relative ratio between the HEXTE and PCA spectra is consistent with previous results. The coefficients involving the INTEGRAL data correspond to the calibration as of 2003 June.
-
a
The energy range of the first of the two compared instruments used to derive the ratio.
-
b
The uncertainties are 1-.
-
c
The JEM-X spectrum should have about the same level as an average of the PCA (2) and (3) spectra, which implies the renormalization factor of 0.44.
The slopes of various spectra agree with each other well, as shown in Fig. 4. The ISGRI and SPI data fitted by a power law over the energy ranges given in Table 2 yield the photon index of with , , respectively. On the other hand, those data show hardenings at lower energies (not shown in Fig. 4), which appear related to residual inaccuracies of the present response matrices.
6 Conclusions
Cyg X-3 was clearly detected by all three X/-ray instruments on board INTEGRAL. The JEM-X 6–15 keV lightcurve folded over the orbital period shows good agreement with the RXTE/PCA 3–15 keV and RXTE/ASM 1.5–12 keV lightcurves. The ISGRI 20–40 keV folded lightcurve matches the CGRO/BATSE 20–100 keV one. A difference in the light curve profile between energies above and below 15 keV is indicated.
For the first time, we fit Cyg X-3 X/-ray spectra with a physical model. The main radiative processes implied by the INTEGRAL and RXTE data are thermal Comptonization and Compton reflection. The obtained intrinsic spectrum appears similar to that of GRS 1915+105 at a similar Eddington ratio.
At the time of writing, there are apparent differences in the normalizations between the RXTE/PCA, JEM-X, SPI and ISGRI spectra. Calibrations and responses at this stage are constantly being improved. Cyg X-3 will be further observed with INTEGRAL as a part of the Core as well as the Guest Observer programmes.
Acknowledgements.
Authors from the Observatory of the University of Helsinki acknowledge the Academy of Finland, TEKES, and the Finnish space research programme ANTARES for financial support in this research. AAZ has been supported by KBN grants 5P03D00821, 2P03C00619p1,2, PBZ-KBN-054/P03/2001, and the Foundation for Polish Science. We would like to thank M. Revnivtsev for the tools to produce the ISGRI mosaics and J. Poutanen (the referee) for valuable comments. We acknowledge quick-look results provided by the RXTE/ASM team.References
- (1) Anders, E., & Ebihara, M. 1982, Geochim. Cosmochim. Acta, 46, 2363
- (2) Arnaud, K. A. 1996, in Jacoby G. H., Barnes J., eds., Astronomical Data Analysis Software and Systems V, ASP Conf. Series Vol. 101, San Francisco, p. 17
- (3) Coppi, P. S. 1992, MNRAS, 258, 657
- (4) Coppi, P. S. 1999, in ASP Conf. Ser. Vol. 161, High Energy Processes in Accreting Black Holes, ed. J. Poutanen & R. Svensson (San Francisco: ASP), 375
- (5) Di Cocco, G., Caroli, E., Celesti, E., et al. 2003, A&A, this volume
- (6) Done, C., Mulchaey, J. S., Mushotzky, R. F., & Arnaud, K. A. 1992, ApJ, 395, 275
- (7) Hulleman, F., in ’t Zand, J. J. M., & Heise, J. 1998, A&A, 337, L25
- (8) Giacconi, R., Gorenstein, P., Gursky, H. & Waters, J. R. 1967, ApJ, 148, L119
- (9) Gierliński, M., Zdziarski, A.A., Poutanen, J., et al. 1999, MNRAS, 309, 496
- (10) Goldoni, P., Bonnet-Bidaud, J. M., Falanga, M., & Goldwurm, A. 2003, A&A, this volume
- (11) Goldwurm, A., David, P., Foschini, L., et al. 2003, A&A, this volume
- (12) Lebrun, F., Leray, J. P., Lavocat, P., et al. 2003, A&A, this volume
- (13) Lund, N., Brandt, S., Budtz-Jørgensen, C., et al. 2003, A&A, this volume
- (14) McCollough, M. L., Robinson, C. R., Zhang, S. N., et al. 1999, ApJ, 517, 951
- (15) Magdziarz, P., & Zdziarski, A. A. 1995, MNRAS, 273, 837
- (16) Molnar, L. A., & Mauche, C. W. 1986, ApJ, 310, 343
- (17) Nakamura, H., Matsuoka, M., Kawai, N., et al. 1993, MNRAS, 261, 353
- (18) Poutanen, J., & Coppi, P. S. 1998, Physica Scripta, T77, 57
- (19) Schmutz, W., Geballe, T. R., & Schild, H. 1996, A&A,311, L25
- (20) Singh, N. S., Naik, S., Paul, B., et al. 2002, A&A, 392, 161
- (21) Skinner, G. K., & Connell, P. H. 2003, A&A, this volume
- (22) van Keerkwijk, M. H., et al. 1992, Nature, 355, 703
- (23) Vedrenne, G., Roques, G., Schönfelder, V., et al. 2003, A&A, this volume
- (24) Vilhu, O., Alha, L., Malmivaara, K., et al. 1999, Astrophysical Letters Communications, 38, 241
- (25) Zdziarski, A. A., Grove, J. E., Poutanen, J., Cappi, M., & Mihara, T. 2001, ApJ, 554, L45
- (26) Zdziarski, A. A., Leighly, K. M., Matsuoka, M., Cappi, M., & Mihara, T. 2002a, ApJ, 573, 505
- (27) Zdziarski, A. A., Poutanen, J., Paciesas, W. S., & Wen, L. 2002b, ApJ, 578, 357