A Ring Shaped Embedded Young Stellar (Proto)Cluster
Abstract
We present sub-arcsec (FWHM0.5) J, H, K and L′ images of a young stellar cluster associated with a candidate massive protostar IRAS 22134+5834. The observations reveal a centrally symmetric, flattened cluster enclosing a central dark region. The central dark region is possibly a cavity within the flattened cluster. It is surrounded by a ring composed of 5 bright stars and the candidate massive protostar IRAS 22134+5834. We construct JHKL′ color-color and HK color-magnitude diagrams to identify the young stellar objects and estimate their spectral types. All the bright stars in the ring are found to have intrinsic infrared excess emission and are likely to be early to late B type stars. We estimate an average foreground extinction to the cluster of Av5 mag and individual extinctions to the bright stars in the range Av20-40 mag indicating possible cocoons surrounding each massive star. This ring of bright stars is devoid of any HII region. It is surrounded by an embedded cluster making this an example of a (proto)cluster that is in one of the dynamically least relaxed states. These observations are consistent with the recent non-axisymmetric calculations of Li & Nakamura, who present a star formation scenario in which a magnetically subcritical cloud fragments into multiple magnetically supercritical cores, leading to the formation of small stellar groups.
1 Introduction
Star formation is traditionally classified into isolated and clustered modes and the majority of stars that contribute to the galactic field population are thought to form via the clustered mode. Adams & Myers (2001)(Hereafter AM01) have recently demonstrated the importance of distinguishing large clusters (Ex: the Orion Nebula Cluster) from stellar groups and associations . These authors define stellar groups as an independent entity with the number of stars N⋆100 and show that such groups have dynamical relaxation times much smaller than their formation times. Such short dynamical relaxation times imply that small groups form and disperse quickly after the parent cloud gas removal, so the majority of these stellar groups are thought to be overlooked in observational open cluster surveys (see AM01). AM01 also suggest that stellar groups and small clusters with the number of stars N⋆100-300 may contribute to 90% of the galactic field population and state that many or most stars form in systems with 10N⋆100.
In the last few years there has been considerable progress in theoretical models and numerical simulations of multiple-star formation (Klessen et al., 1998; Li & Nakamura, 2002). These simulations predict several physical conditions and parameters that are yet to be observationally verified. In particular, Li & Nakamura (2002)(Hereafter LN02) and Li (2001) predict the formation of ring like structures in magnetically subcritical clouds leading to multiple-star formation. Finding a good example of ring like structures in star-forming regions is difficult because of the high degree of geometrical and projectional symmetry that is needed. Kumar et al. (2002) discovered one such stellar cluster with a high degree of geometrical symmetry around IRAS 22134+5834, a putative massive protostar. In this paper we present infrared photometric observations of this symmetric ring-shaped stellar cluster, which is all the more unique given its “central dark patch”. We shall use these observations to evaluate some general properties of the cluster and estimate the spectral types of the young stellar population.
2 Observations and Data Reduction
All observations presented here were made on the nights of June 25/26, 2002 with the 3.8 m United Kingdom Infrared Telescope(UKIRT) on Mauna Kea, Hawaii. J, H and K band observations were made using the facility imager UFTI which is equipped with a 10241024 HgCdTe Hawaii array. The plate scale was 0.09/pixel with a field of view (FOV) of 90. The average seeing in the K band was 0.46. L′ images were obtained using UKIRT’s secondary imager IRCAM, which has a 256256 InSb array with a plate scale of 0.08/pixel. The chop/dither pattern utilized for the observations resulted in a FOV of 38 covering the central region of the cluster. Standard data reduction procedures were followed, involving dark subtraction, division by a flat and subtraction of a sky frame. We used the DAOPHOT package in IRAF to extract J,H,K & L′ magnitudes from the data. The instrumental magnitudes were calibrated using observations of UKIRT faint standards (FS29,FS35 & FS149) (Hawarden et al., 2001) which were observed at air masses closest to the target observations. The resulting photometric data are in the natural system of the Mauna Kea Consortium Filters (Simons & Tokunaga, 2002). For the purposes of plotting these data in Fig.2 and Fig.3, we have converted them to the Bessell & Brett (1988) (BB) system since the main sequence references are in BB system. The completeness limits of the images were evaluated by adding artificial stars of different magnitudes to the images and determining the fraction of stars recovered in each magnitude bin. The recovery rate was greater than 90% for magnitudes brighter than 18, 17.5, 17 and 12 in the J, H, K and L′ bands respectively. Our observations are complete(100%) to the level of 16, 15.5, 14 and 11 magnitudes in J,H, K and L′ respectively.


3 IRAS 22134+5834: A ring like star cluster enclosing a dark patch
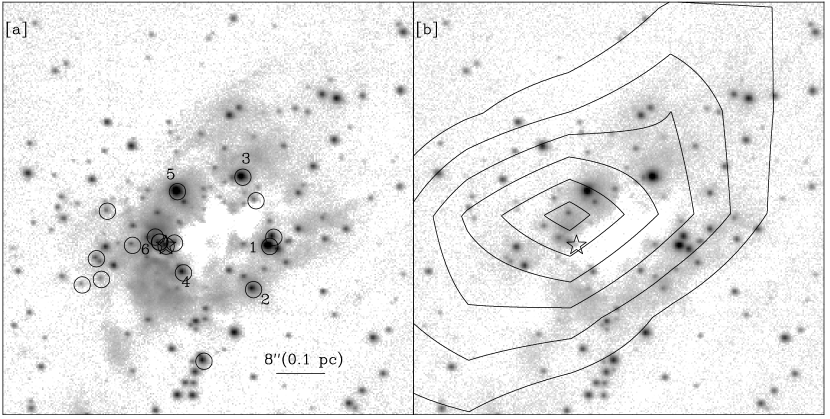
IRAS22134+5834 is a luminous Far-infrared (FIR) source (1.7103L⊙) that is characterized as a candidate precursor to an ultra-compact HII region (Sridharan et al., 2002). Situated inside a compact molecular cloud at a distance of 2.6 kpc (Sridharan et al., 2002), this source is also known to drive a massive molecular outflow (Dobashi & Uehara, 2001). FIR maps of this region at 450, 850, 1300m (Chini et al., 2001) and at 1.3mm (Beuther et al., 2002), all reveal extended elliptical flux distributions with a single resolved peak centered on the IRAS source. Figure. 1a shows our K-band image of the target. This reveals a rich, centrally symmetric embedded cluster and a central dark region associated with the FIR/(sub)mm emission. The star symbol in Fig. 1 represents the position of the FIR/(sub)mm peaks and coincides with a star visible at wavelengths longward of 1.6m. Although the FIR emission encircles the infrared dark region, there are no signatures of any condensations within the extended emission. Note the faint stars that delineate the northern triangular shaped boundary of the dark region. The neat alignment of the stars along this boundary suggests that the central dark region cannot be caused by a foreground object. Assuming that the dark region is an integral part of the cluster implies that the cluster is flattened in a plane perpendicular to the line of sight. A spherically symmetric cluster would have produced an image with several stars seen in projection against the dark patch. Thus, the image in Fig. 1 probably represents the true distribution of stars and cannot result from an arbitrary 3D distribution. The bright stars surrounding the dark patch in the image must be arranged in a true ring-like pattern around the dark patch. However, for comparision with cluster formation models we must also establish whether the dark region is an empty cavity or a molecular core?
It can be seen from the overlay of C18O contours on the H-band image (see Fig. 1b) that the dark region is immersed in the C18O emission; both the C18O emission and the dark region are elongated approximately in an east-west direction with a similar aspect ratio. Dobashi & Uehara (2001) estimated a total mass of 206M⊙ for this core and a velocity gradient of 0.9 km s-1pc-1 along the core’s major axis. Richards et al. (1987) detected strong HCO+ emission from this source, confirming the presence of a dense molecular cloud. Sridharan et al. (2002) detected NH3 (J,K)= (1,1) and (2,2) lines and measured a rotation temperature of 18K for this region. However, the peaks of these molecular line emission regions, like the FIR emission peaks, are all centered on IRAS 22134+5834 which is situated on the periphery of the ring of stars. These dust continuum and dense molecular tracers are not centered on the dark patch. These results favour the idea that the dark region is an empty cavity rather than a dense core. There is, however, one fact which suggests that the dark region is a dense core; the faint stars in Fig. 1a which delineate the northern triangular shaped boundary of the dark region are visible only in the K-band and not in the H (Compare Fig. 1a and 1b) or J bands. These stars could therefore be deeply embedded along the boundary of this dark region. Nevertheless, conclusive proof as to whether the dark patch is a cavity or a molecular core can only be obtained from a higher-resolution map of the dense molecular gas in this region.
3.1 Photometric Analysis
Inside a 100100 field centered on IRAS 22134+5834 we found 145 stars in J, 286 stars in H and 357 stars in K, with magnitude errors less than 0.2. Of these, 144 stars are found to be common to all three JHK bands and 270 stars are common to the HK bands only. Note that almost all the stars detected in the J and H bands are also detected in the K-band. Since many of the stars are detected in the K band and not in the J band, the cluster itself must be deeply embedded in the parent molecular cloud. Thus a H-K vs J-H color-color (CC) diagram can not completely identify the embedded young stellar population. However, in Fig. 2 we show a CC diagram for the 144 stars detected in the JHK bands. The solid and broken heavy curves represents the main-sequence dwarf and giant stars, respectively, and the dashed parallel lines are the reddening vectors that enclose reddened main-sequence objects. The dotted line indicates the locus of T-Tauri stars (Meyer et al., 1997). 25 stars lie outside the region of reddened main-sequence objects; these are young stellar objects (YSOs) with intrinsic color excesses . By dereddening the stars (on the CC diagrams) that fell within the reddening vectors encompassing the main sequence stars and giants, we found the visual extinction to each star. We deredenned the stars to the K6-M6 part of the sequence of stars. The individual extinction values range from 0 to 14 magnitudes. From a histogram of these values, we estimate the average foreground extinction to be Av5 mag. Similarly, for sources detected in the H, K and L′ bands, we constructed an K-L′ vs H-K CC diagram. Among the 11 stars detected in the H, K and L′ bands, 7 stars were found to be YSOs with intrinsic color excesses. Four of them show extinctions of Av20-40 mag, indicating that the individual extinctions to the cocoons that contain these stars are much higher than the average extinction through the molecular cloud that hosts the cluster. These four stars are among the bright stars that form the ring around the central dark patch. We note that all the bright stars surrounding the central dark patch in Fig. 1 are also seen in the L′ image and are found to have an intrinsic infrared excess.
Figure. 3 shows a H-K vs K color-magnitude (CM) diagram for all the sources detected in the H & K bands. YSOs found from the CC diagram (Fig. 2) are shown as star symbols. However, it is important to note that even those stars not shown with a star symbol may also be YSOs with an intrinsic color excess. The vertical solid lines (from left to right) represent the main-sequence curve reddened by 0, 20 and 40 magnitudes respectively. We have assumed a distance of 2.6 kpc and an Av5 mag to the source to reproduce the main sequence data on this plot. The CM diagram is a useful tool for estimating the nature of the stellar population within the cluster in the absence of any spectroscopic data. However, it can be highly misleading if the sources have intrinsic color excesses. In the pretext of this work, it is of interest to obtain a census of massive stars in the region. The horizontal slanting lines in Fig. 3 trace the reddening zones for each spectral type. Since the sources we are interested in have intrinsic infrared excesses, the spectral type estimation will be misleading. We therefore considered the candidate massive protostar (FIR source) IRAS 22134+5834, as the reference point on the CM diagram (marked in Fig. 2) to identify other massive stars. It can be seen that there are 6-8 points lying either above or in the same range as IRAS 22134+5834. These stars are identified on the K-band image (Fig. 1a) and are found to constitute the ring of bright stars. This suggests that there are at least four stars (appearing more massive than IRAS 22134+5834) and two stars (similar to IRAS 22134+5834) that are all situated in a ring enclosing the central dark patch. We also estimated the spectral types of the same sources on a J-H vs H CM diagram and obtained similar results thus verifying the consistency. Table. 1 lists the positions, individual extinctions, fluxes in the K and L′ bands and corresponding flux ratios indicating approximate colors. The candidate massive protostar IRAS 22134+5834 is also situated along the periphery of the ring and is estimated to be of spectral type B3. The luminosity of this FIR point source (logL = 3.23) indicates a luminosity equal to that of a Zero Age Main Sequence (ZAMS) star of B2-B3 (Panagia, 1973).
4 Discussion
The results of sections 2 and 3 show that IRAS 22134+5834 represents an embedded young star cluster associated with a luminous FIR source but not with an HII region. The K-band image reveals 208 stars in the central 1 pc region (slightly larger than the area displayed in Fig. 1). If we consider incompleteness in sampling, and volume filling factors, this cluster represents an upper limit example of a cluster with a number of stars N⋆100-300, which, according to AM01 is a small cluster, a type that contributes to the majority of the galactic field population. The embedded nature, flattened appearance of the cluster and the ring of bright stars, together with the lack of a significant HII region, demonstrates the extreme youth of this small cluster. It thus makes an excellent target for verifying predictions of the theories of cluster formation. The standard scenario for the formation of isolated low-mass stars involves an axisymmetric cloud evolution leading to a single dense core. Recently LN02 presented calculations of the non-axisymmetric evolution of a magnetically subcritical molecular cloud under thin-disk approximation (flattened cloud) fragmenting into multiple magnetically super-critical cores. Such calculations are believed to be fundamental to the formation of all varieties of star formation including singles, binaries, multiples and clusters. These authors predict that the supercritical cores resulting from fragmentation are arranged in a ring shape because the magnetic field tension prohibits the formation of a central singularity. The observations presented here tend to support their predictions since the flattened cluster of IRAS 22134+5834 shows a ring of young massive stars which has not yet formed an HII region. Further, the central dark patch appears to be a cavity rather than a core (§. 3), as predicted by LN02. Indeed, the K-band image of Fig. 1 is strikingly similar to the numerical simulations of LN02 for an arbitrary case of a perturbation with mode m=5 (Fig. 3c of LN02). Rings of stars at the center of a molecular cloud containing several jeans masses can also be seen in the numerical simulations of Klessen et al. (1998). The estimated average foreground extinction to the cluster is Av5 mag and the individual extinctions to the stars are as high as Av20-40 mag. This indicates that the massive stars composing the ring in Fig. 1 are surrounded by independent cocoons that may represent individual dense cores.
While the CM diagram estimates demonstrate that there are at least five stars in the cluster with masses similar to IRAS 22134+5834, there is no significant HII region associated with this source. The intrinsic colors of massive stars are not well understood and a CM diagram takes into account only reddening and not intrinsic colors. Thus any star with intrinsic color would move not only along the reddening line on a CM diagram but also upwards (along the y-axis) resulting in an overestimation of the mass. To evaluate the magnitude of such an overestimation we placed the candidate low mass protostars in Taurus on CM diagram by taking the K and H-K data from Park & Kenyon (2002). These Class I or Class 0 low mass protostellar sources were found to be distributed between spectral types G5 and B5. We find that a 1-2 M⊙ star can be mistaken for a 6 M⊙ star. Exactly how this behaviour transforms at higher masses can not be judged with this simple exercise. We would need a detailed understanding of the intrinsic colors of the massive young stars and some identification of their exact protostellar phases. In the present context we can only state that there are at least 5 stars with similar or higher masses than the candidate protostar IRAS 22134+5834. While the candidate protostar is bright at FIR wavelengths and not at NIR wavelengths, the remaining 4 stars are bright at 2m. Weak radio free-free emission is detected at 3.6 cm centered within 1 of the FIR source ( Kurtz, S. Pvt Communication); this is also evident in the NRAO VLA Sky Survey data. In the light of the above results, it is surprising that even this weak radio emission is centered on the FIR source and not on the other bright stars which are estimated to have masses greater than the FIR source. Further investigations to establish the clear association of these bright stars with the molecular gas, and spectroscopic studies to infer the exact spectral types of the stars, can resolve the issue. We summarize this work by noting that the cluster is associated with a ring of candidate massive young stars. While rings of massive stars are not a new phenomenon (ex: W49A Welch et al. (1987)) , a ring of candidate massive young stars devoid of ionized regions is relatively unique. IRAS 22134+5834 thus represents an early phase in massive star formation when the associated cluster is in one of the dynamically least relaxed states known.
5 Summary
Infrared photometric studies of an embedded young stellar cluster associated with IRAS 22134+5834 are presented. 1) The cluster is centrally symmetric, flattened and encloses a central dark region that appears to be an empty cavity. This dark region is surrounded by a ring of bright stars. 2) The ring of bright stars are estimated to be composed of four stars likely to be more massive than the FIR source IRAS 22134+5834 and two stars with similar masses to that of IRAS 22134+5834. However, the cluster does not have any associated HII region, implying its extreme youth. While an average foreground extinction to the cluster is estimated to be Av5 mag, extinction to the individual bright stars in the ring are as much as Av40 mag indicating cocoons of dense gas surrounding each star. 3) The results are consistent with the calculations of LN02 who present a star formation scenario in a magnetically subcritical cloud fragmenting into multiple magnetically supercritical cores leading to the formation of small stellar groups. The central dark patch in IRAS 22134+5834 and the surrounding ring of massive stars display striking similarity to the numerical simulations presented by these authors.
References
- Adams & Myers (2001) Adams, F. C., & Myers, P. C. 2001, ApJ, 553, 744 AM01
- Beuther et al. (2002) Beuther, H., Schilke, P., Menten, K. M., Motte, F., Sridharan, T. K., & Wyrowski, F. 2002, ApJ, 566, 945
- Bessell & Brett (1988) Bessell, M. S., & Brett, J. M. 1988, PASP, 100, 1134
- Chini et al. (2001) Chini, R., Ward-Thompson, D., Kirk, J. M., Nielblock, M., Reipurth, B., & Sievers, A. 2001, A&A, 369, 155
- Dobashi & Uehara (2001) Dobashi, K., & Uehara, H. 2001, PASJ, 53, 799
- Haisch et al. (2000) Haisch, K. E. Jr., Lada, E. A., & Lada, C. J. 2000, AJ, 120, 1396
- Hawarden et al. (2001) Hawarden, T. G., Leggett, S. K., Letawsky, M. B., Ballantyne, D. R., & Casali, M. M. 2001, MNRAS, 325, 563
- Klessen et al. (1998) Klessen, R. S., Burkert, A., & Bate, M. R. 1998, ApJ, 501, L205
- Kumar et al. (2002) Kumar, M. S. N., Bachiller, R., & Davis, C. J. 2002, ApJ, 576, 313
- Li (2001) Li Zhi-Yun. 2001, ApJ, 556, 813
- Li & Nakamura (2002) Li Zhi-Yun., & Nakamura, F. 2002, ApJ, 578, 256, LN02
- Meyer et al. (1997) Meyer, M. R., Calvet, N., & Hillenbrand, L. 1997, AJ, 114, 288
- Park & Kenyon (2002) Park, S., & Kenyon, S. C. 2002, AJ, 123 3370
- Panagia (1973) Panagia, N. 1973, AJ, 78, 929
- Richards et al. (1987) Richards, P. J., Little, L. T., Heaton, B. D., & Toriseva, M. MNRAS, 228, 43
- Simons & Tokunaga (2002) Simons, D. A., & Tokunaga, A. 2002, PASP, 114, 169
- Sridharan et al. (2002) Sridharan, T. K., Beuther, H., Schilke, P., Menten, K. M., & Wyrowski, F. 2002, ApJ, 566, 931
- Welch et al. (1987) Welch, Wm. J., Dreher, J. W., Jackson, J. M., Terebey, S., & Vogel, S. N. 1987, Science, 238, 1550
| ID | R. A J2000 | DEC J2000 | Av | Fλ(K) | Fλ(L′) | |
|---|---|---|---|---|---|---|
| (from Fig.1) | hh:mm:ss | dd:mm:ss | mags | Jy | Jy | |
| 1 | 22:15:6.8 | 58:49:07 | 12.1 | 0.0794 | 0.0577 | 1.2476 |
| 2 | 22:15:7.1 | 58:49:00 | 38.4 | 0.1532 | 0.0490 | 0.5492 |
| 3 | 22:15:7.3 | 58:49:18 | 0 | 0.0116 | 0.0032 | 0.4674 |
| 4 | 22:15:8.6 | 58:49:02 | 26.7 | 0.0363 | 0.0167 | 0.7910 |
| 5 | 22:15:8.7 | 58:49:16 | 13.9 | 0.1292 | 0.0655 | 0.8695 |
| 6 | 22:15:9.1 | 58:49:07 | 5.4 | 0.0021 | 0.0041 | 3.3918 |