A Common Origin for Cosmic Explosions Inferred from Fireball Calorimetry

E. Berger1    S. R. Kulkarni1    G. Pooley2    D. A. Frail3    V. McIntyre4    R. M. Wark5    R. Sari 6 A. M. Soderberg1    D. W. Fox1    S. Yost7    P. A. Price8

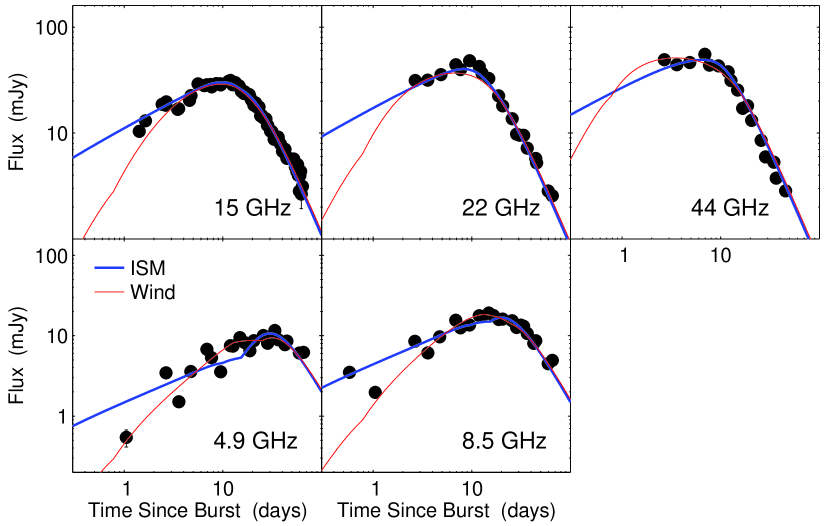
We initiated observations of the nearby GRB 030329 (z=0.1685𝑧0.1685z=0.1685) in the centimetre band approximately 13.8 hours after the burst. The log of the observations and the resulting lightcurves are displayed in Tables 1 and 2 and Figure 1. The afterglow was also observed extensively in the millimetre (100 GHz) and sub-millimetre (250 GHz) bands [Sheth et al.¡8¿]. While this is the brightest radio afterglow detected to date, the low redshift results in a peak luminosity, Lν,p(8.5GHz)1.8×1031subscript𝐿𝜈𝑝8.5GHz1.8superscript1031L_{\nu,p}(8.5\,{\rm GHz})\approx 1.8\times 10^{31} erg s-1 Hz-1, typical [Frail et al.¡9¿] of other long-duration GRBs.

The observed rapid decline, Fνt1.9proportional-tosubscript𝐹𝜈superscript𝑡1.9F_{\nu}\propto t^{-1.9} at t>10>𝑡10t\mathrel{\hbox{\hbox to0.0pt{\hbox{\lower 4.0pt\hbox{$\sim$}}\hss}\hbox{$>$}}}10 d and the decrease in peak flux at ν<22.5<𝜈22.5\nu\mathrel{\hbox{\hbox to0.0pt{\hbox{\lower 4.0pt\hbox{$\sim$}}\hss}\hbox{$<$}}}22.5 GHz (Figure 1) are the hallmarks of a collimated explosion. In this framework [Sari, Piran & Halpern¡10¿], the sharp decline (or “jet break”) occurs at the time, tjsubscript𝑡𝑗t_{j}, when Γ(tj)θj1similar-toΓsubscript𝑡𝑗superscriptsubscript𝜃𝑗1\Gamma(t_{j})\sim\theta_{j}^{-1} due to relativistic abberation (“beaming”) and rapid side-ways expansion; here ΓΓ\Gamma is the bulk Lorentz factor and θjsubscript𝜃𝑗\theta_{j} is the opening angle of the jet. We model the afterglow emission (cf. ref. ?,?) from 4.9 to 250 GHz assuming a uniform [Sari, Piran & Halpern¡10¿] as well as a “wind” [Chevalier & Li¡12¿] (particle density profile, ρr2proportional-to𝜌superscript𝑟2\rho\propto r^{-2}, where r𝑟r is the distance from the source) circumburst medium. Neither model is strongly preferred, but tj,rad9.8subscript𝑡𝑗rad9.8t_{j,\rm rad}\approx 9.8\,d is required (Figure 1).

Using the inferred particle density of n1.8𝑛1.8n\approx 1.8 cm-3 and assuming a γ𝛾\gamma-ray efficiency, ϵγ=0.2subscriptitalic-ϵ𝛾0.2\epsilon_{\gamma}=0.2 (see ref. ?) we infer θj,rad0.3similar-tosubscript𝜃𝑗rad0.3\theta_{j,{\rm rad}}\sim 0.3 rad, or 17. The kinetic energy in the explosion corrected for collimation is EK=fbEK,iso2.5×1050subscript𝐸𝐾subscript𝑓𝑏subscript𝐸𝐾iso2.5superscript1050E_{K}=f_{b}E_{K,{\rm iso}}\approx 2.5\times 10^{50} erg, where fb=[1cos(θj)]subscript𝑓𝑏delimited-[]1subscript𝜃𝑗f_{b}=[1-\cos(\theta_{j})] is the beaming fraction and EK,isosubscript𝐸𝐾isoE_{K,{\rm iso}} is the isotropic equivalent kinetic energy. This value is comparable to that inferred from modeling of other afterglows [Panaitescu & Kumar¡5¿].

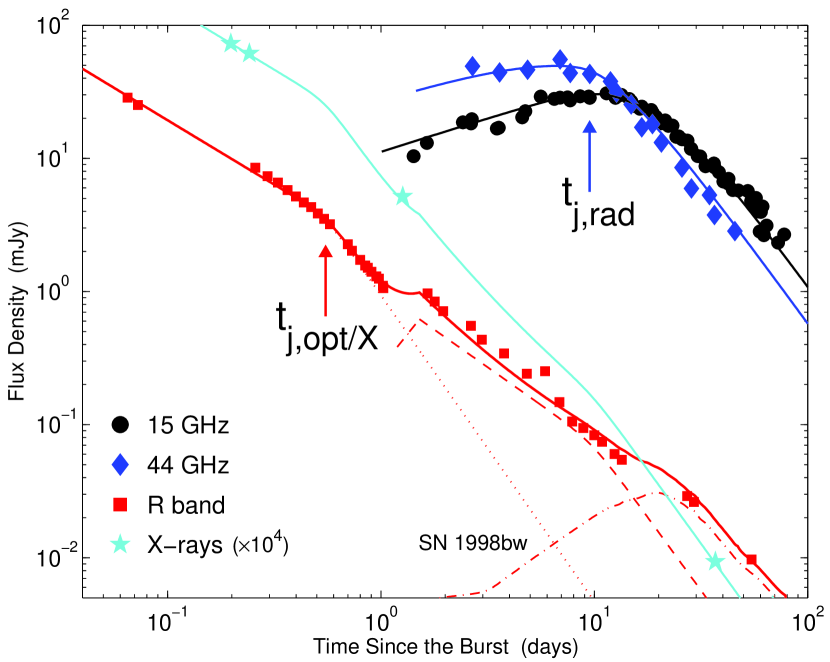
In contrast to the above discussion, Price et al. [Price et al.¡13¿] note a sharp break in the optical afterglow at t=0.55𝑡0.55t=0.55 d (Figure 2). The X-ray flux [Tiengo et al.¡14¿] tracks the optical afterglow for the first day, with a break consistent with that seen in the optical. Thus the break at 0.55 d is not due to a change in the ambient density since for typical parameters [Kumar¡15¿, Freedman & Waxman¡16¿] the X-ray emission is not sensitive to density. However, unlike the optical emission the X-ray flux at later times continues to decrease monotonically. Thus we conclude that there are two emitting components: one responsible for the early optical and X-ray emission and the other responsible for the optical emission beyond 1.5 days.

The first component, given the characteristic t2superscript𝑡2t^{-2} decay for both the X-ray and optical emission, is reasonably modeled by a jet. For the parameters used above (n𝑛n, ϵγsubscriptitalic-ϵ𝛾\epsilon_{\gamma}) the opening angle is 0.09 rad or 5superscript55^{\circ}.

The resurgence in the optical emission at 1.5 d requires a second component. An increase in the ambient density cannot explain this resurgence since the predicted decrease in radio luminosity, arising from the increase in synchrotron self-absorption, is not observed (Figure 1). An increase in the energy of the first component, for example by successive shells with lower Lorentz factors as advocated by Granot et al. [Granot, Nakar & Piran¡17¿], is ruled out by the lack [Sheth et al.¡8¿] of strong radio or millimetric emission expected [Sari & Mészáros¡18¿] from reverse shocks.

Thus, by a process of elimination, we are led to a two-component explosion model in which the first component (a narrow jet, 5superscript55^{\circ}) with initially larger ΓΓ\Gamma is responsible for the γ𝛾\gamma-ray burst and the early optical and X-ray afterglow including the break at 0.55 d, while the second component (a wider jet, 17superscript1717^{\circ}) powers the radio afterglow and late optical emission (Figure 2). The break due to the second component is readily seen in the radio afterglow, but is masked by SN 2003dh in the optical bands, thus requiring careful subtraction (Figure 2). Such a two-component jet finds a natural explanation in the collapsar model [MacFadyen, Woosley & Heger¡19¿].

The beaming-corrected γ𝛾\gamma-ray energy, emitted by the narrow jet, is only Eγ5×1049subscript𝐸𝛾5superscript1049E_{\gamma}\approx 5\times 10^{49} erg, significantly lower than the strong clustering [Bloom, Frail & Kulkarni¡3¿] around 1.3×10511.3superscript10511.3\times 10^{51} erg seen in most bursts. Similarly, the beaming-corrected X-ray luminosity [Tiengo et al.¡14¿] at t=10𝑡10t=10 hours, a proxy for the kinetic energy of the afterglow on that timescale, is LX,103×1043subscript𝐿𝑋103superscript1043L_{X,10}\approx 3\times 10^{43} erg s-1, a factor of ten below the tightly clustered values [Berger, Kulkarni & Frail¡2¿] for most other bursts. However, the second component, which is mildly relativistic (as determined by the lower energy peak of its spectrum), carries the bulk of the energy, as indicated by our modeling of the radio emission. We note that our model, with the energy in the lower Lorentz factor component dominating over the narrow ultra-relativistic component, is not consistent with “universal standard jet” model [Rossi, Lazzati & Rees¡20¿].

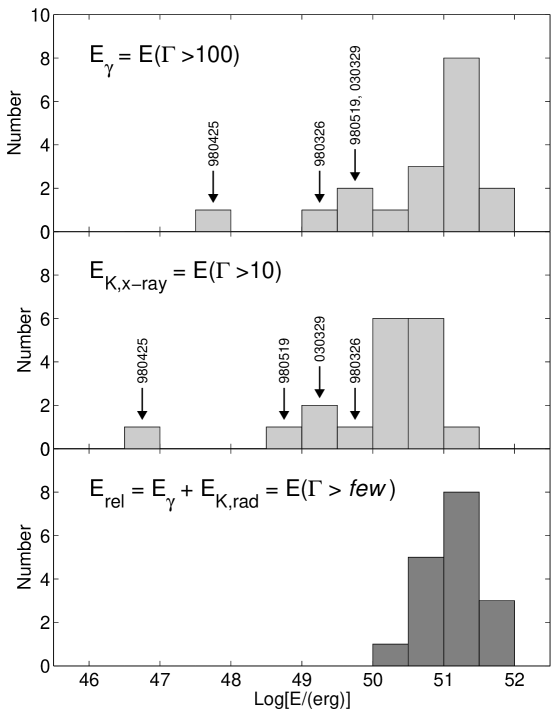
The afterglow calorimetry presented here has important ramifications for our understanding of GRB engines. Recently, we have come to recognize a sub-class of cosmological GRBs marked by rapidly fading afterglows at early time (i.e. similar to GRB 030329). These events are sub-energetic [Berger, Kulkarni & Frail¡2¿, Bloom, Frail & Kulkarni¡3¿] in Eγsubscript𝐸𝛾E_{\gamma} and early X-ray afterglow luminosity. However, as demonstrated by our calorimetry of GRB 030329, such bursts may have total explosive yields similar to other GRBs (Figure 3).

This leads to the following conclusions. First, radio calorimetry, which is sensitive to all ejecta with Γ>few>Γ𝑓𝑒𝑤\Gamma\mathrel{\hbox{\hbox to0.0pt{\hbox{\lower 4.0pt\hbox{$\sim$}}\hss}\hbox{$>$}}}few, shows that the explosive yield of the nearest “classical” event, GRB 030329, is dominated by mildly relativistic ejecta. Ultra-relativistic ejecta which produced the γ𝛾\gamma-ray emission is energetically unimportant. Second, the total energy yield of GRB 030329 is similar to those estimated for other bursts. Along these lines, the enigmatic GRB 980425 associated [Galama et al.¡4¿] with the nearby supernova SN 1998bw also has negligible γ𝛾\gamma-ray emission, Eγ,iso8×1047subscript𝐸𝛾iso8superscript1047E_{\gamma,{\rm iso}}\approx 8\times 10^{47} erg; however, radio calorimetry [Li & Chevalier¡21¿] shows that even this extreme event had a similar explosive energy yield (Figure 3). The newly recognized class of cosmic explosions, the X-ray Flashes [Heise, in ’t Zand & Kulkarni¡22¿], exhibit little or no γ𝛾\gamma-ray emission but appear to have comparable X-ray and radio afterglows to those of GRBs. Thus, the commonality of the total energy yield indicates a common origin, but apparantly the ultra-relativistic output is highly variable. Unraveling what physical parameter is responsible for the variation in the “purity” (ultra-relativistic output) of the engine appears to be the next frontier in the field of cosmic explosions.

References

  • [Frail et al.¡1¿] Frail, D. A., Kulkarni, S. R., Sari, R., Djorgovski, S. G., Bloom, J. S. et al. Beaming in Gamma-Ray Bursts: Evidence for a Standard Energy Reservoir. Astrophys. J. 562, L55–L58 November 2001.
  • [Berger, Kulkarni & Frail¡2¿] Berger, E., Kulkarni, S. R. & Frail, D. A. A Standard Kinetic Energy Reservoir in Gamma-Ray Burst Afterglows. Astrophys. J. 590, 379–385 June 2003.
  • [Bloom, Frail & Kulkarni¡3¿] Bloom, J. S., Frail, D. A. & Kulkarni, S. R. GRB Energetics and the GRB Hubble Diagram: Promises and Limitations. ArXiv Astrophysics e-prints , 2210–+ February 2003.
  • [Galama et al.¡4¿] Galama, T. J., Vreeswijk, P. M., van Paradijs, J., Kouveliotou, C., Augusteijn, T. et al. An unusual supernova in the error box of the gamma-ray burst of 25 April 1998. Nature 395, 670–672 (1998).
  • [Panaitescu & Kumar¡5¿] Panaitescu, A. & Kumar, P. Properties of Relativistic Jets in Gamma-Ray Burst Afterglows. Astrophys. J. 571, 779–789 June 2002.
  • [Stanek et al.¡6¿] Stanek, K. Z., Matheson, T., Garnavich, P. M., Martini, P., Berlind, P. et al. Spectroscopic Discovery of the Supernova 2003dh Associated with GRB 030329. ArXiv Astrophysics e-prints , 4173–+ April 2003.
  • [Hjorth & et al.¡7¿] Hjorth, J. & et al. A very energetic supernova associated with the gamma-ray burst of 29 March 2003. Nature in press (2003).
  • [Sheth et al.¡8¿] Sheth, K., Frail, D. A., White, S., Das, M., Bertoldi, F. et al. GRB 030329 at millimeter wavelengths: OVRO, BIMA, & MAMBO Observations. Submitted to ApJ (2003).
  • [Frail et al.¡9¿] Frail, D. A., Kulkarni, S. R., Berger, E. & Wieringa, M. H. A Complete Catalog of Radio Afterglows: The First Five Years. Astron. J. 125, 2299–2306 May 2003.
  • [Sari, Piran & Halpern¡10¿] Sari, R., Piran, T. & Halpern, J. P. Jets in Gamma-Ray Bursts. Astrophys. J. 519, L17–L20 July 1999.
  • [Berger et al.¡11¿] Berger, E., Sari, R., Frail, D. A., Kulkarni, S. R., Bertoldi, F. et al. A Jet Model for the Afterglow Emission from GRB 000301C. Astrophys. J. 545, 56–62 December 2000.
  • [Chevalier & Li¡12¿] Chevalier, R. A. & Li, Z. Wind Interaction Models for Gamma-Ray Burst Afterglows: The Case for Two Types of Progenitors. Astrophys. J. 536, 195–212 June 2000.
  • [Price et al.¡13¿] Price, P. A., Fox, D. W., Kulkarni, S. R., Peterson, B. A., Schmidt, B. P. et al. Discovery of the Bright Afterglow of the Nearby Gamma-Ray Burst of 29 March 2003. Nature in press (2003).
  • [Tiengo et al.¡14¿] Tiengo, A., Mereghetti, S., Ghisellini, G., Rossi, E., Ghirlanda, G. et al. The X-ray afterglow of GRB030329. ArXiv Astrophysics e-prints , 5564–+ May 2003.
  • [Kumar¡15¿] Kumar, P. The Distribution of Burst Energy and Shock Parameters for Gamma-Ray Bursts. apjl 538, L125–L128 August 2000.
  • [Freedman & Waxman¡16¿] Freedman, D. L. & Waxman, E. On the Energy of Gamma-Ray Bursts. Astrophys. J. 547, 922–928 February 2001.
  • [Granot, Nakar & Piran¡17¿] Granot, J., Nakar, E. & Piran, T. The Variable Light Curve of GRB 030329: The Case for Refreshed Shocks. ArXiv Astrophysics e-prints , 4563–+ April 2003.
  • [Sari & Mészáros¡18¿] Sari, R. & Mészáros, P. Impulsive and Varying Injection in Gamma-Ray Burst Afterglows. Astrophys. J. 535, L33–L37 May 2000.
  • [MacFadyen, Woosley & Heger¡19¿] MacFadyen, A. I., Woosley, S. E. & Heger, A. Supernovae, Jets, and Collapsars. Astrophys. J. 550, 410–425 March 2001.
  • [Rossi, Lazzati & Rees¡20¿] Rossi, E., Lazzati, D. & Rees, M. J. Afterglow light curves, viewing angle and the jet structure of γ𝛾\gamma-ray bursts. Mon. Not. R. astr. Soc. 332, 945–950 June 2002.
  • [Li & Chevalier¡21¿] Li, Z. & Chevalier, R. A. Radio Supernova SN 1998BW and Its Relation to GRB 980425. Astrophys. J. 526, 716–726 December 1999.
  • [Heise, in ’t Zand & Kulkarni¡22¿] Heise, J., in ’t Zand, J. J. M. & Kulkarni, S. R. X-ray Flashes: A New Class of Cosmic Explosions. in prep. (2003).
  • [Galama et al.¡23¿] Galama, T. J., Frail, D. A., Sari, R., Berger, E., Taylor, G. B. et al. Continued Radio Monitoring of the Gamma-Ray Burst 991208. Astrophys. J. 585, 899–907 March 2003.
  • [Sari & Esin¡24¿] Sari, R. & Esin, A. A. On the Synchrotron Self-Compton Emission from Relativistic Shocks and Its Implications for Gamma-Ray Burst Afterglows. Astrophys. J. 548, 787–799 February 2001.
  • [Henden et al.¡25¿] Henden, A., Canzian, B., Zeh, A. & Klose, S. GRB 030329, light curve flattens. GRB Circular Network 2123, 1–+ (2003).
  • [Ibrahimov et al.¡26¿] Ibrahimov, M. A., Asfandiyarov, I. M., Kahharov, B. B., Pozanenko, A., Rumyantsev, V. et al. GRB 030329, BVRI photometry. GRB Circular Network 2191, 1–+ (2003).
  • [Testa et al.¡27¿] Testa, V., Cocozza, G., Melandri, A., Antonelli, L. A., Malesani, D. et al. GRB 030329: VR Photometry at TNG. GRB Circular Network 2141, 1–+ (2003).

Acknowledgements

GRB research at Caltech is supported in part by funds from NSF and NASA. We are, as always, indebted to Scott Barthelmy and the GCN. The VLA is operated by the National Radio Astronomy Observatory, a facility of the National Science Foundation operated under cooperative agreement by Associated Universities, Inc. The Australia Telescope is funded by the Commonwealth of Australia for operations as a National Facility managed by CSIRO. The Ryle Telescope is supported by PPARC.

Epoch ΔtΔ𝑡\Delta t F1.43subscript𝐹1.43F_{1.43} F4.86subscript𝐹4.86F_{4.86} F8.46subscript𝐹8.46F_{8.46} F15.0subscript𝐹15.0F_{15.0} F22.5subscript𝐹22.5F_{22.5} F43.3subscript𝐹43.3F_{43.3}
(UT) (days) (mJy) (mJy) (mJy) (mJy) (mJy) (mJy)
Mar 30.06 0.58 3.50±0.06plus-or-minus3.500.063.50\pm 0.06
Mar 30.53 1.05 0.54±0.13plus-or-minus0.540.130.54\pm 0.13 1.98±0.17plus-or-minus1.980.171.98\pm 0.17
Apr 1.13 2.65 <0.21absent0.21<0.21 3.45±0.05plus-or-minus3.450.053.45\pm 0.05 8.50±0.05plus-or-minus8.500.058.50\pm 0.05 19.68±0.14plus-or-minus19.680.1419.68\pm 0.14 30.40±0.06plus-or-minus30.400.0630.40\pm 0.06 46.63±0.18plus-or-minus46.630.1846.63\pm 0.18
Apr 2.05 3.57 <0.30absent0.30<0.30 1.51±0.05plus-or-minus1.510.051.51\pm 0.05 6.11±0.04plus-or-minus6.110.046.11\pm 0.04 16.98±0.19plus-or-minus16.980.1916.98\pm 0.19 31.59±0.14plus-or-minus31.590.1431.59\pm 0.14 44.17±0.35plus-or-minus44.170.3544.17\pm 0.35
Apr 3.21 4.76 <0.36absent0.36<0.36 3.58±0.04plus-or-minus3.580.043.58\pm 0.04 9.68±0.03plus-or-minus9.680.039.68\pm 0.03 22.59±0.12plus-or-minus22.590.1222.59\pm 0.12 35.57±0.09plus-or-minus35.570.0935.57\pm 0.09 46.32±0.23plus-or-minus46.320.2346.32\pm 0.23
Apr 5.37 6.89 <0.40absent0.40<0.40 6.77±0.08plus-or-minus6.770.086.77\pm 0.08 15.56±0.06plus-or-minus15.560.0615.56\pm 0.06 28.58±0.20plus-or-minus28.580.2028.58\pm 0.20 44.09±0.15plus-or-minus44.090.1544.09\pm 0.15 55.33±0.43plus-or-minus55.330.4355.33\pm 0.43
Apr 6.16 7.68 <0.25absent0.25<0.25 5.34±0.10plus-or-minus5.340.105.34\pm 0.10 12.55±0.21plus-or-minus12.550.2112.55\pm 0.21 27.26±0.21plus-or-minus27.260.2127.26\pm 0.21 39.68±0.20plus-or-minus39.680.2039.68\pm 0.20 43.81±1.00plus-or-minus43.811.0043.81\pm 1.00
Apr 7.97 9.49 <0.68absent0.68<0.68 3.55±0.11plus-or-minus3.550.113.55\pm 0.11 13.58±0.09plus-or-minus13.580.0913.58\pm 0.09 28.50±0.23plus-or-minus28.500.2328.50\pm 0.23 48.16±0.23plus-or-minus48.160.2348.16\pm 0.23 43.06±1.33plus-or-minus43.061.3343.06\pm 1.33
Apr 10.38 11.90 <0.58absent0.58<0.58 7.51±0.08plus-or-minus7.510.087.51\pm 0.08 17.70±0.05plus-or-minus17.700.0517.70\pm 0.05 31.40±0.25plus-or-minus31.400.2531.40\pm 0.25 42.50±0.14plus-or-minus42.500.1442.50\pm 0.14 37.86±0.46plus-or-minus37.860.4637.86\pm 0.46
Apr 11.17 12.69 7.42±0.09plus-or-minus7.420.097.42\pm 0.09 17.28±0.10plus-or-minus17.280.1017.28\pm 0.10 29.60±0.29plus-or-minus29.600.2929.60\pm 0.29 36.84±0.16plus-or-minus36.840.1636.84\pm 0.16 31.26±0.51plus-or-minus31.260.5131.26\pm 0.51
Apr 13.35 14.87 9.49±0.13plus-or-minus9.490.139.49\pm 0.13 19.15±0.08plus-or-minus19.150.0819.15\pm 0.08 26.78±0.33plus-or-minus26.780.3326.78\pm 0.33 32.69±0.13plus-or-minus32.690.1332.69\pm 0.13 25.44±0.51plus-or-minus25.440.5125.44\pm 0.51
Apr 15.14 16.66 8.21±0.08plus-or-minus8.210.088.21\pm 0.08 17.77±0.10plus-or-minus17.770.1017.77\pm 0.10 24.50±0.31plus-or-minus24.500.3124.50\pm 0.31 17.10±0.71plus-or-minus17.100.7117.10\pm 0.71
Apr 17.20 18.72 <0.63absent0.63<0.63 6.50±0.11plus-or-minus6.500.116.50\pm 0.11 15.92±0.07plus-or-minus15.920.0715.92\pm 0.07 22.02±0.25plus-or-minus22.020.2522.02\pm 0.25 22.41±0.08plus-or-minus22.410.0822.41\pm 0.08 18.07±0.28plus-or-minus18.070.2818.07\pm 0.28
Apr 19.06 20.58 8.66±0.10plus-or-minus8.660.108.66\pm 0.10 16.08±0.06plus-or-minus16.080.0616.08\pm 0.06 18.35±0.24plus-or-minus18.350.2418.35\pm 0.24 18.03±0.11plus-or-minus18.030.1118.03\pm 0.11 13.15±0.29plus-or-minus13.150.2913.15\pm 0.29
Apr 24.18 25.70 10.04±0.08plus-or-minus10.040.0810.04\pm 0.08 15.34±0.06plus-or-minus15.340.0615.34\pm 0.06 13.93±0.26plus-or-minus13.930.2613.93\pm 0.26 13.63±0.13plus-or-minus13.630.1313.63\pm 0.13 8.54±0.48plus-or-minus8.540.488.54\pm 0.48
Apr 26.92 28.44 <0.58absent0.58<0.58 8.05±0.08plus-or-minus8.050.088.05\pm 0.08 12.67±0.09plus-or-minus12.670.0912.67\pm 0.09 11.82±0.26plus-or-minus11.820.2611.82\pm 0.26 9.75±0.23plus-or-minus9.750.239.75\pm 0.23 5.95±0.62plus-or-minus5.950.625.95\pm 0.62
Apr 28.96 30.48 10.40±0.33plus-or-minus10.400.3310.40\pm 0.33 9.53±0.21plus-or-minus9.530.219.53\pm 0.21
Apr 29.99 31.51 9.80±0.09plus-or-minus9.800.099.80\pm 0.09 13.55±0.07plus-or-minus13.550.0713.55\pm 0.07
May 2.06 33.58 11.62±0.08plus-or-minus11.620.0811.62\pm 0.08 13.10±0.06plus-or-minus13.100.0613.10\pm 0.06 9.52±0.14plus-or-minus9.520.149.52\pm 0.14
May 3.07 34.59 5.30±0.32plus-or-minus5.300.325.30\pm 0.32
May 5.00 36.52 8.90±0.08plus-or-minus8.900.088.90\pm 0.08 10.64±0.06plus-or-minus10.640.0610.64\pm 0.06 8.58±0.17plus-or-minus8.580.178.58\pm 0.17 7.20±0.09plus-or-minus7.200.097.20\pm 0.09 3.75±0.26plus-or-minus3.750.263.75\pm 0.26
May 11.03 42.55 7.72±0.13plus-or-minus7.720.137.72\pm 0.13 8.04±0.08plus-or-minus8.040.088.04\pm 0.08 7.03±0.19plus-or-minus7.030.197.03\pm 0.19
May 13.03 44.55 8.57±0.09plus-or-minus8.570.098.57\pm 0.09 8.68±0.08plus-or-minus8.680.088.68\pm 0.08 5.77±0.22plus-or-minus5.770.225.77\pm 0.22 5.75±0.10plus-or-minus5.750.105.75\pm 0.10
May 14.00 45.52 5.23±0.17plus-or-minus5.230.175.23\pm 0.17 2.84±0.23plus-or-minus2.840.232.84\pm 0.23
May 28.03 59.55 6.08±0.10plus-or-minus6.080.106.08\pm 0.10 4.48±0.09plus-or-minus4.480.094.48\pm 0.09 2.82±0.21plus-or-minus2.820.212.82\pm 0.21 2.84±0.20plus-or-minus2.840.202.84\pm 0.20
June 4.01 66.53 1.94±0.06plus-or-minus1.940.061.94\pm 0.06 6.20±0.08plus-or-minus6.200.086.20\pm 0.08 4.93±0.06plus-or-minus4.930.064.93\pm 0.06 2.56±0.12plus-or-minus2.560.122.56\pm 0.12
Table 1: Radio observations made with the Very Large Array (VLA) and the Australia Telescope Compact Array (ATCA). Observations commenced on March 30.06 UT with a single 7-hour observation with ATCA on Mar. 30.53 UT. In the initial observation we detected a point source at α𝛼\alpha(J2000)=10h44m49.95s, δ𝛿\delta(J2000)=213117.38′′superscript21superscript31superscript17.38′′21^{\circ}31^{\prime}17.38^{\prime\prime}, with an uncertainty of about 0.1 arcsec in each coordinate, consistent with the position of the optical counterpart. In all VLA observations we used the standard continuum mode with 2×502502\times 50 MHz bands. At 22.5 and 43.3 GHz we used referenced pointing scans to correct for the systematic 1020102010-20 arcsec pointing errors of the VLA antennas. We used the extra-galactic sources 3C 147 (J0542+498) and 3C 286 (J1331+305) for flux calibration, while the phase was monitored using J1111+199 at 1.43 GHz and J1051+213 at all other frequencies. The ATCA observations were performed at 4.80, 6.21, 8.26, and 9.02 GHz with a bandwidth of 64 MHz in each frequency. The phase was monitored using J1049+215, while the flux was calibrated using J1934-638. The data were reduced and analyzed using the Astronomical Image Processing System (VLA) and the Multichannel Image Reconstruction, Image Analysis and Display package (ATCA). The flux density and uncertainty were measured from the resulting maps by fitting a Gaussian model to the afterglow. In addition to the rms noise in each measurement we estimate a systematic uncertainty of about 2% due to uncertainty in the absolute flux calibration.
Epoch ΔtΔ𝑡\Delta t F15.3subscript𝐹15.3F_{15.3} Epoch ΔtΔ𝑡\Delta t F15.3subscript𝐹15.3F_{15.3}
(UT) (days) (mJy) (UT) (days) (mJy)
Mar 30.91 1.43 10.38±0.28plus-or-minus10.380.2810.38\pm 0.28 Apr 21.72 23.24 17.63±0.29plus-or-minus17.630.2917.63\pm 0.29
Mar 31.12 1.64 13.05±0.28plus-or-minus13.050.2813.05\pm 0.28 Apr 22.66 24.18 14.51±0.49plus-or-minus14.510.4914.51\pm 0.49
Mar 31.91 2.43 18.66±0.28plus-or-minus18.660.2818.66\pm 0.28 Apr 23.33 24.85 14.62±0.49plus-or-minus14.620.4914.62\pm 0.49
Apr 1.12 2.64 18.29±0.28plus-or-minus18.290.2818.29\pm 0.28 Apr 25.81 27.33 13.60±0.65plus-or-minus13.600.6513.60\pm 0.65
Apr 1.98 3.50 16.75±0.27plus-or-minus16.750.2716.75\pm 0.27 Apr 26.82 28.34 11.78±0.52plus-or-minus11.780.5211.78\pm 0.52
Apr 3.07 4.59 20.36±0.45plus-or-minus20.360.4520.36\pm 0.45 Apr 29.82 31.34 10.35±0.49plus-or-minus10.350.4910.35\pm 0.49
Apr 4.09 5.61 29.13±0.52plus-or-minus29.130.5229.13\pm 0.52 May 1.63 33.15 8.73±0.52plus-or-minus8.730.528.73\pm 0.52
Apr 4.97 6.49 27.97±0.26plus-or-minus27.970.2627.97\pm 0.26 May 4.80 36.32 9.15±0.50plus-or-minus9.150.509.15\pm 0.50
Apr 5.97 7.49 28.69±0.26plus-or-minus28.690.2628.69\pm 0.26 May 6.83 38.35 7.87±0.50plus-or-minus7.870.507.87\pm 0.50
Apr 7.06 8.58 29.29±0.49plus-or-minus29.290.4929.29\pm 0.49 May 8.73 40.25 6.70±0.50plus-or-minus6.700.506.70\pm 0.50
Apr 7.89 9.41 29.15±0.44plus-or-minus29.150.4429.15\pm 0.44 May 10.76 42.28 6.49±0.50plus-or-minus6.490.506.49\pm 0.50
Apr 9.89 11.41 30.78±0.51plus-or-minus30.780.5130.78\pm 0.51 May 15.76 47.28 5.74±0.50plus-or-minus5.740.505.74\pm 0.50
Apr 11.05 12.57 28.52±0.51plus-or-minus28.520.5128.52\pm 0.51 May 20.70 52.22 5.69±0.53plus-or-minus5.690.535.69\pm 0.53
Apr 11.88 13.40 29.92±0.44plus-or-minus29.920.4429.92\pm 0.44 May 22.76 54.28 4.78±0.78plus-or-minus4.780.784.78\pm 0.78
Apr 13.05 14.57 27.90±0.44plus-or-minus27.900.4427.90\pm 0.44 May 24.76 56.28 4.31±0.55plus-or-minus4.310.554.31\pm 0.55
Apr 13.87 15.39 24.74±0.44plus-or-minus24.740.4424.74\pm 0.44 May 25.56 57.08 5.04±0.84plus-or-minus5.040.845.04\pm 0.84
Apr 14.82 16.34 23.60±0.32plus-or-minus23.600.3223.60\pm 0.32 May 26.75 58.27 3.99±0.63plus-or-minus3.990.633.99\pm 0.63
Apr 16.96 18.48 23.06±0.24plus-or-minus23.060.2423.06\pm 0.24 May 28.76 60.28 3.96±0.58plus-or-minus3.960.583.96\pm 0.58
Apr 17.92 19.44 20.51±0.24plus-or-minus20.510.2420.51\pm 0.24 May 29.82 61.34 4.35±0.50plus-or-minus4.350.504.35\pm 0.50
Apr 19.95 21.47 19.27±0.38plus-or-minus19.270.3819.27\pm 0.38 May 30.76 62.28 2.65±0.72plus-or-minus2.650.722.65\pm 0.72
Apr 20.72 22.24 17.53±0.33plus-or-minus17.530.3317.53\pm 0.33 June 2.54 64.06 3.13±0.76plus-or-minus3.130.763.13\pm 0.76
Table 2: Radio observations at 15.3 GHz made with the Ryle Telescope at Cambridge (UK). All observations were made by interleaving 15 minutes scans of GRB 030329 with 2.5 minutes scans of the phase calibrator J1051+2119. The absolute flux scale was calibrated using 3C 48 and 3C 286. We used 5 antennas providing 10 baselines in the range 35 – 140 m. Since the position of the source is well known the in-phase component of the vector sum of the 10 baselines was used as an unbiased estimate of the flux density. The typical rms fluctuation on the signal in a 32-s integration period is approximately 6 mJy. We also add a systematic uncertainty of about 2% due to uncertainty in the absolute flux calibration.

Refer to caption


Figure 1: Radio lightcurves of the afterglow of GRB 030329. All measurements include 1σ1𝜎1\sigma error bars which in most cases are smaller than the symbols. The data are summarized in Tables 1 and 2. The solid lines are models of synchrotron emission from collimated relativistic ejecta expanding into uniform [Sari, Piran & Halpern¡10¿] (thick) and wind [Chevalier & Li¡12¿] ρr2proportional-to𝜌superscript𝑟2\rho\propto r^{-2} (thin) circumburst media; these models include the millimetre and sub-millimetre data [Sheth et al.¡8¿]. We find χr2=31.3subscriptsuperscript𝜒2𝑟31.3\chi^{2}_{r}=31.3 and 39.839.839.8 (164 degrees of freedom) for the uniform density and wind models, respectively; these include a 2%percent22\% systematic error added in quadrature to each measurement. The large values of χr2subscriptsuperscript𝜒2𝑟\chi^{2}_{r} are dominated by interstellar scintillation (ISS) at ν<15<𝜈15\nu\mathrel{\hbox{\hbox to0.0pt{\hbox{\lower 4.0pt\hbox{$\sim$}}\hss}\hbox{$<$}}}15 GHz and mild deviations from the expected smooth behavior at the high frequencies. Comparing the data and models, we find rms flux modulations of 0.25 at 4.9 GHz, 0.15 at 8.5 GHz, and 0.08 at 15 GHz, as well as a drop by a factor of three in the level of modulation from 3similar-toabsent3\sim 3 to 40 days. These properties are expected in weak ISS as the fireball expands on the sky. The inferred source size of about 20 μ𝜇\muas (i.e. 2×10¹⁷similar-toabsent2superscript1017\sim 2\times 10^{17} cm) at t15similar-to𝑡15t\sim 15 days is in close agreement with theoretical expectations [Galama et al.¡23¿]. In the uniform density model the jet break occurs at t10𝑡10t\approx 10 d corresponding to an opening angle, θj0.3subscript𝜃𝑗0.3\theta_{j}\approx 0.3 (17superscript1717^{\circ}). From the derived synchrotron parameters (at t=tj𝑡subscript𝑡𝑗t=t_{j}): νa19subscript𝜈𝑎19\nu_{a}\approx 19 GHz, νm43subscript𝜈𝑚43\nu_{m}\approx 43 GHz, Fν,m96subscript𝐹𝜈𝑚96F_{\nu,m}\approx 96 mJy we find an isotropic kinetic energy, EK,iso5.6×1051νc,131/4subscript𝐸𝐾iso5.6superscript1051superscriptsubscript𝜈𝑐1314E_{K,{\rm iso}}\approx 5.6\times 10^{51}\nu_{c,13}^{1/4} erg, a circumburst density n=1.8νc,133/4𝑛1.8superscriptsubscript𝜈𝑐1334n=1.8\nu_{c,13}^{3/4} cm-3, and the fractions of energy in the relativistic electrons and magnetic field of 0.16νc,131/40.16superscriptsubscript𝜈𝑐13140.16\nu_{c,13}^{1/4} and 0.10νc,135/40.10superscriptsubscript𝜈𝑐13540.10\nu_{c,13}^{-5/4}, respectively; here νc=1013νc,13subscript𝜈𝑐superscript1013subscript𝜈𝑐13\nu_{c}=10^{13}\nu_{c,13} is the synchrotron cooling frequency, and a constraint on Inverse Compton cooling as advocated by Sari & Esin [Sari & Esin¡24¿] indicates νc,13<1<subscript𝜈𝑐131\nu_{c,13}\mathrel{\hbox{\hbox to0.0pt{\hbox{\lower 4.0pt\hbox{$\sim$}}\hss}\hbox{$<$}}}1. The beaming-corrected kinetic energy is EK2.5×1050νc,131/4subscript𝐸𝐾2.5superscript1050superscriptsubscript𝜈𝑐1314E_{K}\approx 2.5\times 10^{50}\nu_{c,13}^{1/4} erg, typical of other well-studied long-duration GRBs [Panaitescu & Kumar¡5¿]. The parameters derived from the wind model are consistent with those from the uniform density model to within 10%percent1010\%.

Refer to caption

Figure 2: Radio to X-ray lightcurves of the afterglow of GRB 030329. The optical data, from Price et al. [Price et al.¡13¿] and the GRB Coordinates Network [Henden et al.¡25¿, Ibrahimov et al.¡26¿, Testa et al.¡27¿], have been corrected for Galactic extinction, AR=0.067subscript𝐴𝑅0.067A_{R}=0.067 mag; we note that the latter are preliminary data. The dotted line is the model proposed by Price et al. [Price et al.¡13¿] for the early optical emission, with tj,opt0.55subscript𝑡𝑗opt0.55t_{j,\rm opt}\approx 0.55 d. The dashed line is an extapolation of the uniform density model presented in Figure 1 to the optical R𝑅R-band with νc,13=2subscript𝜈𝑐132\nu_{c,13}=2; this value is somewhat larger than the rough limit discussed in Figure 1 but may be consistent with the uncertainty in the model parameters. The model in the X-ray band is based on the measured [Tiengo et al.¡14¿] optical to X-ray spectral slope and an extapolation of the uniform density model presented in Figure 1. The sharp increase in the optical flux at t<1.5<𝑡1.5t\mathrel{\hbox{\hbox to0.0pt{\hbox{\lower 4.0pt\hbox{$\sim$}}\hss}\hbox{$<$}}}1.5 d is due to the deceleration of the slower second jet component. Finally, the dot-dashed line is the optical emission from SN 1998bw at the redshift of GRB 030329, z=0.1685𝑧0.1685z=0.1685, used as a proxy for SN 2003dh [Stanek et al.¡6¿]. The solid line in the R𝑅R-band is a combination of the SN and the two jet components, whereas in the radio and millimetre bands it is the uniform density model presented in Figure 1. In the X-ray band the model is dominated by the narrow jet component. While this two-component jet model provides a reasonable fit to the data, there are still some discrepancies which can be resolved by accurate photometry and a more careful subtraction of SN 2003dh. The latter will also allow a more precise determination of the putative second jet break in the optical band at tj,radsubscript𝑡𝑗radt_{j,\rm rad}.

Refer to caption

Figure 3: Histograms of various energies measured for GRBs. We plot the beaming-corrected γ𝛾\gamma-ray energy [Bloom, Frail & Kulkarni¡3¿], Eγsubscript𝐸𝛾E_{\gamma}, the kinetic energy inferred from X-rays at t=10𝑡10t=10 hr [Berger, Kulkarni & Frail¡2¿], EK,Xsubscript𝐸𝐾𝑋E_{K,X}, and total relativistic energy, Erel=Eγ+EKsubscript𝐸relsubscript𝐸𝛾subscript𝐸𝐾E_{\rm rel}=E_{\gamma}+E_{K}, where EKsubscript𝐸𝐾E_{K} is the beaming-corrected kinetic energy inferred [Li & Chevalier¡21¿, Panaitescu & Kumar¡5¿] from the broad-band afterglow. The energy in X-rays, EK,X=LXt/ϵe(αX1)subscript𝐸𝐾𝑋subscript𝐿𝑋𝑡subscriptitalic-ϵ𝑒subscript𝛼𝑋1E_{K,X}=L_{X}t/\epsilon_{e}(\alpha_{X}-1), with t=10𝑡10t=10 hr, ϵe=0.1subscriptitalic-ϵ𝑒0.1\epsilon_{e}=0.1, and αX=1.3subscript𝛼𝑋1.3\alpha_{X}=1.3 is the median decay rate in the X-ray band. For GRB 980519 we find that the evolution of the radio emission requires a much wider jet, θj0.3similar-tosubscript𝜃𝑗0.3\theta_{j}\sim 0.3, than what is inferred from the optical, θj0.05similar-tosubscript𝜃𝑗0.05\theta_{j}\sim 0.05; here we assume z=1𝑧1z=1. We therefore infer EK2×1050similar-tosubscript𝐸𝐾2superscript1050E_{K}\sim 2\times 10^{50} erg from the radio data compared to Eγ4×1049subscript𝐸𝛾4superscript1049E_{\gamma}\approx 4\times 10^{49} erg. The γ𝛾\gamma-ray energy of GRB 980425 is an upper limit since the degree of collimation is not known. For the kinetic energy we use the value derived by Li & Chevalier [Li & Chevalier¡21¿] based on the radio evolution of SN 1998bw. There is a significantly wider dispersion in Eγsubscript𝐸𝛾E_{\gamma} and EK,Xsubscript𝐸𝐾𝑋E_{K,X} as compared to the total explosive yield. This indicates that engines in cosmic explosions produce approximately the same quantity of energy thus pointing to a common origin, but the quality of these engines, as indicated by ultra-relativistic output, varies widely.