The XMM/BeppoSAX observation of Mkn 841
Abstract
Mkn 841 has been observed simultaneously by XMM and BeppoSAX in January 2001. Due to operational contingency, the 30ks XMM observation was split into two parts, separated by about 15 hours. We first report the presence of a narrow iron line which appears to be rapidly variable between the two pointings, requiring a non-standard interpretation. We then focus on the analysis of the broad band (0.3-200 keV) continuum using the XMM/EPIC, RGS and SAX/PDS data. The Mkn 841 spectrum is well fitted by a comptonization model in a geometry more photon-fed than a simple slab geometry above a passive disk. It presents a relatively large reflection (R2) which does not agree with an apparently weak iron line. It also show the presence of a strong soft excess well fitted by a comptonized spectrum in a cool plasma, suggesting the presence of a multi-temperature corona.
1 The data
The 2001 XMM observation of Mkn 841 was split into two parts: the first one, called hereafter OBS1, was done the 13th of February and lasted 12 ks. The second observation, hereafter OBS2, was done the 14th of February and lasted 15 ks. The two observations were separated by about 15 hours.
The EPIC-pn camera was operated in Small Window mode with the thin aluminium filters. All the EPIC and RGS event files were reprocessed using SASv5.4.0. The EPIC spectra were extracted from a 40 arcsec window with PATTERN 4 and 12 for the PN and MOS respectively. There was no pile up and the background was low during the whole observation.
A simultaneous BeppoSAX observation was done between the 11th and 14th of February with a total net exposure time of 90 ks for the MECS.

The MECS light curve is reported in Fig. 1 with a binning of 2500 s. The periods of the two simultaneous XMM observations are also reported in this figure. The integrated XMM-Newton flux of Mkn 841 over the 2-10 keV range was roughly the same for the two EPIC-pn observations at about 1.4 10-11erg.s-1.cm-2. The (2-5 keV)/(5-10 keV) hardness ratio of the MECS was consistent with no spectral variability during the observation. We thus integrated the MECS and PDS spectrum over the entire observation
![[Uncaptioned image]](/html/astro-ph/0308176/assets/x2.png) |
![[Uncaptioned image]](/html/astro-ph/0308176/assets/x3.png) |
![[Uncaptioned image]](/html/astro-ph/0308176/assets/x4.png) |
|
2 A rapidly variable narrow iron line
We detect a rapidly variable narrow neutral Fe K line (Petrucci et al. 2002, hereafter P02) between OBS1 and OBS2. The line flux reaches a maximum during the first observation and is significantly reduced in the second one (cf. Fig. 2). The continuum shape and flux, instead, keep roughly constant between the two pointings. The reflexion appears to be relatively large (cf. Table 1) with R1 while the line EW is relatively small.
This results cannot be easily explained in the standard cold reflection model framework where the narrow line component is supposed to be produced far from the central black hole and is then not expected to be rapidly variable. Some (not conclusive) explanations (cf. P02 for details) are:
- •
-
•
Warped concave disc ([1])
| Model | (keV) | /dof | ||||
|---|---|---|---|---|---|---|
| pexrav | 2.04 | 115 | - | - | 2.5 | 330/301 |
| compha∗ | - | 180 | 7 | - | 4.7 | 335/301 |
| Ion. disc | 1.91 | - | - | 1.8 | 0.9 | 341/299 |
∗ the soft photon temperature is fixed to 10 eV
3 The 2-200 keV continuum
Fitting the XMM/PN data with a simple power law give a good fit to the continuum, and show very small spectral and flux variations between the two XMM observations.
To better constrain the continuum we then fit the XMM/PN and SAX/PDS simultaneously above 2 keV. We use different types of model: 1) a simple cut-off power law + reflection (pexrav model of xspec), 2) a comptonization model in slab geometry (compha, [3]), 3) the ionized disc model of Ross & Fabian (ion. disc [8])
Best fit results have been reported in Table 1.
-
•
The 3 models give acceptable fits but the ionized disc fits give the larger reduced .
-
•
The addition of a high energy cut-off in the pexrav model is required at more than 98% (following the F-test)
-
•
The comptonization fit agrees with a more photon-fed geometry (the Compton parameter is equal to 0.25) than a slab corona above a passive disk suggesting e.g. intrinsic disc emission.
-
•
We found large R values with the first two models (pexrav and compha) while the Ion Disc gives a more reasonable value R1 (however cf. next section).
| Continuum | Soft excess | N | kTbb (eV) | (keV) | /dof | ||
|---|---|---|---|---|---|---|---|
| pexrav | Black body | - | 115 | - | - | - | 1158/623 |
| Power law | 6.0 | - | 4.3 | - | - | 777/623 | |
| comptt | 5.4 | - | - | 1.3 | 3.5 | 771/622 | |
| compha | Black body | - | 120 | - | - | - | 1243/623 |
| Power law | 6.5 | - | 4.2 | - | - | 781/623 | |
| comptt | 5.1 | - | - | 0.9 | 4.6 | 771/622 | |
| Ion. Disc | Black body | - | 115 | - | - | - | 1753/623 |
| Power law | 6.5 | - | 4.3 | - | - | 863/623 | |
| comptt | 6.6 | - | - | 60 | 864/622 |
∗ in excess to the galactic one
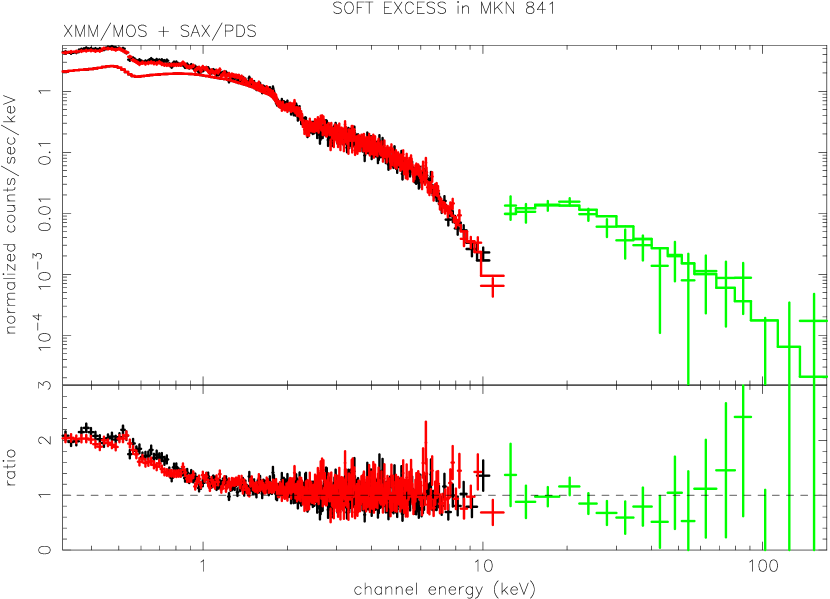
4 The soft excess
Extrapolating the best fit models obtained above 2 keV to low energy, a soft excess is always clearly present in the data (cf. Fig. 3). We found that:
-
•
It does not vary between the two XMM observations
-
•
It represents 40-50% of the 0.3-2 keV flux
-
•
No strong emission features are present in the RGS data suggesting a thermal continuum origin. Absorption features however (also observed in the EPIC data) reveal the presence of a warm absorber
We fit the soft excess (fixing the primary continuum parameters to their best fit values reported in Table 1) with different models. Results are reported in Table 2.
A simple black body is a very bad fit of the soft excess. A better fit is obtained with a comptonization spectrum (model comptt of xspec) suggesting the soft excess to be the hard tail of the disc emission comptonized in a cool (few keV) corona. We note that the ion. disc model akways gives significantly worse broad band fits (cf. Table 2) and is thus ruled out by the data.
5 Conclusion and perspective
Mrk841 has been observed simultaneously by BeppoSAX and XMM. The main results of this study can be summarize as follows (P02, Petrucci et al. [7]):
-
•
We detect the presence of a rapidly variable but narrow and neutral iron line
-
•
Our best fits suggest a photon fed geometry and give a very large reflection composant
-
•
A strong soft excess is present in the data and is better fit by a comptonized spectrum
The line variability is surprising and requires a non-standard interpretation. It has to be confirmed by new observations to better constrain its origin. A XMM observation of 75 ks has been accepted in priority B for AO3.
The presence of a large reflection component suggests either an anisotropy of the primary emission (as already proposed by Bianchi et al. [2]), or a large reflecting material solid angle (e.g. concave disc, [1]). The last case would agree with a photon-fed geometry suggested by the thermal comptonization fits. Moreover, in this framework, the line variability could be explained by the precession of the warped disc ([4]). Such geometry appears thus as an attractive explanation for the X-ray spectral shape and variability behavior of Mkn 841.
These data also suggest the presence of a multi-temperature corona, the cooler regions ( 2 keV) producing the soft excess while the hotter ones ( 200 keV) produce the hard X-ray continuum.
References
- [1] Blackman 1999, MNRAS, 306, L25
- [2] Bianchi, S., Matt, G., Haardt, F. et al. 2001, A&A, 376, 77
- [3] Haardt 1994, PhD dissertation, SISSA, Trieste
- [4] Hartnoll & Blackman 2000, MNRAS, 317, 880
- [5] Nayakshin, S. & Kazanas, D. 2001, ApJL, 553, L141
- [6] Petrucci et al. 2002, A&A, 388, L5 (P02)
- [7] Petrucci et al. 2003, in preparation
- [8] Ross & Fabian 1993, MNRAS, 261, 74
- [9] Yaqoob, T. 2001, Proc. of “New Century of X-ray Astronomy”, Japan, eds.H. Inoue, H. Kunieda, ASP Conf. Series