BeppoSAX serendipitous discovery of the X-ray pulsar SAX J1802.7–2017
Abstract
We report on the serendipitous discovery of a new X-ray source, SAX J1802.7–2017, away from the bright X-ray source GX 9+1, during a BeppoSAX observation of the latter source on 2001 September 16–20. SAX J1802.7–2017 remained undetected in the first 50 ks of observation; the source count rate in the following ks ranged between 0.04 c/s and 0.28 c/s, corresponding to an averaged 0.1–10 keV flux of ergs cm-2 s-1. We performed a timing analysis and found that SAX J1802.7–2017 has a pulse period of s, a projected semimajor axis of lt-s, an orbital period of days and a mass function . The new source is thus an accreting X-ray pulsar in a (possibly eclipsing) high mass X-ray binary. The source was not detected by previous X-ray astronomy satellites, indicating that it is likely a transient system.
1 Introduction
High mass X-ray binaries (hereafter HMXBs) are young systems, and the neutron stars (NSs) that are often hosted in them usually have a strong magnetic field ( Gauss). Accretion onto these NSs occurs via capture of stellar wind matter and Roche-lobe overflow. HMXBs comprise two main subgroups: a) the supergiant systems, and b) the Be star systems. In the supergiant systems, the companion is of spectral type earlier than B2 and has evolved off the main sequence. Orbital periods are generally less than 10 days, orbits are circular, and the mass transfer takes place because of the strong stellar wind from the OB star and/or because of “incipient” Roche Lobe overflow. The Be star systems are characterized by emission lines (mainly the Balmer series) which originate in the equatorial circumstellar envelope of the companion star. The orbital periods in these systems tend to be longer than those of group a) and correlate well with the pulsar spin period (Corbet 1986). The orbits are usually moderately eccentric. Transient activity is common in Be HMXBs; different types of outburst have been observed from different sources, and occasionally also from the same source. Giant outbursts involve high peak luminosities, occur at any orbital phase and show only little (if any) orbital modulation of the X-ray flux. Recurrent outbursts usually involve lower peak luminosities, tend to occur close to periastron and sometimes show a strong modulation of the X-ray flux with the orbital phase (see e.g. Stella, White, & Rosner 1986). To date, about 80 HMXBs are known; of them show periodic X-ray pulsations with spin periods distributed over a wide range from 69 ms to min (see Nagase 1989 for a review).
While studying the atoll source GX 9+1 with BeppoSAX, we have discovered a new X-ray pulsator in a HMXB. We report here the results of the timing analysis of this new X-ray source.
2 Observations
The observation of the GX 9+1 field was carried out from 2001 September 16 02:01:30.0 (UTC) to 2001 September 20 03:00:08.5 (UTC), using the co-aligned Narrow Field Instruments (NFIs) on board BeppoSAX. These are: a Low Energy Concentrator Spectrometer (LECS; energy range 0.1–10 keV; Parmar et al. 1997), two Medium Energy Concentrator Spectrometers (MECS; energy range 1–10 keV; Boella et al. 1997), a High Pressure Gas Scintillation Proportional Counter (HPGSPC; energy range 7–60 keV; Manzo et al. 1997), and a Phoswich Detector System (PDS; energy range 13–200 keV; Frontera et al. 1997). The exposure times were ks, ks, ks, ks, for LECS, MECS, HPGSPC and PDS, respectively. The circular field of view (FOV) of the LECS and MECS is and in diameter, respectively, while those of the HPGSPC and PDS are hexagonal with FWHM of and , respectively. The LECS and MECS detectors are position sensitive counters with imaging capability. The position reconstruction uncertainty for MECS is in the central area of radius, and in the outer region of the FOV (Boella et al. 1997). The HPGSPC and PDS systems do not have imaging capabilities, and their data are therefore difficult to interpret and analyse for individual sources when the FOV includes more than one source.
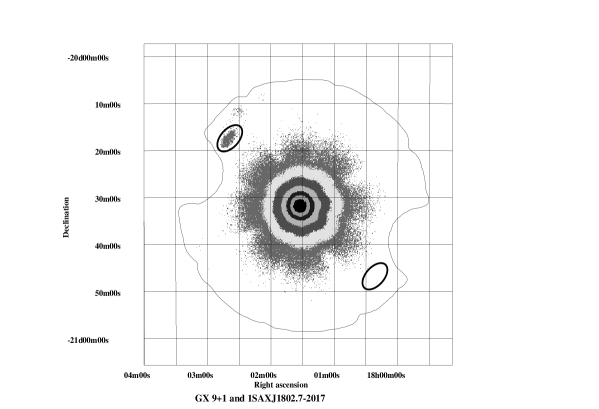
Figure 1 shows the BeppoSAX/MECS image (1-10 keV) centered at the position of the bright atoll source GX 9+1. A fainter source is visible at R.A.(2000.0)= 18h 02m 39.9s and Dec.(2000.0)= (position uncertainty ), at an angular distance from GX 9+1 of . The source was outside the FOV of the BeppoSAX/LECS. We have verified its presence in both the MECS2 and MECS3 images, which probably excludes that this was a ghost image of a source outside the MECS FOV. Moreover, we can be sure that the source was within the PDS FOV, because the source X-ray pulsations were also detected in the PDS data (see below). We searched for known X-ray sources in a circular region of centered at GX 9+1 in the SIMBAD data base. We found no known sources with a position compatible with that of the faint source; we therefore designate this serendipitous source as SAX J1802.7–2017.
We extracted the MECS events of SAX J1802.7–2017 from an elliptical region centered at R.A.(2000.0)= 18h 02m 39.9s and Dec.(2000.0)= and the background events from an elliptical region similar to the one used for the source, centered at a symmetric position with respect to the center of the MECS FOV and not contaminated by GX 9+1 (see Fig. 1). In Figure 2 the lightcurves of SAX J1802.7–2017 plus background (crosses) and of the background (stars) are shown. The source was not detected during the first 50 ks when the count rate within the extraction region ( c/s) was compatible with the background count rate. In the following ks the source count rate showed a large variability with an average intensity significantly above the background level. Two flaring events took place ks and ks from the beginning of the observation.

3 Temporal Analysis
The arrival time of all events in the MECS and PDS were corrected to the solar system barycenter. We searched for periodicities by computing a Power Spectrum Density (PSD) in the range between Hz and 1 kHz from Fast Fourier Transforms (FFTs) performed on MECS data of SAX J1802.7–2017.

A main peak at a frequency of mHz, corresponding to a period of s, is evident (see Fig. 3). The second harmonic is also clearly visible. We performed a folding search for periods centered around s finding a not well defined period, because two peaks were present at s and s, respectively.
To study possible delays in the pulse arrival times, or, equivalently, pulse period variations we divided the whole data set into 35 consecutive intervals each having a length of about 10 ks. We found that only 27 of these intervals had enough statistics to carry out the analysis described below. A folding search was performed in each interval for a range of trial periods centered around 139 s. The corresponding best periods were obtained by fitting the versus trial period curve with a Gaussian function. The best periods varied significantly and with continuity between 139.44 s and 139.86 s with an average value of 139.608 s.
Phase delays (Fig. 4) were obtained by cross-correlating the folded lightcurves obtained for each of the 27 intervals with that of the whole observation used as a template (an average pulse period of 139.608 s was adopted in the folding). Initially we fitted the phase delays using
| (1) |
where is the arrival time of the th pulse. In this formula the linear term and the quadratic term are related to a correction to the pulse period and the derivative of the pulse period, respectively. We obtained a of 2.6 indicating that the modulation of the phase delays cannot only be explained by the presence of a derivative of the pulse period. Moreover we find a value of of yr-1, more than an order of magnitude larger than the largest measured value in any known X-ray pulsar (i.e. yr-1 in GX 1+4, see Pereira et al. 1999). We checked whether the modulation of the phase delays could be explained by the propagation delays due to the orbital motion of the X-ray pulsar around a companion star by fitting the phases with
| (2) |
The results of the fit are reported in Table 1. The was 1.3. Since , we find lt-s; the corrected pulse period was s.
| Parameter | Value |
|---|---|
| days-1 | |
| days | |
| lt-s | |
| MJD | |
| s |

We tried to add a quadratic term to expression (2) to take into account a spin period derivative, but, because of the small number of points and a relatively short observation, we could not constrain all parameters of the fit. In any case, by fixing the quadratic term in the range – days-2 (corresponding to a in the range – yr-1) we found that the orbital parameters do not change significantly ( changes in the orbital period value and in the value) with respect to the parameters reported in Table 1.
We corrected the arrival times of all the events, observed by the MECS and PDS instruments, to the center of mass of the binary system using the orbital parameters and the corrected pulse period reported in Table 1. We then re-computed, on the corrected folded lightcurves, the phase delays, and found that they are compatible with zero phase delay (see Fig. 5). This suggests that our data are compatible with a circular orbit, although an eccentricity could be present but not appreciated because of the relatively low statistics of our data. To estimate a rough upper limit to the eccentricity of the system, we fitted our phase delays substituting the circular orbital correction in equation (2) with a first-order approximation of the eccentric orbital correction (see e.g. van der Klis & Bonnet-Bidaud 1984), thus obtaining (90% confidence level) and .

Using the estimated pulse period we folded the MECS lightcurves in the energy bands 1–3 keV, 3–6 keV and 6–10 keV, and the PDS lightcurves in the energy bands 13–25 keV and 25–80 keV, excluding the first 50 ks of our observation. The main pulse of the modulation presents a peak around phase 0.6. A secondary peak is visible around phase 0.1, which appears to be more prominent at higher energies. The pulse fraction, defined as , with and the maximum and minimum count rate, are %, %, %, %, and % in the 1–3 keV, 3–6 keV, 6–10 keV, 13–25 keV, and 25–80 keV energy band, respectively. The pulse fraction in the 13–25 keV and 25–80 keV energy bands is strongly reduced by the presence of GX 9+1 in the PDS FOV (note however that the pulse fraction between 25–80 keV is somewhat higher because GX 9+1 is weaker at these energies). In Figure 6 we show the folded lightcurves in the energy bands 1–3 keV, 3–6 keV, 6–10 keV and 25–80 keV.

4 Discussion
We have discovered a serendipitous source, SAX J1802.7–2017, in a BeppoSAX/NFI observation of the bright atoll source GX 9+1. SAX J1802.7–2017 shows coherent pulsations at a period of 139.612 s, indicating that the compact object in this system is most likely an accreting magnetic NS. Pulse arrival times show a sinusoidal modulation at a period of 4.6 days, which we interpret as due to the orbital motion of the source. The values of the orbital period and of the pulse period, as well as the pulse fraction in the MECS energy range (), are consistent with the values usually found for HMXB systems (e.g. Oosterbroek et al. 1999; Bildsten et al. 1997).
The mass function of the system is
where is the companion star mass, is the gravitational constant and is the ratio of the compact object mass to the companion mass. The value of the mass function is not compatible with the system being a cataclysmic variable in which a white dwarf is orbiting a companion. For a NS mass of 1.4 M⊙ we have estimated a lower limit on the companion star mass, (90% confidence level), typical of a HMXB. The epoch of the NS superior conjunction (which would correspond to the mid-eclipse time) derived from the fit of the orbital parameters falls during the first 50 ks of our observation, when the count rate of SAX J1802.7–2017 is compatible with the background count rate. This is compatible with the possible presence of an eclipse during the first 50 ks. Assuming that the eclipse ends days after the beginning of our observation (52168.69 MJD, see Fig. 2) and taking into account that the zero epoch is days, the half duration of the eclipse should be days. The half-angle of the eclipse subtending the portion of circular orbit covered by the source is rad. The eclipse duration is related to the inclination angle of the system by: , where is the radius of a spherical primary star and is (approximately) the separation between the two stars (see Primini et al. 1976). Then a rough lower limit on the companion star radius is .
To estimate the luminosity of the source we performed a spectral analysis in the MECS range using the correct effective area for the position of the source in the MECS FOV (G. Cusumano, private communication). Although the low statistics of the data did not allow an accurate spectral analysis, we inferred a luminosity of erg/s over the 1.8–10 keV range by fitting the data to a power law (photon index and cm-2) and assuming a source distance of 10 kpc. The lightcurve of the system shows a large variability suggesting that the system could be accreting via a stellar wind. This is also suggested by its long pulse period and relatively short orbital period, typical of HMXBs accreting via stellar wind such as Vela X–1 and 4U 1538–52 (see e.g. Corbet 1986; Nagase 1989). Indeed SAX J1802.7–2017 shows similarities to 4U 1538–52, which has a long spin period of s, a short orbital period of days, and a mass of for the companion star (Reynolds, Bell, & Hilditch 1992). However, while the averaged luminosity of 4U 1538–52 and Vela X–1 is around ergs s-1, the averaged luminosity of SAX J1802.7–2017 measured during our observation is at least one order of magnitude lower (assuming an upper limit to the distance of 10 kpc). The source seems therefore to be quite underluminous with respect to massive binaries accreting via stellar wind, although more observations are needed to confirm this conclusion.
Note that, as the source has not been reported by other X-ray astronomy satellites before (in particular we did not find any detected source at the position of SAX J1802.7-2017 in ROSAT images, although the field of GX 9+1 was not observed by ASCA) it might well be a transient HMXB. Most of the transient HMXBs are Be-star systems (Liu et al. 2000). However, if SAX J1802.7–2017 belongs to this class it should be atypical considering that its orbital period and pulse period do not follow the Corbet correlation (Corbet 1986). Note also that the presence of an eccentricity cannot be excluded by our data, and more observations are needed to confirm the orbital parameters of the source.
References
- (1) Bildsten, L., Chakrabarty, D., Chiu, J., Finger, M. H., Koh,D. T., Nelson, R. W., et al. 1997, ApJS, 113, 367
- (2) Boella, G., Butler, R. C., Perola, G. C., et al. 1997a, A&AS, 122, 299
- (3) Corbet, R.H.D. 1986, MNRAS, 220, 1047
- (4) Frontera, F., Costa, E., dal Fiume, D., et al. 1997, A&AS, 122, 357
- (5) Leahy, D. A., Darbro, W., Elsner, R. F., et al. 1983, ApJ, 266, 160
- (6) Liu, Q. Z., van Paradijs, J., van den Heuvel, E.P.J. 2000, A&AS, 147, 25
- (7) Manzo, G., Giarrusso, S., Santangelo, A., et al. 1997, A&AS, 122, 341
- (8) Nagase, F. 1989, PASJ, 41, 1
- (9) Oosterbroek, T., Orlandini, M., Parmar, A. N., et al. 1999, A&AS, 351, L33
- (10) Parmar, A. N., Martin, D. D. E., Bavdaz, M., et al. 1997, A&AS, 122, 309
- (11) Pereira, M.G., Braga, J., Jablonski, F., et al. 1999, ApJL, 526, L105
- (12) Primini, F., Rappaport, S., Joss, P. C., et al. 1976, ApJ, 210, L71
- (13) Reynolds, A. P., Bell, S. A., & Hilditch, R. W. 1992, MNRAS, 256, 631
- (14) Stella, L., White, N. E., & Rosner, R. 1986, ApJ, 308, 669
- (15) van der Klis, M., & Bonnet-Bidaud, J. M. 1984, A&A, 135, 155