Photometrical Review of Open Cluster M25
Abstract
The young open star cluster M25 (IC 4725) is located in the direction of the galactic center in a crowded region, near much irregular absorption features on Sagittarius arm. This cluster has some difficult observing problems due to its southern location. The mass data available in the literature have been gathered to reinvestigate this cluster using most photometric tools to determine its main photometric parameters. This system is found to be at a distance of 600 pc from the sun; distance of -52.82 pc from the galactic plane; and the median age is 9.45 x 10⁷ yr. More than 220 stars with mean reddening of 0.50 mag and absorption of 1.62 mag are found within the cluster.
keywords:
Open clusters and associationsPACS:
98.20.-d , 98.20.Di , 36.40.Vz, , , ,
Phone: +202 5560645; Fax: +202 5548020††thanks: E-mail: amiosman@mailer.scu.eun.eg (A.I. Osman)††thanks: E-mail: mohmarie@mailer.scu.eun.eg (M.A. Marie)††thanks: E-mail: astro1@frcu.eun.eg (S.M. Hassan)
1. Introduction
The galactic cluster M25 is a moderately young open star cluster (Sandage 1963 San63 ). Its 2000.00 position on the celestial sphere is and . The Palomar Observatory Sky Survey (POSS-print) shows that the cluster M25 has several bright stars and many of intermediate brightness superposed upon numerous faint background stars. This system has a lot of irregular interstellar matter due to its location near the galactic plane (Landolt 1964 Lan64 ; Schmidt 1977 Sch77 ). Also, there is a dark lane of absorbing matter passing near the center of the cluster (Serkowski 1965 Ser65 ; Schmidt 1982 Sch82 ). A Cepheid Variable (U-Sgr) with a period of 6.745241d lies near the center of the cluster (Wallerstein 1957 Wal57 ; Shobbrook 1992 Sho92 ).
Many previous studies have been performed on this cluster since 1957, e.g. Feast 1957 Fea57 ; Wallerstein 1957 Wal57 ; Irwin 1958 Irw58 ; Sandage 1960 San60 ; Johnson 1960a Joh60a ; Wampler et al. 1961 Wam61 ; Landolt 1964 Lan64 ; Serkowski 1965 Ser65 ; Graham 1967 Gra67 ; Schmidt 1977 Sch77 ; van den Bergh 1978 Van78 ; Schmidt 1982 Sch82 ; Stephen 1989 Ste89 ; Luck et al. 2000 Luc00 ; and Tadross et al. 2002 Tad02 .
It is noted that there is a deficiency of observations in U-band, and only observations down to 15.5th visual magnitude are available. This certainly will make it difficult to define the main sequence of the cluster and consequently affect the estimation of the main photometric parameters. So, the main data of van den Bergh (1978)Van78 , Landolt (1964)Lan64 and Stephen (1989)Ste89 have been used after being reduced to van den Bergh’s system in the present study.
2. Photometric analysis of M25
2.1. Reddening
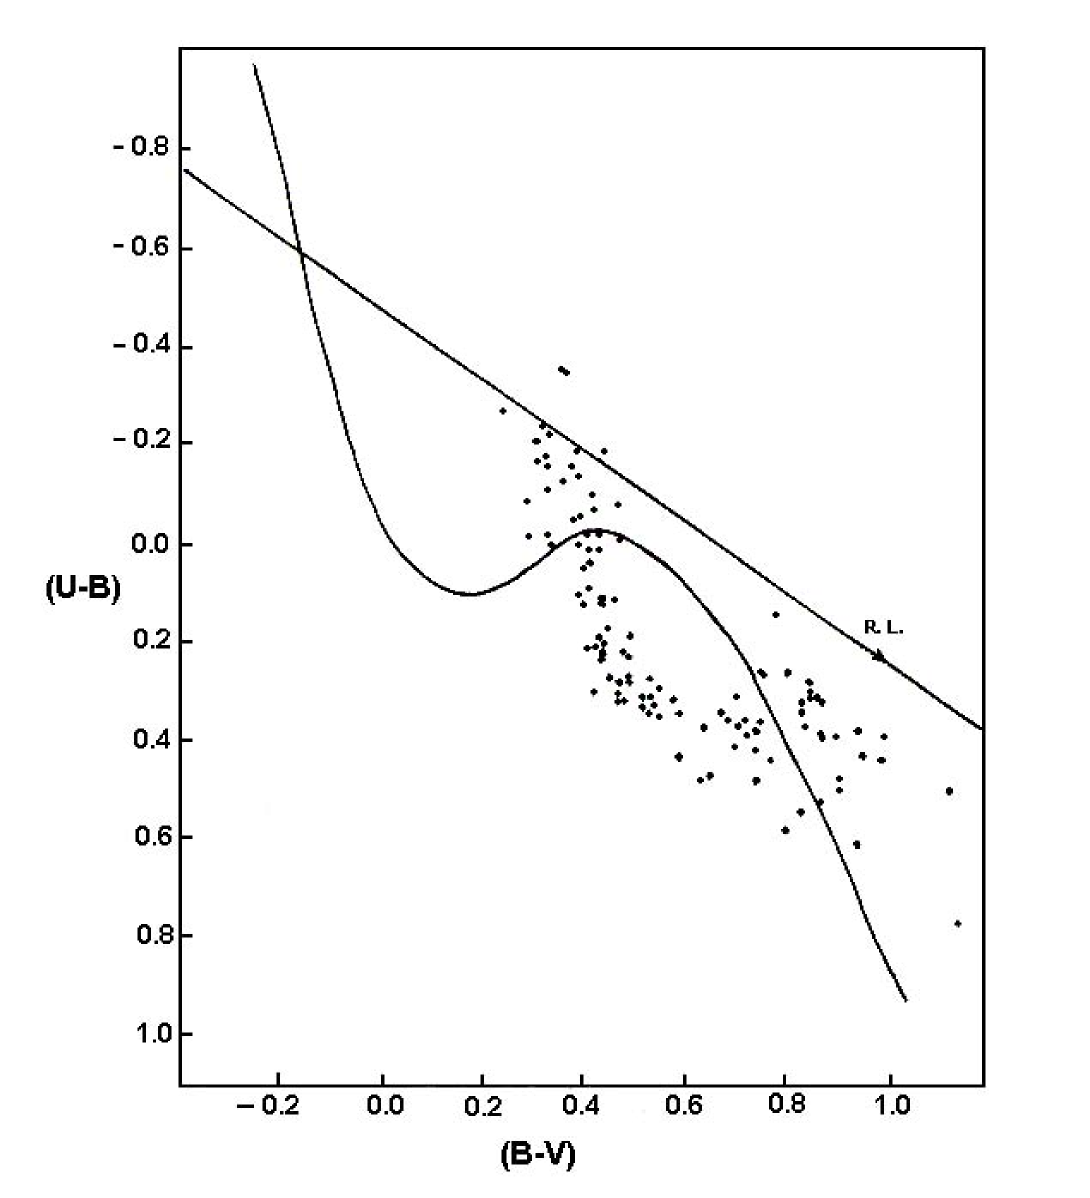
The interstellar reddening across the cluster has been determined using its color-color diagram (CCD), as shown in Fig 1. The curve represents the standard zero age main sequence (ZAMS) as taken from Schmidt-Kaler (1982)SchK82 . The slope of the reddening line has been considered to be 0.72, as given by Johnson & Morgan (1953)Joh53 . A line parallel to the reddening line has been drawn for every point on the CCD. The intersection of this line with the ZAMS-curve gives the intrinsic values of the color indices assuming that the star lies on the main sequence. The reddening of any star lying below the kink of the ZAMS-curve is ambiguous and may have two or three possible values. For this reason, the best reading that is consistent with the cluster distance has been accepted.
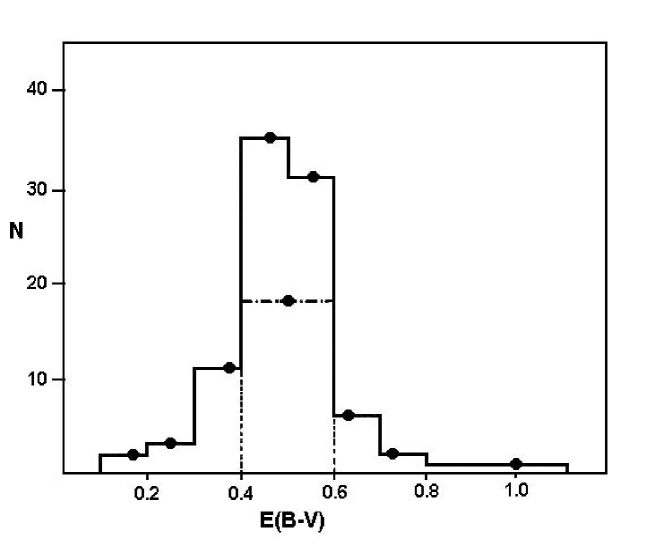
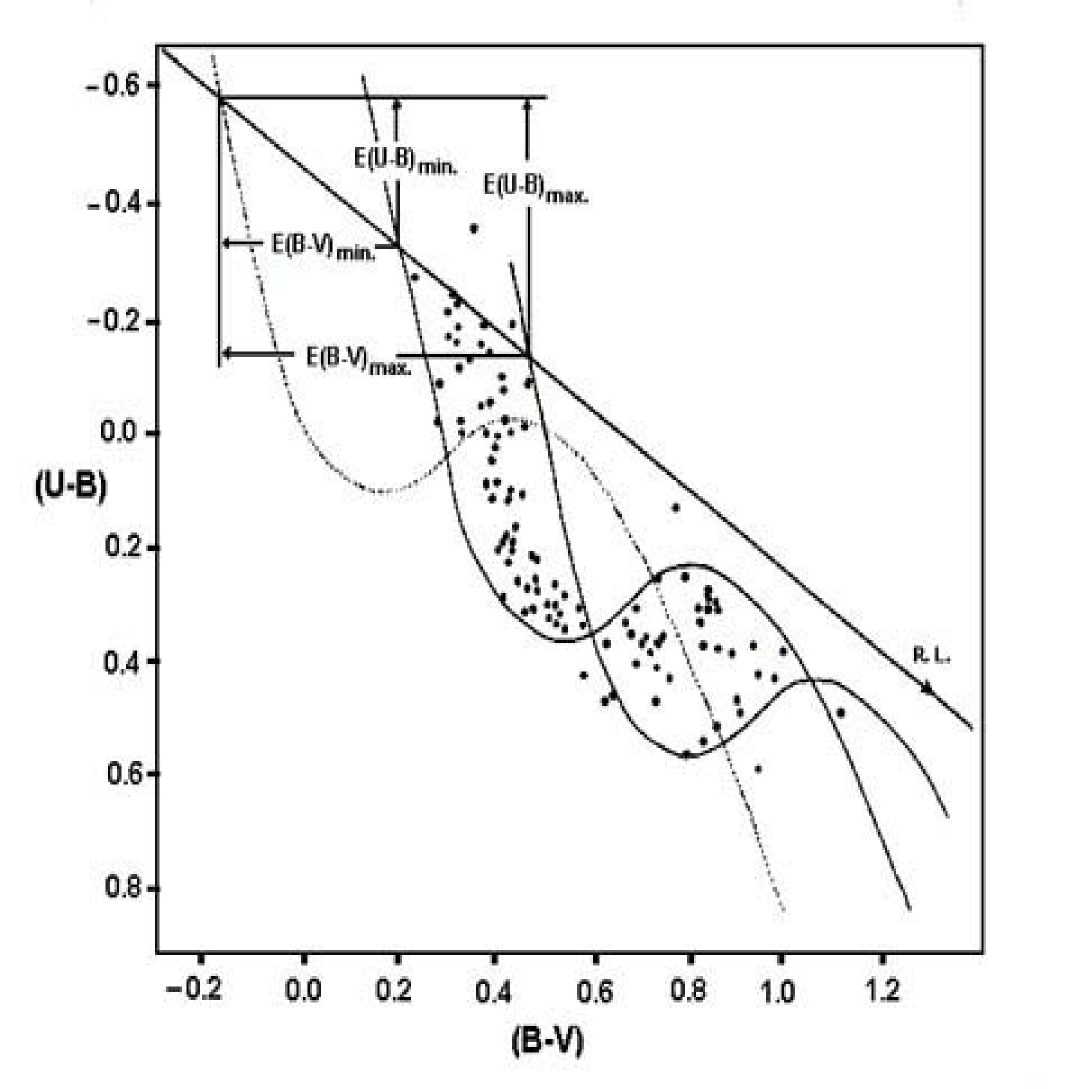
§ A histogram of E(B-V) has been constructed for all members of the cluster. A range of the reddening from 0.30 mag to 0.70 mag has been obtained as shown in Fig 2. The model value for all the cluster stars is 0.48 mag (solid line), and 0.50 mag (dashed line) for the members with unambiguous reddening. The maximum and minimum values of the reddening estimated by Burki’s method (1975)Bur75 , Fig 3, come out to be 0.63 mag & 0.37 mag respectively. The difference between the maximum and minimum reddening has found to be E(B-V)= 0.26 mag, which is larger than the natural dispersion of the cluster (0.11 mag) according to Burki’s criterion. This indicates that the reddening across the cluster is non-uniform.
§ The Q-method of Johnson & Morgan (1953)Joh53 has been applied to estimate the maximum and minimum reddening of the cluster. It’s found E(B-V)max= 1.20 mag & E(B-V)min= 0.35 mag. Also the difference between the maximum and minimum excesses, E(B-V), is found to be greater than Burki’s (1975)Bur75 limit of the natural dispersion.
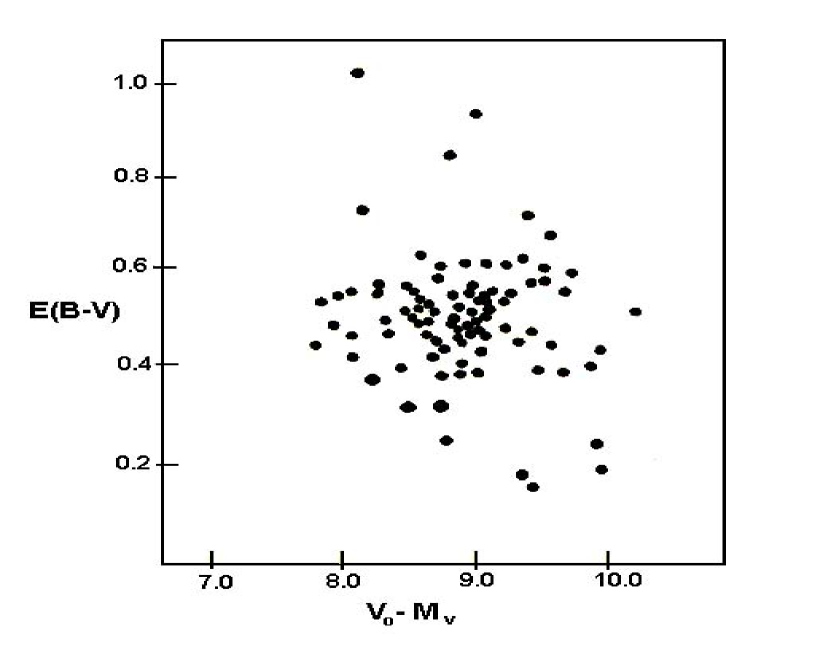
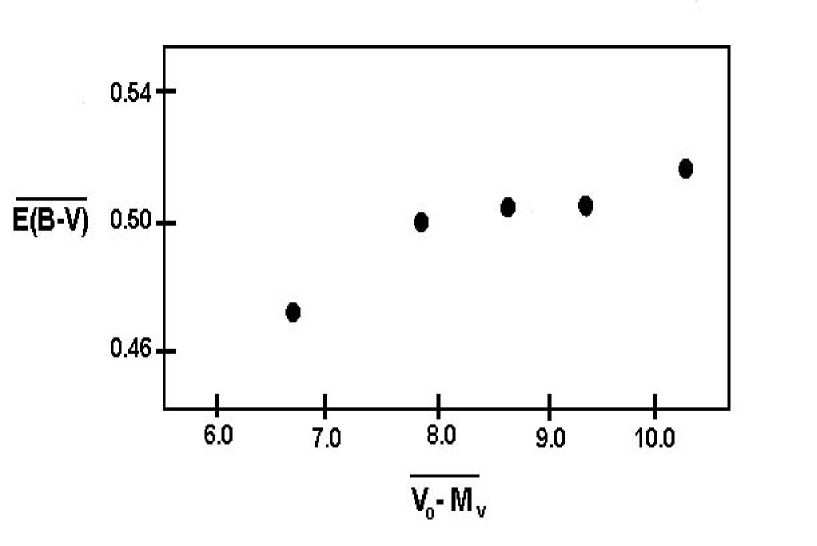
§ From the relation between the color excesses and the distance modulii of the cluster members, Fig 4; the reddening is found to range from 0.15 to 1.00 mag, and the mean excess changes with the mean distance from 0.47 to 0.52 mag, Fig 5.
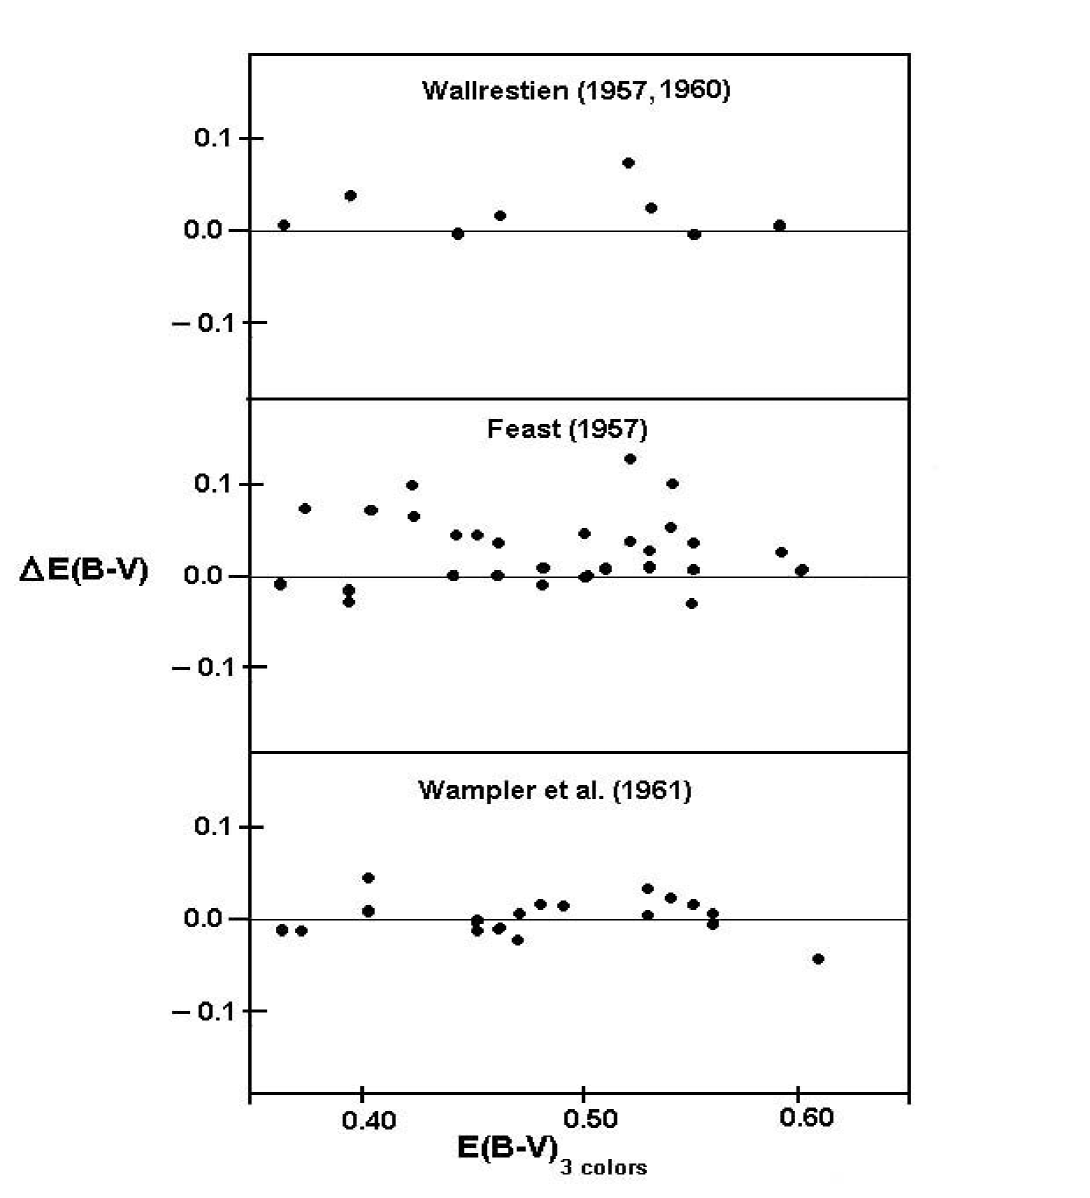
§ The cluster reddening has been also estimated from the spectral classifications of Wampler et al (1961)Wam61 , Feast (1957)Fea57 , Wallerstien (1957)Wal57 , and Wallerstien (1960)Wal60 data. The mean value of the reddening has been calculated to be 0.47 mag (18 stars), 0.45 mag (29 stars) and 0.46 mag (8 stars) respectively. Intercomparisons of E(B-V) values for the three investigators have been established in the sense of 3-color photometric data minus the spectroscopic ones as shown in Fig 6. In this respect, we found that Wampler’s spectroscopic data is in a good agreement with the photometric data than those of Feast and Wallerstien.
The mean reddening value of the cluster has been taken to be 0.50 mag, which is in a good agreement with those obtained above. It coincides with Johnson & Beckers’ methods (see section 3).
2.2. Interstellar absorption
It is assumed that there is a constant ratio between the total visual absorption Av and the color excess E(B-V), which depends on the nature of the dust grains. Blanco (1955)Bla55 has shown that this ratio is not always constant and it seems to be uniform except for a very few anomalous directions in the sky; e.g., Orion nebula. Moffat & Schmidt-Kaler (1976)Mof76 have revised the ratio of total visual absorption to selective color excess in the long wavelength band from the relation [Av/E(B-V)=R ] assuming the constant R is 3.25 for most directions in the sky. Applying this relation in the direction to the cluster under investigation, the total visual absorption Av is found equal 1.62 mag.
3. Distance
According to Johnson’s (1960b)Joh60b method, the reddening can be obtained by shifting the standard CCD-curve of Schmidt-Kaler (1982)SchK82 on to the apparent CCD-curve of the cluster in the direction of the reddening line; the slope of this line has been considered to be 0.72 as explained by Johnson & Morgan (1953)Joh53 ; this yields an excess of 0.50 mag. From the coincidence of the corrected sequence of the cluster’s color-magnitude diagram, CMD-curve, with the standard one of Schmidt-Kaler (1982)SchK82 , the apparent distance modulus is found to be 10.55 mag. Subtracting the total visual absorption, the true distance modulus is found to be 8.93 mag.
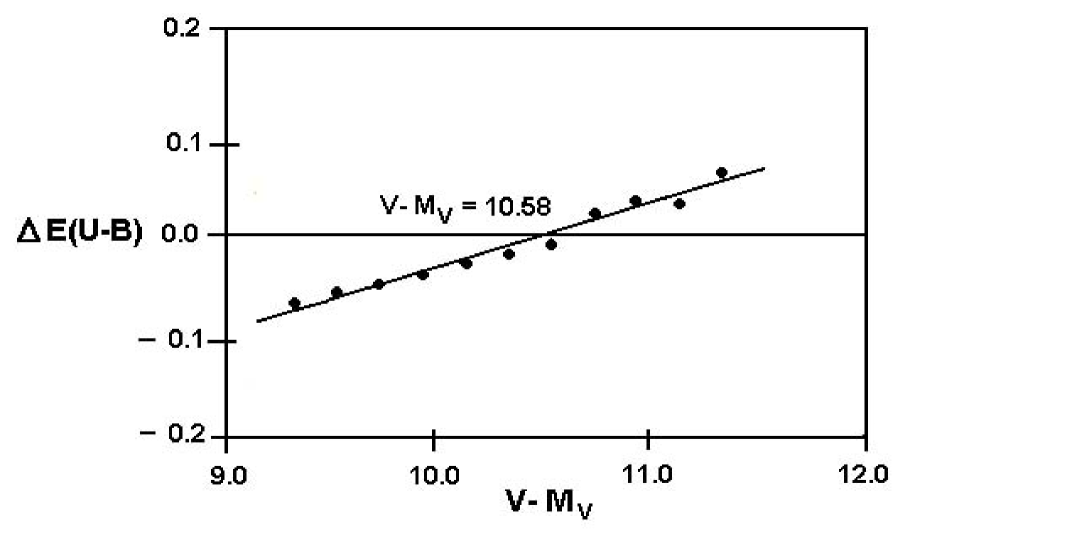
§ Becker’s (1972)Bec72 method has been applied, where the intrinsic standard CMDs of Schmidt-Kaler (1982)SchK82 have been superposed on the apparent ones of the cluster [V,(B-V) & V,(U-B)] under some conditions assumed by Becker & Stock (1954)Bec54 . The well known Becker’s table has been constructed, Table 1, where the apparent distance modulii V-Mv in the first column are plotted versus E(U-B)o-c values in the last column, Fig 7. The true apparent distance at which E = 0.0 is found to be 10.58 mag; it’s conforming with a color excess of about 0.50 mag. After subtracting the total visual absorption, the true distance modulus is found to be 8.96 mag.
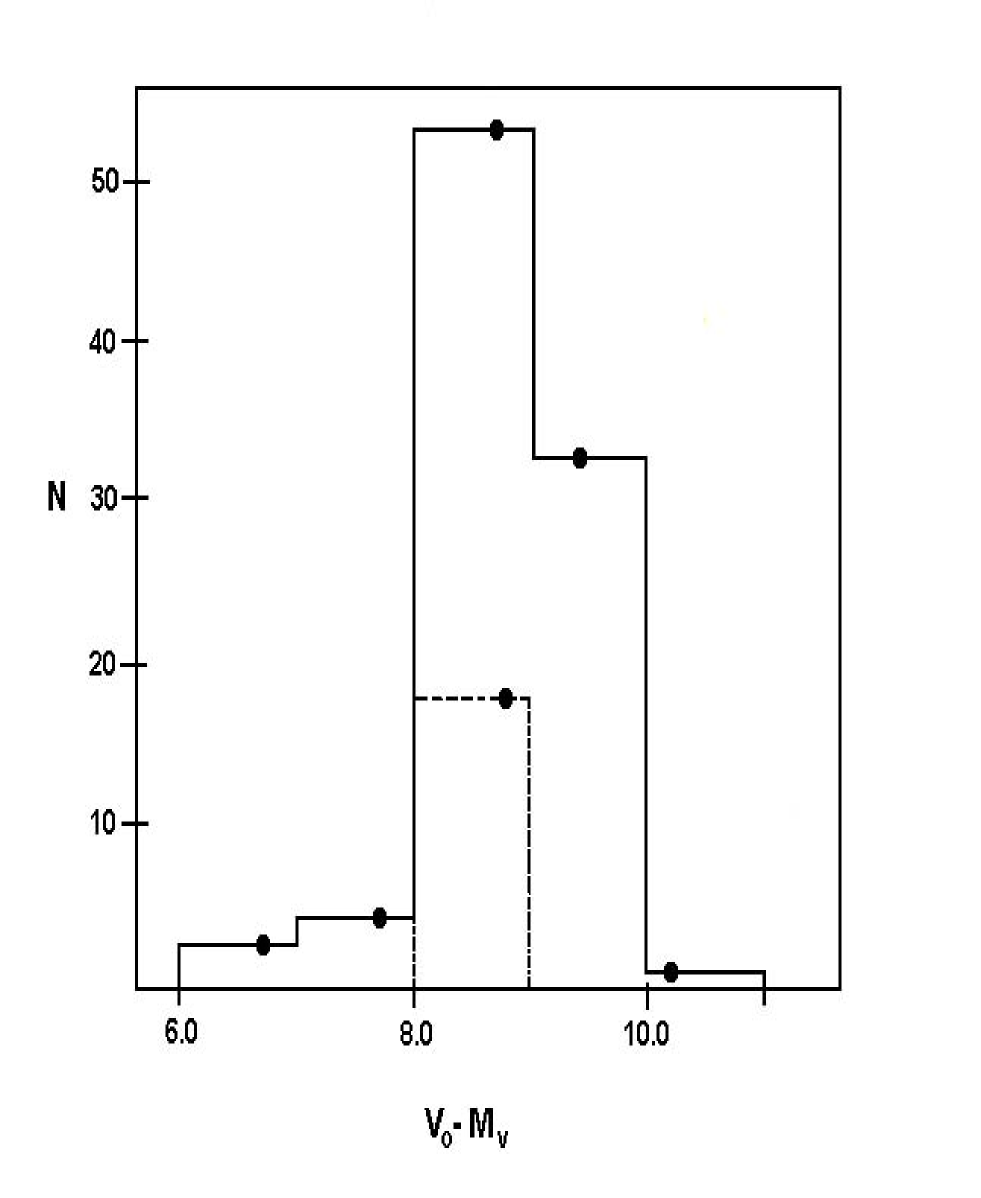
§ A histogram of Vo-Mv has been constructed for all the cluster members as shown in Fig 8. The model value for the cluster is found to be 8.65 mag (solid line), while for unambiguous members (stars which are above the kink of the CCD-curve as shown in Fig 1), it is found to be 8.75 mag (dashed line). Then the mean distance modulus is equal to 8.70 mag.
§ From the relation between the distance modulii and color excesses, Fig 5, we could infer that the cluster modulus has a distance range from 7.75 mag to 10.20 mag and, as a consequence, an average value of 8.98 mag.
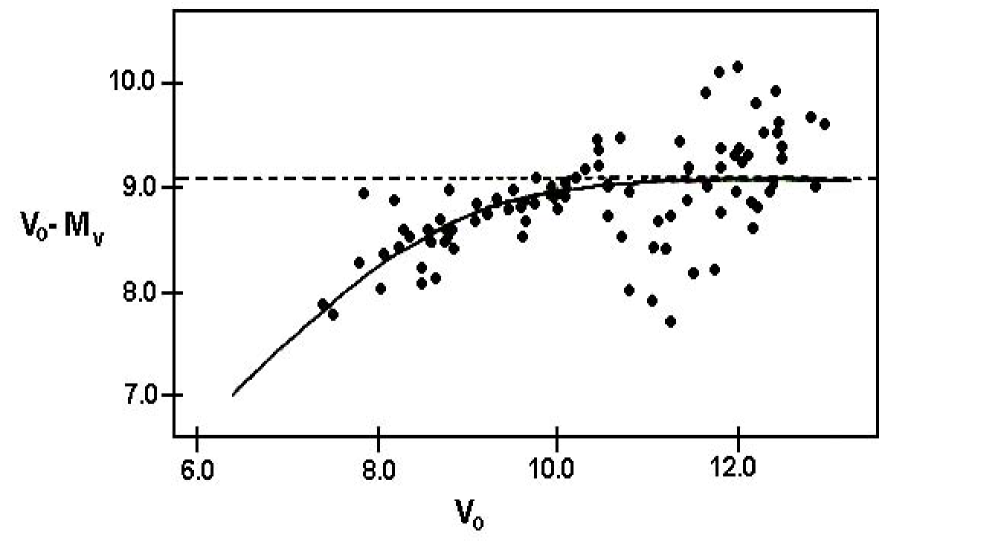
§ From the empirical mean evolutionary deviation curve of Johnson (1960b)Joh60b , Fig 9; an estimation of the distance modulus of 9.10 mag to the cluster could be achieved.
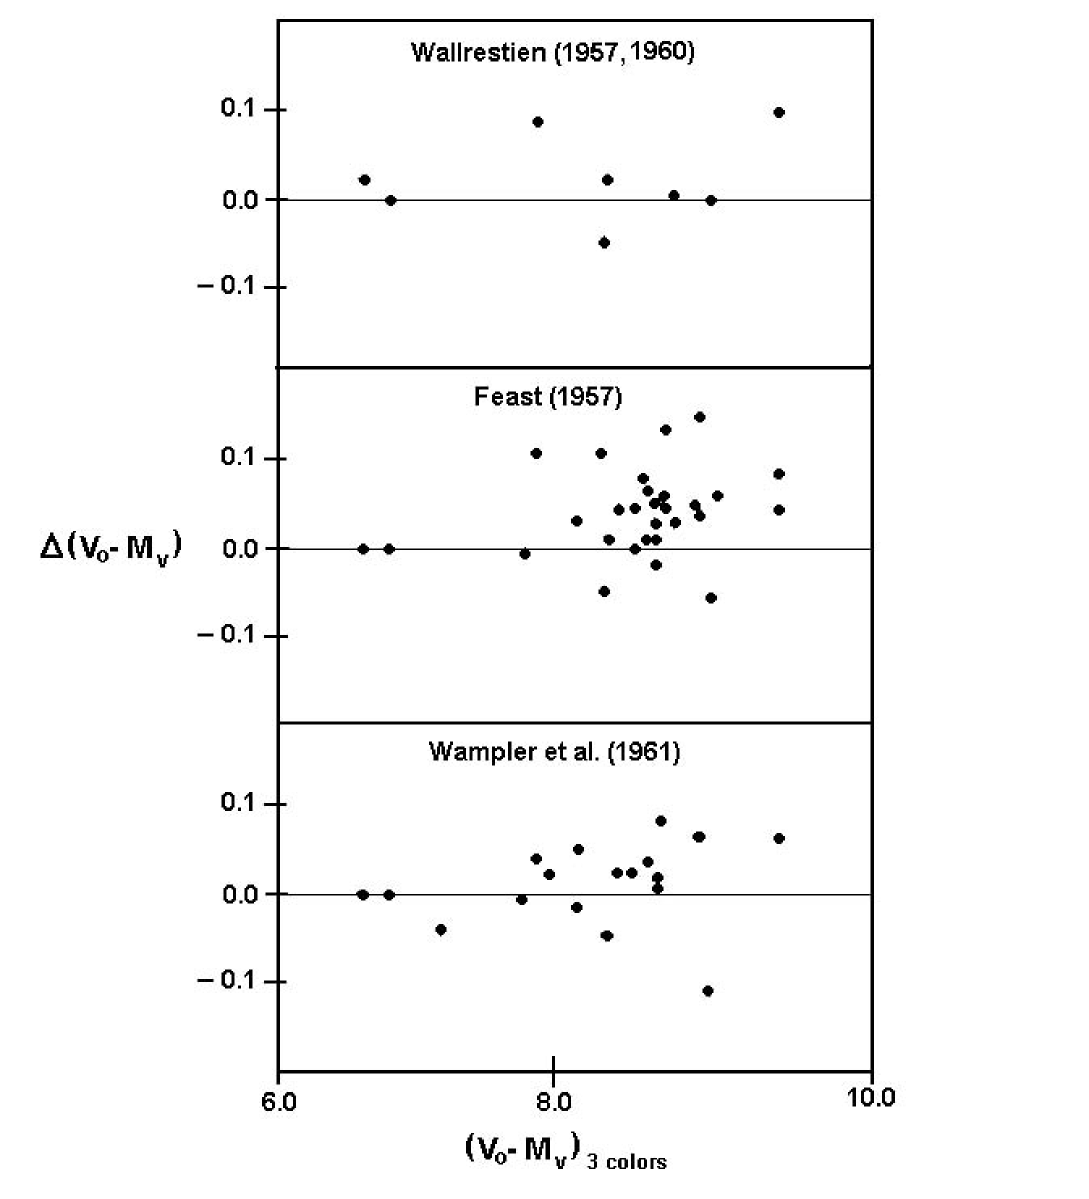
§ Using the spectroscopic data of Wampler et al (1961)Wam61 , Feast (1957)Fea57 , Wallerstein (1957)Wal57 , and Wallerstein (1960)Wal60 . The mean modulus of the cluster is found to be 8.25 mag (18 stars), 8.18 mag (29 stars), and 8.24 mag (8 stars) respectively. It is noticed that Wampler’s spectroscopic results are in a good agreement with the 3-color photometric data than those obtained by Feast and Wallerstein, Fig 10.
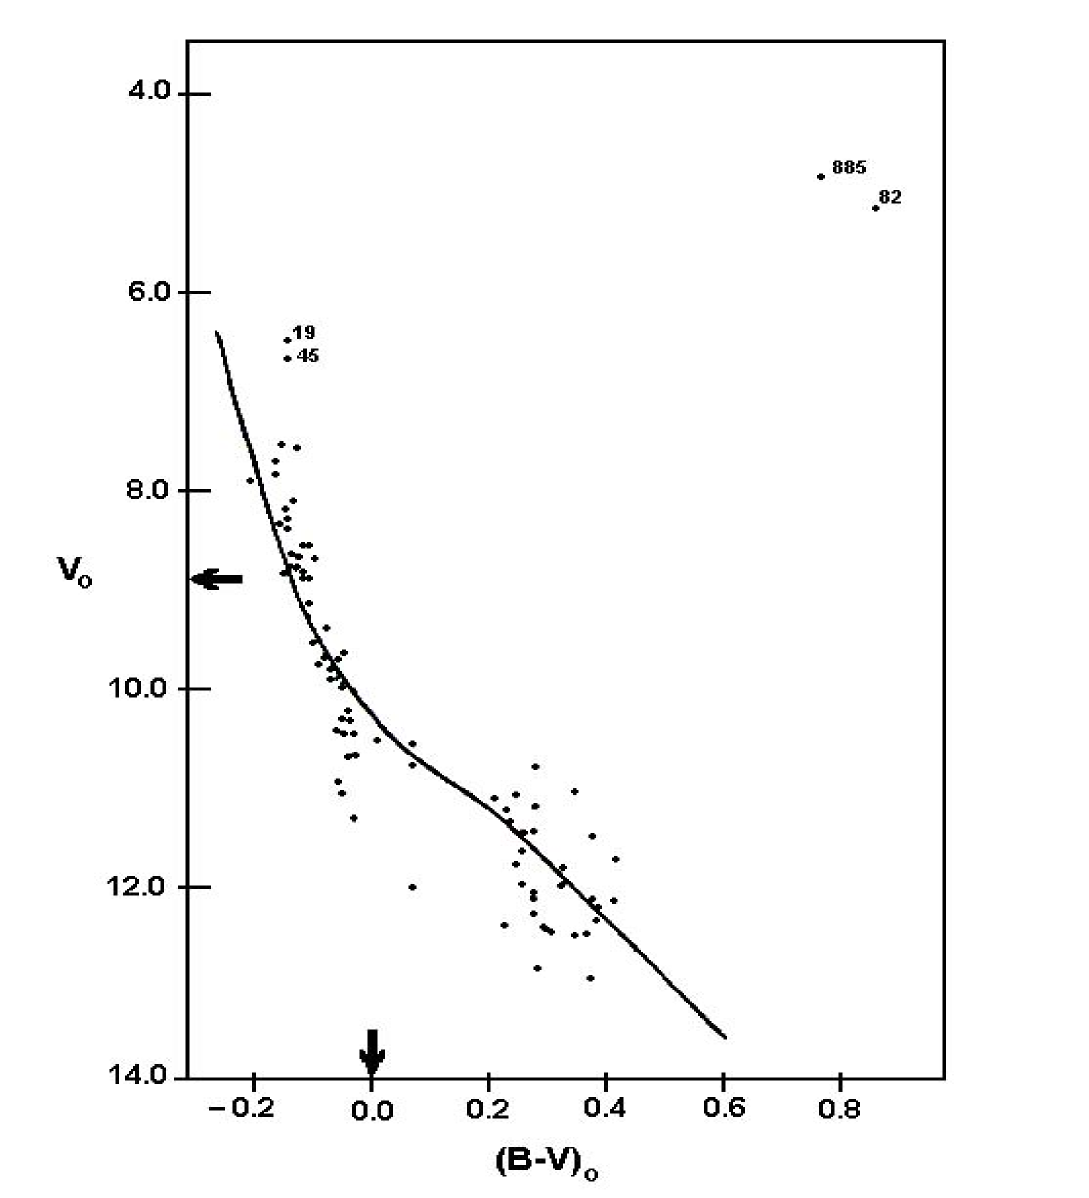
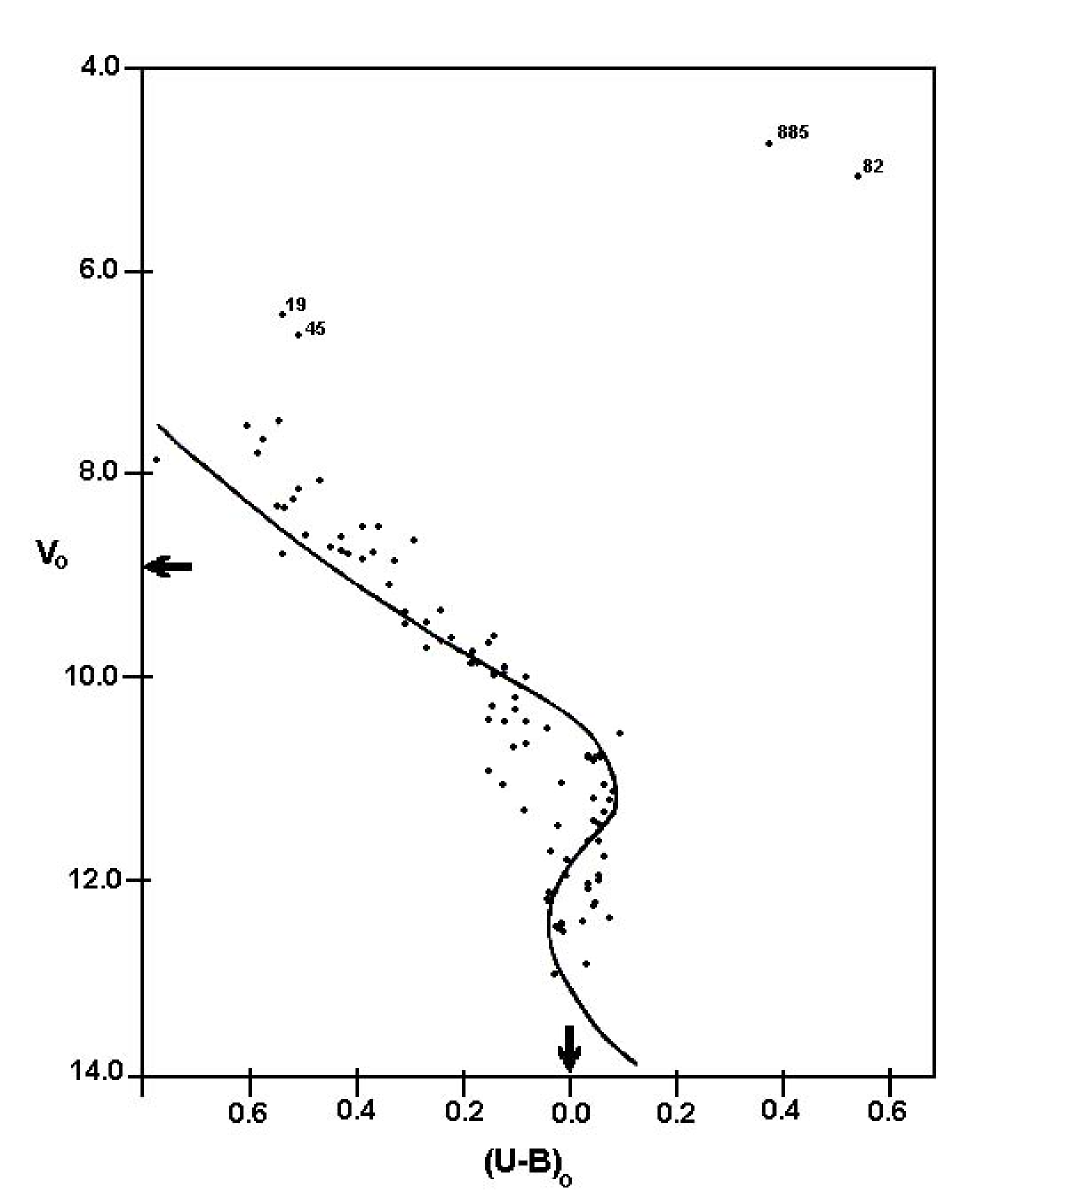
§ The distance modulus of the cluster has been obtained by fitting the ZAMS-curves of Schmidt-Kaler (1982)SchK82 to the lower portions of the [Vo , (B-V)o] and [Vo , (U-B)o] diagrams of the cluster as shown in Figs 11 & 12. The mean value of the distance modulus comes out to be 8.93 mag.
§ The mean distance modulus of the cluster has been calculated from the whole individual modulii of the members
(V-Mv)o = 8.82 mag 0.006 (standard error of the mean)
§ The classical Cepheid U-Sgr (star no 1457 in the present work) is found to have a distance modulus ranging from 8.95 mag to 8.99 mag according to Wolfgang (1988)Wol88 and Visvanatha (1989)Vis89 respectively. This value is in a good agreement with the present distance of the cluster.
The assigned mean distance modulus of the cluster is then 8.89 mag. This corresponds to a distance of 600 pc to it.
The cluster’s distances from the galactic plane Z and from the galactic center Rgc have been calculated to be -52.82 pc and 7.92 kpc respectively.
4. Membership analysis
The assignment of membership or non-membership based on the photometric analysis is very difficult in this cluster because the presence of differential reddening all over the cluster. The uncertainty about membership increases for faint stars those are merging with crowded galactic field. So that the discrimination of the physical members of the cluster from the field stars could be better achieved by studying the radial velocities and relative proper motions.
In the present work, our assignment of membership probabilities has been based on the position of each star in the long wave-length and short wave-length CMDs of the cluster with the proper motion studies of Stephen (1989)Ste89 . Also, the distance, the color excess and the spectral type have been taken into account in our decisions about some stars. Hence, 115 stars are regarded as members based on their good positions in the two CMs, distance, proper motion membership probabilities ( 50%), color excess, and spectral type ranges.
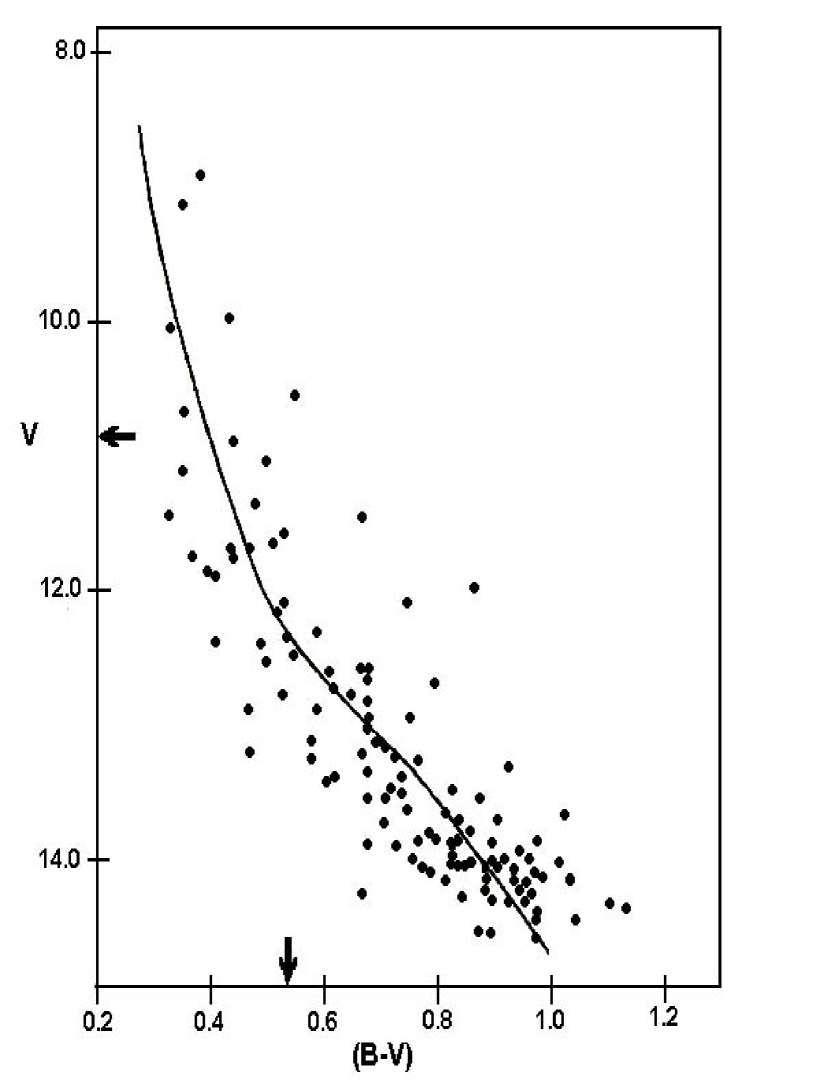
From the studies, which have only BV observations, almost 120 stars have been added to the cluster as probable members based on their location near the ZAMS-curve of the long wave-length CMD, as shown in Fig 13. Also, the proper motion membership probabilities ( 50%) have been taken into account. Therefore, the mean distance and reddening of these stars are found to be in a good agreement with the distance modulus and reddening ranges of the cluster. So that, the cluster M25 may be contain at least 230 stars as members and probable members.
Moreover, the free reddened CMDs of the cluster have been used to separate the doubt members from the normal ones as follows:
- According the previous studies, stars no 60, 118, & 127 are classified as foreground stars and stars no 11, 20, 51, 56, 73, & 534 as background ones. In the present work, based on our considerations, the stars no 11 & 20 have accounted as probable members.
- Stars no J1 & J106 taken from Johnson’s (1960a)Joh60a sequence are regarded as members because they are consistent with our conditions for the cluster members, then they have been added to the present sequence.
- Stephen (1989)Ste89 suggested that the star no 73 is a cluster member with a proper motion membership probability of 94%. While, Feast’s (1957)Fea57 and Schmidt’s (1977)Sch77 studies support our suggestion to regard this star as a non-member one.
- Stars no 19 & 45 have the brightest magnitudes in the CMDs and almost have the same radial velocity of the cluster (Feast 1957Fea57 , Wallerstien 1957Wal57 & Wallerstien 1960Wal60 ). So, Feast & Evan (1967)Fea67 classified them as variable members supported by Wampler et al (1961)Wam61 , Schmidt (1977)Sch77 & Schmidt (1982)Sch82 .
- The two stars no 82 & 885 are classified as evolved stars and found by Schmidt (1984)Sch84 to be yellow giant cluster members. Accordingly, it is suggested that the cluster M25 contains three evolved stars: the Cepheid U-Sgr; and the two giants no 82 & no 885.
5. The field stars
Most stars, which haven’t enough evidences supporting their membership to the cluster have been regarded as background field stars. This field is found to contain at least 1000 faint stars, as shown in Fig 14. Their distribution in the long wave-length CMD has a lower main sequence than that of the cluster members, Fig 15. The fit of the standard long wave-length CMD of Schmidt-Kaler (1982)SchK82 with the apparent one of the cluster’s field has shown that these stars have a distance modulus of 12.30 mag and color excess of 0.67 mag. This result is coinciding with the fact that the color excess and absorption increase with distance.
6. Age of the cluster
In the previous studies of M25, Wampler’s (1961)Wam61 UBV-photometry yields an age of the cluster lies between Mermilliod’s (1981)Mer81 age groups -persei and IC 4665, i.e. between 3.6 and 5.1 x 10⁷ yr. On the other hand, the age of the cluster has been estimated by Tosi (1979)Tos79 as 8.9 x 10⁷ yr, and by Strobel (1989)Str89 as 108 yr. In the present work, the age has been estimated using Sandage’s (1957)San57 relation (Mv-log t) where the visual absolute magnitude Mv of the turn off point of the cluster main sequence is found to lie at (B-V)t = -1.2 mag; this value related to log t of 7.95, i.e. an age of 9.1 x 10⁷ yr.
As an additional check, the age of the cluster has been estimated using the isochrones curves of Barbaro et al (1969)Bar69 , which yields an age of 9.8 x 10⁷ yr. Our estimation of the age shows a range from 9.1 x 10⁷ to 9.8 x 10⁷ yr. This estimation is greater than that obtained by Mermilliod’s (1981)Mer81 , smaller than what given by Strobel (1989)Str89 , and almost in a good agreement with that obtained by Tosi (1979)Tos79 .
7. Conclusions
The mean values of reddening and distance are found to be 0.50 mag and 600 pc respectively. The Cepheid variable U-Sgr has been used to support our distance estimation to the cluster. The cluster’s distances from the galactic plane Z and from the galactic center Rgc have been calculated to be -52.82 pc and 7.92 kpc respectively. The median age of the cluster has been achieved to get an age range from 9.1 x 10⁷ to 9.8 x 10⁷ yr. The membership analysis has been analyzed and about 120 stars have been added to the cluster as probable members based on their good location in CMDs, distance modulus, color excess and the proper motion membership probabilities ( 50%).
Acknowledgment
We want to thank Prof. Dr. Roland Buser (Basel Univ., Switzerland) for his critically reading the original task of this work, and for his valuable discussions during his visitation to Egypt.
References
- (1) Barbaro, G., Dallaporta, N. & Fabris, G., 1969. Ap & SS 3, 123.
- (2) Becker, W., 1972. QJRAS 13, 226.
- (3) Becker, W & Stock, J., 1954. Zs.F.AP 124, 477.
- (4) Blanco, V.M., 1955. ApJ 123, 64.
- (5) Burki. 1975. A & A 43, 37.
- (6) Feast, M.W., 1957. MNRAS 117, 193.
- (7) Feast, M.W & Evans, T.L., 1967. Obs 87, 286.
- (8) Graham, J.A., 1967. MNRAS 135, 377.
- (9) Irwin, J.B., 1958. AJ 63, 197.
- (10) Johnson, H., 1960a. ApJ 131, 620.
- (11) Johnson, H., 1960b. LowOB 107 vol.V, no.2.
- (12) Johnson, H.L & Morgan, W.W., 1953. ApJ 117, no.3, 313.
- (13) Landolt, A.U., 1964. ApJS 8, 352.
- (14) Luck, R. E.; Andrievsky, S. M.; Kovtyukh, V. V.; Korotin, S. A.; Beletsky, Yu. V., 2000. A & A 361, 189.
- (15) Mermilliod, J.C., 1981. A & A 97, 235.
- (16) Moffat & Schmidt-Kaler, 1976. A & A 48, 115.
- (17) Sandage, A., 1957. ApJ 125, 435.
- (18) Sandage, A., 1960. ApJ 131, 610.
- (19) Sandage, A., 1963. ApJ 138, 863.
- (20) Schmidt, E.G., 1977. PASP 89, 546.
- (21) Schmidt, E.G., 1982. AJ 87, no.4, 650.
- (22) Schmidt, E.G., 1984. ApJS 55, 455.
- (23) Schmidt-Kaler, Th., Landolt-Bornstien, Numerical data and functional relationships in Science and Technology, Group VI, Vol.2.Berlin, Springer Verlag, 1982.
- (24) Serkowski, K., 1965. ApJ 141, 1340.
- (25) Shobbrook, R.R., 1992. MNRAS 255, 486.
- (26) Stephen, P., 1989. AJ 98, 888.
- (27) Stroble, A.; Torun & Poland., 1989. AN 310, 5, 367.
- (28) Tadross, A. L.; Marie, M. A.; Osman, A. I.; Hassan, 2002. S. M., Ap & SS 282, 607.
- (29) Tosi, M., 1979. MmSAI 50, 245.
- (30) Van den Bergh,S.,1978. AJ 83, no.10, 1174.
- (31) Visvanatha, N.,1989. ApJ 346, 629.
- (32) Wallerstien, G., 1957. PASP 69, 172.
- (33) Wallerstien, G., 1960. ApJ 132, 37.
- (34) Wampler, J.; Peter, P. & Hiltner, W., 1961. ApJ 133, 895.
- (35) Wolfgang P. Gieren, 1988. PASP 100, 262.
| V-Mv | E(B-V)obs. | E(U-B)obs. | E(U-B)cal. | E(U-B)o-c |
|---|---|---|---|---|
| 9.40 | 0.28 | 0.13 | 0.20 | - 0.07 |
| 9.60 | 0.32 | 0.17 | 0.23 | - 0.06 |
| 9.80 | 0.37 | 0.22 | 0.27 | - 0.05 |
| 10.00 | 0.40 | 0.25 | 0.29 | - 0.04 |
| 10.20 | 0.44 | 0.29 | 0.32 | - 0.03 |
| 10.40 | 0.47 | 0.32 | 0.34 | - 0.02 |
| 10.60 | 0.50 | 0.37 | 0.36 | +0.01 |
| 10.80 | 0.53 | 0.40 | 0.38 | +0.02 |
| 11.00 | 0.55 | 0.43 | 0.40 | +0.03 |
| 11.20 | 0.58 | 0.45 | 0.42 | +0.03 |
| 11.40 | 0.60 | 0.48 | 0.43 | +0.05 |