A two-arm gaseous spiral in the inner 200 pc of the early-type galaxy NGC 2974: signature of an inner bar
Abstract
TIGER integral-field spectrography and Hubble Space Telescope WFPC2 imaging of the E3 galaxy NGC 2974 are used to derive the kinematics of the stellar and ionized gas components in its central 500 pc. We derive a numerical two-integral distribution function from a Multi-Gaussian Expansion (MGE) mass model using the Hunter & Qian formalism. The TIGER as well as published long-slit stellar kinematics, including higher order moments, are well fitted with this self-consistent model, requiring neither the addition of a significant mass contribution from a hidden disc structure, nor the presence of a central dark mass (at that spatial resolution). The data reveal the presence of a striking, highly contrasted, two-arm gaseous spiral structure within a radius of 200 pc, corresponding to a total mass of 6.8 104 solar masses of ionized gas. We use a deconvolved TIGER datacube to probe its kinematics at a resolution of about 035 FWHM. Strong departures from circular motions are observed, as well as high velocity dispersion values on the inner side of the arms. We interpret the observed gas morphology and kinematics as the signature of streaming gas flows driven by a pc diameter bar with kpc-1. This hypothesis is strongly supported by the predictions of a density wave model. This model predicts that the bar should lie at about 35° from the line of nodes, and implies gas inflow towards the central pc. The quadrupole pertubation due to this bar is estimated to represent less than 2% of the underlying gravitational potential (a maximum torque of about 10%), explaining the lack of a direct detection via broad-band photometry in the visible. Despite its weakness, the inner bar of NGC 2974 may be able to drive some gas within a 10 pc radius. We suggest that the presence of such inner bars might be more common among early-type disk galaxies than is generally thought, and that deep high-resolution emission-line imagery may be the best way to detect such structures.
keywords:
galaxies: individual: NGC 2974 – galaxies: nuclei – galaxies: interstellar matter, photometry, structure – galaxies: kinematics and dynamics1 Introduction
It is now evident that early-type galaxies are far from being the simple, (violently) relaxed, isothermal, purely stellar systems anticipated by the traditional picture developed by Hubble. They are often found to contain a complex interstellar medium (ISM), stellar discs and/or cusps and other discrete dynamical components (e.g. de Zeeuw et al. 2002). It now seems highly plausible that much of this complexity originates in mergers or other interactions between these galaxies and their environments. In addition, the statistical frequency of active galactic nuclei (hereafter AGNs) in the form of quasars and radio galaxies (which are generally associated with elliptical galaxies) at medium to high redshift has led to the realization that the majority of nearby elliptical galaxies may well harbor a central massive black hole (e.g., Chokshi & Turner 1992).
Indeed, recent stellar kinematic studies using Hubble Space Telescope (HST) spectroscopy have provided evidence for the presence of black holes in tens of early-type galaxies (Ferrarese & Merritt 2000; Gebhardt et al. 2000). They reveal the presence of a correlation between black hole mass and bulge velocity dispersion, which suggests a causal connection between the formation history of the black hole and that of the host galaxy.
One long-standing problem associated with the growth of black holes is the fueling mechanism. It has remained generally unclear how to transfer significant amounts of mass from the central kiloparsec of galaxy into its inner regions (at a scale of 10 pc). While there are several known mechanisms that can be invoked to initiate such gas inflow, most of them are commonly thought to be primarily relevant to spiral galaxies rather than early-type galaxies.
One such mechanism is density waves, the presence of which can be inferred from structures like spirals or bars. These can develop naturally in galactic discs or be initiated by ‘minor merger’ of e.g. a massive spiral and a small satellite galaxy (e.g., Pfenniger & Norman 1990; Pfenniger 1991; Hernquist & Mihos 1995). In particular, inner ‘secondary’ bars in spiral galaxies (often referred to as ‘bars within bars’) have been identified as potentially important agents to funnel gas into the innermost tens of parsecs (e.g., Shlosman, Frank & Begelman 1989; Erwin & Sparke 1999; Emsellem et al. 2001). In this scenario, a large-scale bar transports material into a kiloparsec-scale disc. It may then be relayed by an inner bar that is able to transport the gas to within about 10 pc of the galactic nucleus, approximately where the central supermassive black hole’s potential can take over. Structures with a radial extent of 240 – 750 pc, interpreted as inner bars, are surprisingly common in early-type spirals (at least 25% of barred S0/Sa galaxies, and maybe as much as 40%, Erwin & Sparke 2002). Such small bars have sometimes been linked to the central activity, as in e.g. NGC 6946 where Elmegreen, Chromey & Santos (1998) mention the possible role of the 210 pc bar-like structure and the central starburst. There is evidence that large-scale bars are responsible for an increase in the central gas concentration (Sakamoto et al. 1999). It is however important to emphasize that there is presently no strong direct evidence for the role of inner bars in gas fueling within the central 50 pc.
Martini & Pogge (1999) analysed visible and near-infrared HST images of 24 Seyfert 2 (spiral) galaxies and found that 20 of them exhibit spiral arms of dust within the inner few hundred parsecs. These inner spirals were thus suggested to play a crucial role in feeding gas into the central engines (see also Regan & Mulchaey 1999). The formation of such small gaseous spiral structures may involve acoustic instabilities in non self-gravitating discs (Elmegreen et al. 1998 and references therein). However, the arm-interarm contrast of such spiral arms is typically less than 0.1 mag, and it is not yet clear how efficiently these spirals can drive gas towards the nucleus. A more important issue is that some of these spirals anyway require an external driver to exist, such as a tumbling potential. Emsellem & Ferruit (2000) reported on the discovery of such an inner gaseous spiral in M 104 (the Sombrero galaxy, a highly bulge-dominated Sa spiral galaxy): HST imaging and integral-field spectroscopy hinted towards the presence of a (small) tumbling bar potential.
Since most radio-loud AGNs are found in early-type (E and S0) galaxies, we started a HST program to study whether such inner spiral structures may also be present in early-type galaxies. We are targeting galaxies from the sample of Goudfrooij et al. (1994a, 1994b), who performed a ground-based imaging and spectroscopic survey of ionized gas in a complete, magnitude-limited sample of 56 elliptical galaxies. We selected galaxies containing ionized gas features whose morphology and kinematics showed promising in terms of hosting contrasted nuclear gaseous spirals. In this paper we report on the results of HST imaging and integral-field spectroscopy of the E3 galaxy NGC 2974, where we discovered a strong inner trailing gas spiral.
We first present the original datasets, which includes HST/WFPC2 imaging and TIGER integral-field spectroscopy (Sect. 2). We then proceed in Sect. 3 with the two-dimensional maps resulting from a detailed analysis of the TIGER datacubes, and including a datacube deconvolution achieved with the use of the narrow-band HST imaging as a guide. The dynamical modeling conducted to fit the observed stellar and gaseous kinematics is presented in Sect. 4. A brief discussion is provided in Sect. 5, followed by concluding remarks in Sect. 6.
In this paper, we will assume a distance of 21.5 Mpc (from surface brightness fluctuations, worked out by Tonry et al. 2001), and use the variable to normalize all quantities that are distance dependent. We favour this to a normalization like (e.g.) (see Emsellem et al. 1996 for a rationale of this choice). This yields a scale of pc/arcsec.
2 Observations and data reduction
2.1 TIGER two-dimensional spectroscopy
2.1.1 Data reduction
We obtained integral field spectroscopy of NGC 2974 during a run in November 1993 at the Canada-France-Hawaii Telescope using the TIGER instrument. This spectrograph makes use of an array of about 500 micro-lenses whose diameter was set to for these observations. Two configurations were used to cover the spectral domains around the Mg5172 triplet (blue hereafter) and the H, [N ii]6548,6583 and [S ii]6717,6731 emission lines (red hereafter). The characteristics of both red and blue configurations are described in Table 1.
| Nov 1993 Run | Blue | Red |
|---|---|---|
| Lens diameter | ||
| Final spatial sampling | ||
| Field of view | ||
| # of exposures | 3 | 2 |
| Total exp. time | 135 mn | 105 mn |
| # of merged spectra | 382 | 429 |
| Spectral sampling | 1.5 Å | 1.5 Å |
| Spectral resolution | 4.0 Å (FWHM) | 3.2 Å (FWHM) |
| Spectral domain | 5090 - 5580 Å | 6550 - 6960 Å |
| Seeing (FWHM) | ||
| Stellar template | HR 1681 (K0III) |
The reduction of these data was achieved with the TIGER software package written at the Lyon Observatory (Rousset 1992). This included bias subtraction, pixel-to-pixel flat fielding, spectral extraction, wavelength calibration, flat fielding, removal of cosmic rays, differential atmospheric refraction correction and flux calibration for all individual exposures. The resulting data-cubes were then resampled to a square grid and merged. Details about these reduction steps can be found in Emsellem et al. (1996). In the next paragraph, we only mention points specific to the Nov. 1993 TIGER run and the NGC 2974 data.
A slightly incorrect position angle of the CCD with respect to the lens array led to some unwanted contaminations between adjacent spectra at their edges: this only affected the red configuration, for which spectra were safely truncated to a wavelength range of 6570–6960 Å. The wavelength calibration was found to be accurate to within 0.03 pixel: this was made possible through the use of a Fabry-Perot etalon which provides regularly spaced Airy lines. The absolute flux calibration of the red spectra was performed using spectro-photometric standard stars. For the blue configuration we used an available flux-calibrated long-slit spectrum (Goudfrooij & Emsellem 1996).
The stellar kinematics were derived from the blue spectra via a slightly modified version of Bender’s (1990) Fourier Correlation Quotient (FCQ hereafter) method. Line strengths were measured using an empirical correction for the dispersion as in Emsellem et al. (1996). Since no specific attempt was made to calibrate our data onto the Lick system, we remind the reader that systematic offsets may exist between our line-strength values and other published ones. The emission-lines in the spectra were fitted by Gaussian profiles using the FIT/SPECTRA software written by Arlette Rousset (Lyon Observatory - Rousset 1992).
2.1.2 Stellar template subtraction
(a) The blue spectra: the [N i]5200 line
As discussed in Goudfrooij & Emsellem (1996), when ionized gas is present the [N i] emission-line doublet at 5198,5200 (hereafter [N i]5200) can jeopardize the analysis of stellar dynamics and stellar populations of galaxies in the spectral domain around the Mg feature . We therefore devised an iterative procedure to eliminate the contribution of [N i]5200 to our blue spectra. This method will be described and illustrated in detail in a separate paper, so we only provide an outline here:
-
1.
We first derive the stellar kinematics with FCQ and the original blue spectra as they are.
-
2.
We then use a library of pure absorption-line spectra, including template stars as well as galaxies devoid of emission lines, to fit each of our blue spectra, after proper broadening and redshifting (using the result of step (i)). A small spectral region around the expected location of the [N i]5200 line was masked out during this fitting process.
-
3.
We then subtract the resulting model absorption-line spectra and make a fit of the [N i]5200 system on the residual pure emission-line spectra. An example is presented in Fig. 1.
-
4.
The fitted [N i]5200 line systems are then subtracted from the original blue spectra, thus resulting in spectra from which the [N i]5200 contribution is eliminated.
-
5.
Finally, we re-measure the velocities and dispersions from the “cleaned” spectra: these values are the ones adopted for the remainder of the paper.

(b) The red spectra
Just as described above, we use a library of star and galaxy spectra to remove the stellar continuum in the red spectra. However, the limited wavelength coverage and the high equivalent width of the emission lines in this spectral domain makes this a somewhat difficult task. For that reason, we built an optimal template using the stellar kinematics derived from the blue spectra and only including the stellar templates which were used in the fit of the blue spectra: this prevents artificial variations of (e.g.) the width of the H absorption line. An example of such a fit and subtraction is shown in Fig. 2. The residual ‘pure’ emission-line spectra were then fitted using the fit/spectra software package (Rousset 1992) assuming Gaussian profiles for each individual line.

2.2 HST/WFPC2 imaging
We used the Wide Field and Planetary Camera 2 (WFPC2) aboard HST to obtain high spatial resolution images of stars and ionized gas in the inner regions of NGC 2974 on April 16-17, 1997. Three exposures were taken with the Linear Ramp Filter FR680 at a filter wheel rotation of +15°. This filter configuration results in a passband covering the H 6563 + [N ii] 6548,6583 emission lines at the redshift of NGC 2974 when observed at the chosen position on the PC chip of WFPC2. Two exposures were also obtained with each of the filters F547M and F814W, whose passbands are free from (strong) emission lines at the redshift of NGC 2974. Total exposure times were 1400 s, 500 s, and 5100 s for the F547M, F814W, and FR680 filters, respectively. For each filter, one of the images was spatially offset by 05 from the others, which corresponds to an approximately integer pixel shift in both PC and WF CCDs. This was done to enable the identification of hot pixels during image combination. After standard pipeline processing and alignment of the images, we combined the images per filter using the STSDAS task crrej, which effectively removed both cosmic rays and hot pixels. Flatfielding of the FR680 images was done using a reference flatfield taken through the F658N filter.
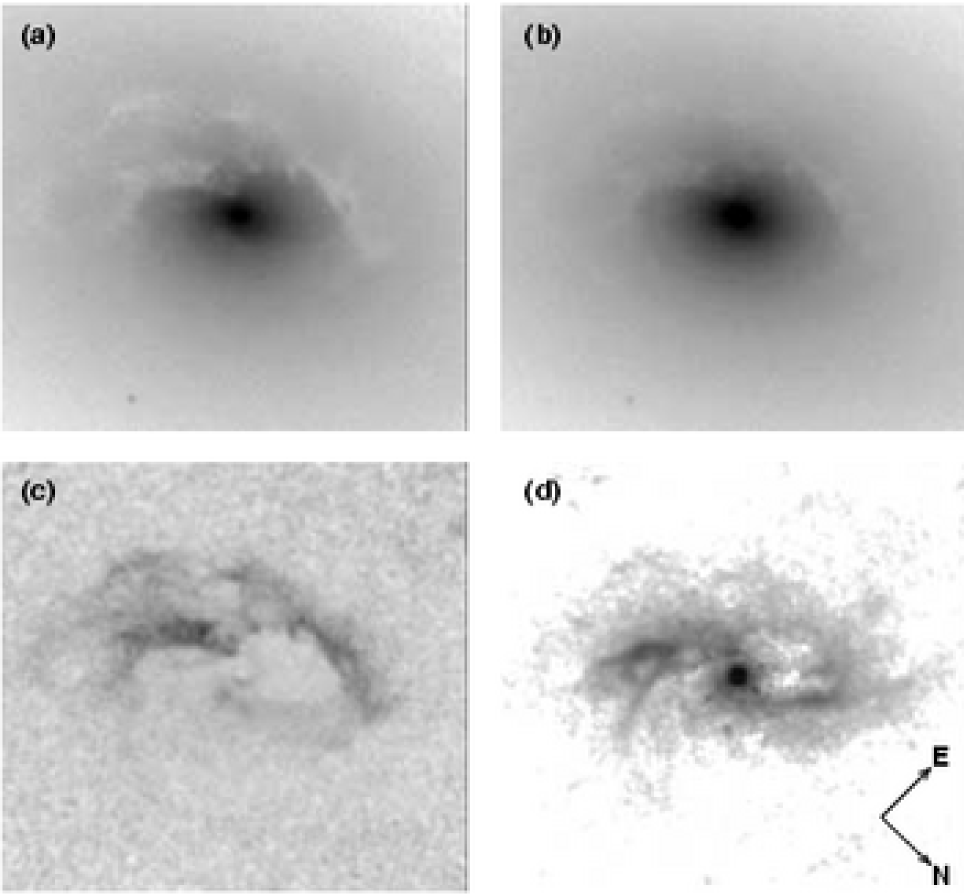
Since NGC 2974 contains prominent dust structures near its nucleus (see below and Fig. 3), the removal of the continuum contribution from the FR680 image is more complicated than simply subtracting a F547M or F814W image. First of all, the F547M and F814W images were aligned with the FR680 image. The F547M and F814W images were then matched to the same PSF. As no bright stars are present on the WFPC2 frames, this was done by building PSFs for all three filters using tinytim (Krist 1992), and convolving each filtered image with the PSF of the other filtered image. A similar procedure was performed to match the PSF of the FR680 image to that of the F547M and F814W images. A synthetic image of the continuum at 6620 Å was then constructed with the calcphot task in the synphot package of STSDAS. We used the F547M and the ratio of the F547M and F814W images in conjunction with the assumptions that (i) the unreddened spectral energy distribution of the stellar population matches that of the “E2” early-type galaxy spectrum of Bica (1988), and (ii) the dust features in NGC 2974 cause reddening that is described by the Galactic interstellar extinction curve of Rieke & Lebofsky (1985), taking into account that half of the stellar light from NGC 2974 is in front of the nuclear dust features. This process will be described in more detail in Paper II of this series (Goudfrooij & Emsellem 2003, in preparation). This synthetic 6620 Å continuum image was subtracted from the FR680 image, yielding the H+[N ii] emission-line image. A colour map was also constructed, using the F547M and F814W images. Figure 3 shows grey-scale representations of the F547M, F814W, , and H+[N ii] images.
These images will be discussed in detail in Goudfrooij & Emsellem (2003, in preparation) but will be used here for a datacube deconvolution (Sect. 3.3) and in the modelling of the gaseous component (Sect. 4.3).
3 Results from the TIGER datacubes
In the following Sections, we present the maps of the morphology and kinematics of the stellar and ionized gas components, as well as the Mg, Fe5270 and Fe5335 line-strength maps.
After barycentric correction, the systemic velocity of NGC 2974 was measured from the stellar absorption lines and found to be , significantly lower than the commonly used value of 1924 (Davies et al. 1987), but perfectly consistent with the value of quoted by Kim et al. (1988). All maps are oriented with the major axis along the horizontal axis. We remeasured the position angle of the major axis in the outer part of the galaxy on direct TIGER images and found PA (the North axis will then be always 132.2 degrees from the vertical axis). Note that there is a slight isophote twist of about 4 degrees towards the centre, partly due to dust extinction which is most prominent in the southeast side of the galaxy (cf. Fig. 3), thus defining its near side.
In order to compare our results with previously published kinematics of NGC 2974 (using long-slit spectra), we simulated long-slit cuts through our data cubes following characteristics of the observations made by Bender et al. (1994) and Cinzano & van der Marel (1994; hereafter CvdM94) for the stellar component, and by Zeilinger et al. (1996) for the ionized gas component. Comparisons are plotted in Fig. 4 and Fig. 5 for the stellar and ionized gas components respectively, after subtracting the systemic velocity111We applied a barycentric correction to the Zeilinger et al. data sets taking into account the dates of their observations.. Both comparisons show excellent agreement.


3.1 The stellar component
The maps in this Section have all been reconstructed using the sky sampling of for the pixel size: this way, one pixel in a map corresponds to one spatial element in the blue datacube.
3.1.1 Stellar kinematics
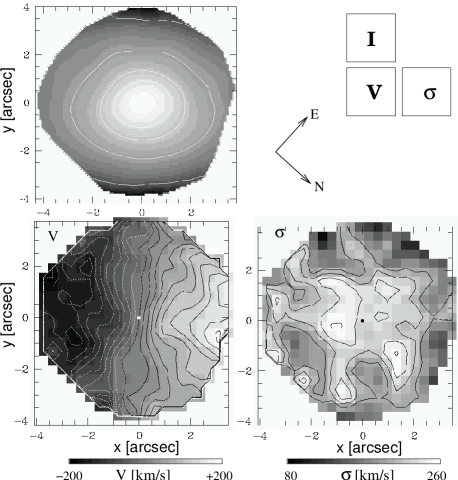
In Fig. 6, we present the stellar velocity and dispersion TIGER maps. The observed velocity field exhibits some departures from what is expected from axisymmetry. We measure a tilt of the zero-velocity curve of . This might partly be due to dust extinction perturbing the line-of-sight kinematics, although extinction is significant only on the South-East side. This should be confirmed by spectroscopy with higher signal-to-noise ratio. The central velocity gradient is about 110 arcsec-1 (or -1 kpc-1). The velocity dispersion field is nearly flat in the central two arcseconds with a value around , and slowly decreases outwards.
3.1.2 Line strengths
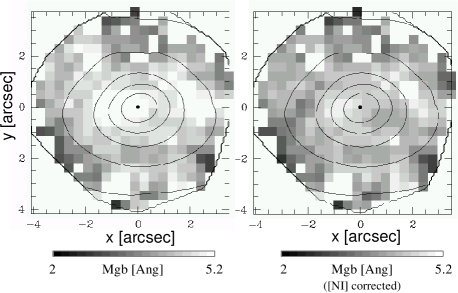
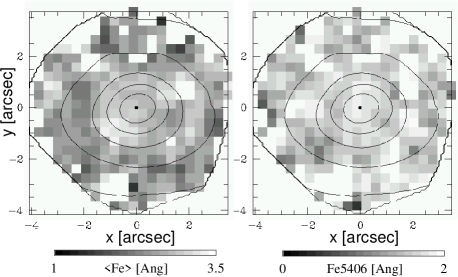
We derived line strength maps from the blue TIGER spectra, namely Mg, Fe5270, Fe5335 and Fe5406. Here we present the Fe map, (classically defined as ) as well as the Mg map before and after correction for the contribution of the [N i]5200 emission line (Figs. 7 and 8), to illustrate its effect on the Mg line strength (see Goudfrooij & Emsellem 1996).
The highest Mg value of is reached about arcsec from the centre along the major-axis, with its symmetric point having Mg of (the central value is ). There is a slight decrease of Mg outwards, with values at the edge of the field being around 4. The Fe and Fe5406 maps are consistent with being flat. Higher signal-to-noise spectra would help confirming the absence of significant line strength gradients in the central arcseconds.
3.2 The gaseous component
We now present the emission-line maps derived from fits of the emission lines present in the red data cube. These maps were built using a pixel size of , half of the final sky sampling.
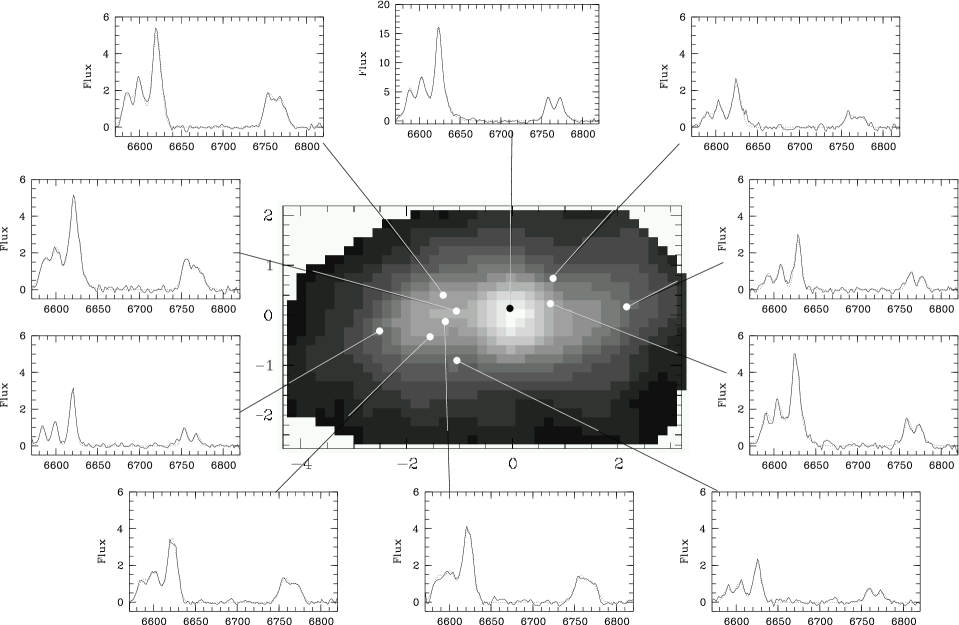
3.2.1 Flux maps and spectra
We detect H as well as the [N ii] and [S ii] doublets throughout the whole field of view. H is in fact observed on a much larger scale, as nicely emphasized with the maps produced by Plana et al. (1998). From our TIGER data, we cut out regions where the intensity of the [N ii]6583 emission line was less than 5 times the 1 noise level to avoid spurious features in the maps. This of course implies a lower flux threshold for the [S ii] lines which are significantly weaker than the [N ii] lines. However, we kept the same field size for all lines to avoid any confusion.
Spectral profiles of the emission lines show large line widths in the centre. This is true for both H and the forbidden lines ([N ii], [S ii]), so that it is not due to the presence of a Broad-Line Region of an active galactic nucleus (AGN). Spatial mapping of the ionized gas showing such broad lines shows that it is spatially unresolved in the TIGER data. We therefore modelled it with a fixed radial velocity and dispersion . The values for and were determined on the central spectrum, in which the wings have the best contrast and signal-to-noise ratio: we find and . Errors bars on these values are difficult to derive since it should include both the formal error bar as well as the uncertainty due to the noise in the data. We estimated them using the 25 spectra which are within 1″ of the centre and were found to exhibit such a wide component. These central 25 spectra were fitted with an additional Gaussian component. and we then find rms uncertainties of 35 and 61 on the velocity and velocity dispersion respectively. All other spectra were fitted with a single Gaussian.
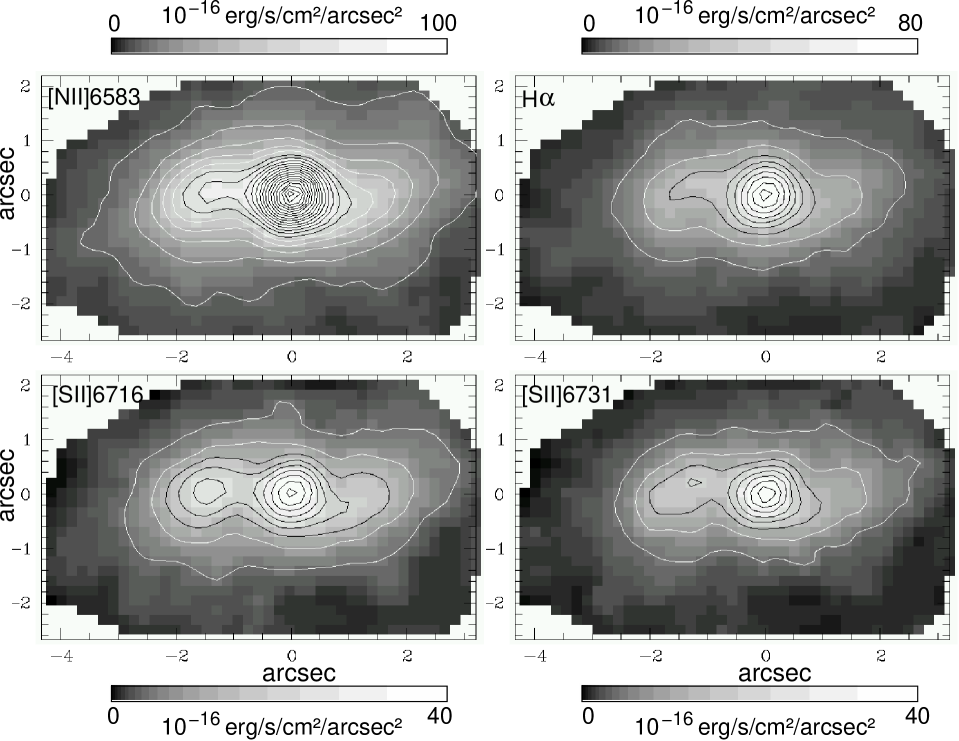
The [N ii]6583 emission-line flux map is presented in Fig. 9 with spectra illustrating the variations of line profiles and line ratios over the field. Other maps ([S ii] and H) are presented in Fig. 10. They all exhibit a two-arm spiral structure that is consistent from one emission line to the other, with an additional bright central peak. The SW arm (negative abscissa) is brighter than the NE one. In the inner part of each arm, the emission-line profiles are complex. This is probably caused by the superposition of components at different velocities.
Note that a simple a posteriori check of the validity of the stellar continuum subtration method described in Sect. 2.1.2 can be done by reconstructing the two-dimensional [N i]5200 intensity map and comparing it with the [N ii]6583 map (Fig. 10) (for which the surrounding continuum is essentially featureless). The match is excellent (see Fig. 11), particularly when considering the low signal-to-noise ratio of the residual [N i]5200 line spectra.
The [S ii]6717 / [S ii]6731 ratio ranges from 1 at the centre to 1.4-1.5 in the arms, corresponding to electron densities of 500 cm-3 and less than 100 cm-3 (low density limit), respectively. The [N ii]6583 / H ratio is roughly constant over the field of view, with values between 2 and 2.2. This seems to contradict the measurements made by Zeilinger et al. (1996), who reported [N ii]6583 / H values as high as 8 at the centre, a factor of two higher than ours at the centre. We suggest that this discrepancy is mainly due to the fact that Zeilinger et al. (1996) did not flux-calibrate their spectra (which were taken for the purpose of measuring gas kinematics) and did not correct them for the underlying (H) stellar absorption.
The flux distribution of the [S ii] lines is less centrally peaked than that of the [N ii] lines, with the [S ii]6717,6731 / [N ii]6583 ratio ranging from 0.4 at the location of the nucleus to 0.65 in the arms. This is usually interpreted as a decrease of the [S ii] emission in the dense nuclear regions, due to the lower critical electronic densities of the [S ii] lines with respect to the [N ii] line doublet ( 103, 1.2 104 and 8 104 cm-3 for the [S ii]6717, [S ii]6731 and [N ii]6548,6583 lines, respectively).
The H flux integrated over a 3″ radius from the nucleus is 1.9 1032 2 W, with a 4.7 1031 2 W contribution from the central unresolved peak. Assuming a uniform electron density = 100 cm-3 and a pure hydrogen gas, this corresponds to a mass of ionized gas in the arms of 6.8 104 solar masses. For the central unresolved peak and assuming this time an electron density of 500 cm-3, we obtain a mass of ionized gas of 4.4 103 solar masses. Note that the quoted ionized gas masses are inversely proportional to the value of .

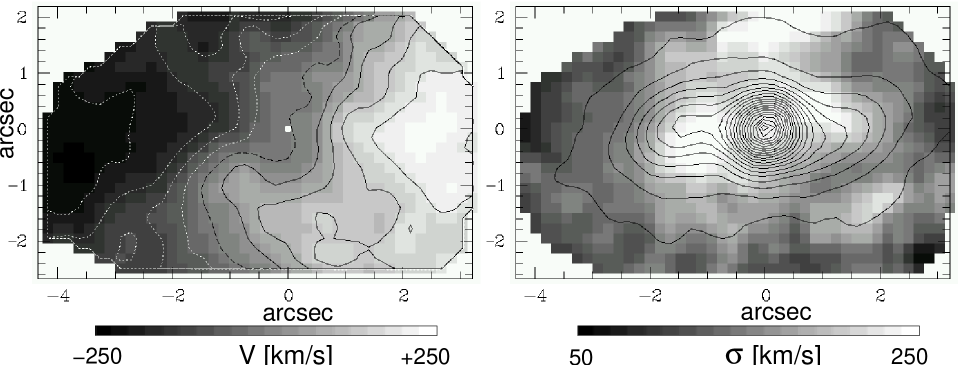
3.2.2 Gas kinematics
The emission-line velocity and velocity dispersion maps are shown in Fig. 12. The velocity field exhibits strong disturbances following the spiral-like distribution of the gas. There is a strong hint for gas streaming on the inner side of the south-western arm, where the emission lines exhibit a complex structure probably resulting from the superposition of several kinematical components (Fig. 9). This widening of the lines ( ) is also observed on the inner side of the north-eastern arm, as emphasized in the dispersion map (Fig. 12).
3.3 Datacube deconvolution
Using the high-resolution HST/WFPC2 narrow-band H+[N ii] image of NGC 2974 shown in Fig. 3, we applied the method pioneered by Ferruit et al. (1999) to deconvolve our merged TIGER datacube (see also Emsellem & Ferruit 2000). Two methods were tested: a pure Lucy deconvolution, and a “weakly guided” Lucy deconvolution in which the narrow-band HST/WFPC2 image is used to constrain the integrated flux in the red datacube. In both cases, we performed 300 iterations after which the gain in resolution was found not to compensate the increase in noise level. Differences between the results of the two deconvolutions were not significant, except for a slight reduction of the high-frequency features in the weakly guided case. We therefore favour the latter, the analysis of which will be presented here.
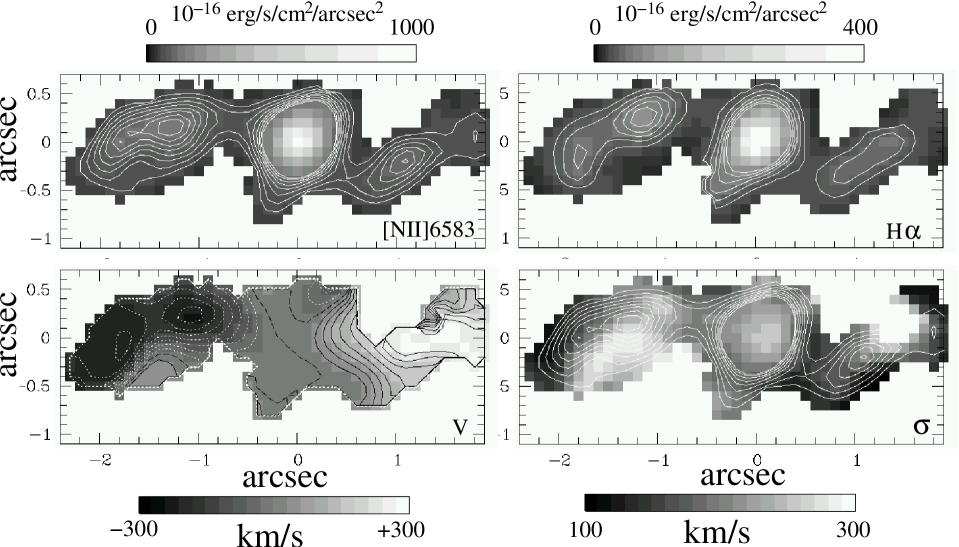
The final resolution of the deconvolved datacube, evaluated from the central peak (unresolved in the WFPC2 [N ii]H image), is FWHM. Maps of the deconvolved datacube, namely the [N ii] and H flux distribution, the gas velocity and dispersion maps, are shown in Fig. 13.
The two spiral arms are nicely revealed, as well as the central concentration which is now highly contrasted. The velocity field shows strong streaming motions along the arms, with peak velocities of 211 and 264 . More interestingly, the dispersion is very high on the inner side of both arms, confirming the picture seen before deconvolution (see Fig. 12), reaching values greater than 300 . The gas kinematics will be further discussed in Sect. 4.3 in view of a density wave model.
4 Dynamical models
In this Section, we present new dynamical models for the stellar and gas components in the central region of NGC 2974, using our new two-dimensional data as well as published kinematics.
4.1 The MGE luminosity model
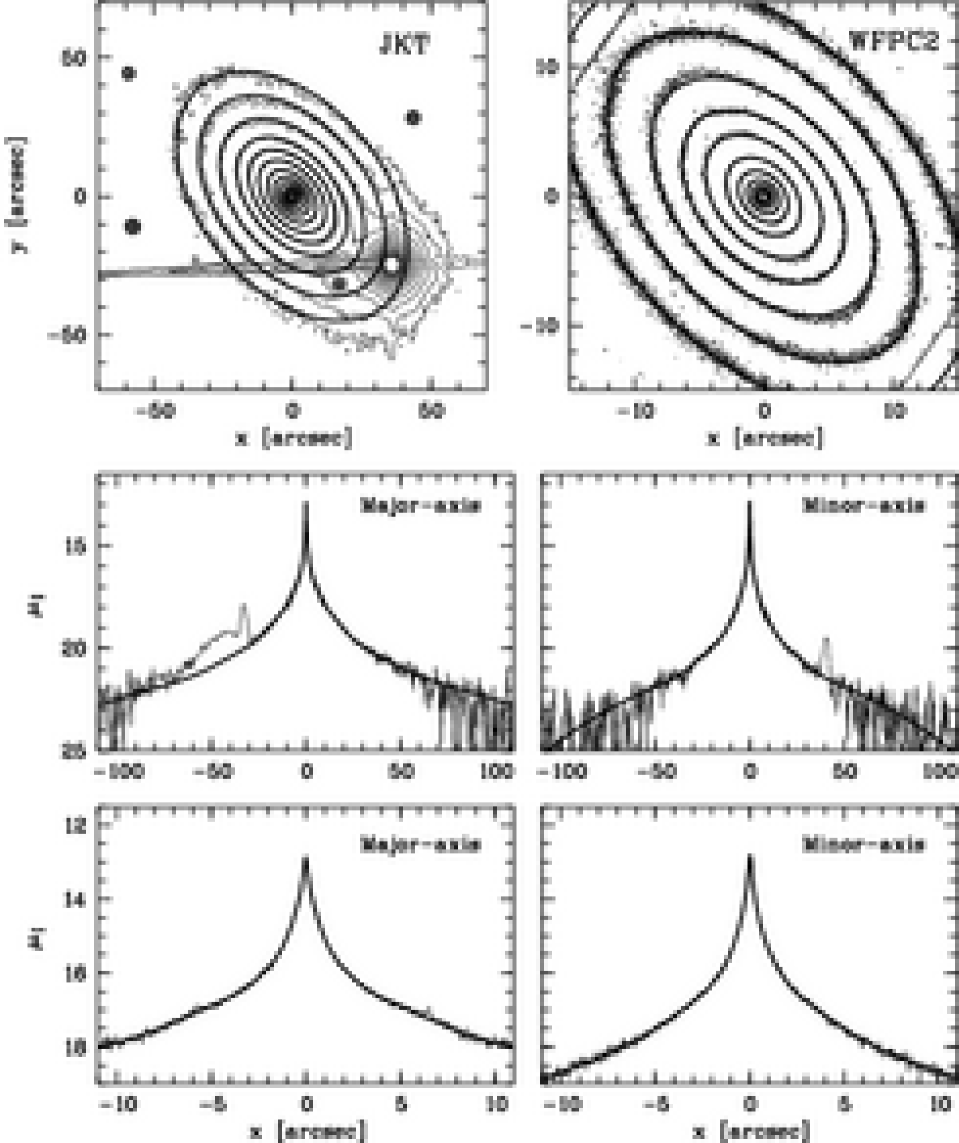
The first step in this modelling process is to obtain a realistic three-dimensional representation of the luminosity and mass distribution of the galaxy from the very centre to the outer region. We used the Multi-Gaussian Expansion method (Monnet, Bacon & Emsellem 1992; Emsellem et al. 1994) to build a photometric model222See Cappellari 2002 for an efficient MGE package developed within the IDL environment. for the deconvolved surface brightness of NGC 2974. the combination of a ground-based band image taken at the 1.0-m JKT (data taken from Goudfrooij et al. 1994a) and the HST/WFPC2 F814W image provided the required wide field of view and high spatial resolution, respectively. The result of the fit, taking into account the respective Point Spread Functions of the input images, is shown in Fig. 14. Note that the regions affected by dust extinction were masked during the fitting procedure, although we checked that this did not affect the result of the fit in any significant way. The spatial luminosity density is obtained by assuming that each individual Gaussian component is uniquely deprojected as a three-dimensional axisymmetric Gaussian (see Table 2).
The total luminosity of the model is 2 in the band. The most flattened gaussian component in the deprojected model is Gaussian #7, with an axis ratio of 0.344, which contributes to about 19% of the total mass in the model.
| # | |||
|---|---|---|---|
| 1 | 807834.22 | 0.048 | 0.782 |
| 2 | 355349.63 | 0.105 | 0.608 |
| 3 | 62166.935 | 0.313 | 0.539 |
| 4 | 16377.007 | 0.605 | 0.649 |
| 5 | 3738.1343 | 1.326 | 0.598 |
| 6 | 627.7568 | 3.735 | 0.501 |
| 7 | 104.9081 | 9.667 | 0.344 |
| 8 | 9.3040 | 21.829 | 0.461 |
| 9 | 0.8656 | 55.620 | 0.466 |
4.2 Two-integral models for the stellar component
As detailed in Emsellem, Dejonghe, & Bacon (1999, hereafter EDB99), we constrained the inclination and mass-to-light ratio by using simple dynamical Jeans modelling. A best-fit model was obtained with -1 and an inclination of , consistent with the inclination found by Plana et al. (1998). However, all models with values were found to be consistent with the observed kinematics. No central dark mass was required to fit the central velocity gradient and velocity dispersion value at the resolution of our data (see Fig. 15). The observed kinematics imply an upper limit of M⊙ to the central dark mass. This is consistent with the mass inferred using the Mbh/ correlation (Ferrarese & Merritt 2000, Gebhardt et al. 2000).

We then derived the even part of the two-integral distribution function corresponding to the MGE mass model via the Hunter & Qian (1993) routine (details of this procedure can be found in EDB99). The odd part was parametrized with respect to the even part using the function [where ]: E.g., (see Eq. 1 in EDB99, and references therein). The free parameter was taken to be the same for all components.
Line Of Sight Velocity Distributions (LOSVDs) corresponding to the computed distribution function were then derived on a square grid, and convolved by the appropriate kernel to include the effect of seeing and pixel integration. These LOSVDs were parametrized via Gauss-Hermite moments as well as true velocity moments, and compared with the observed kinematics.
4.2.1 The best-fit model
Our best-fit model has -1 with at the centre, and for corresponding to a circular orbital radius of . The agreement with the CvdM94 long-slit data is excellent; a comparison is shown in Fig. 16. Although the model fits the TIGER maps relatively well, it can obviously not reproduce the slight tilt of the zero velocity curve (Fig. 17). Our value for is larger than the one found by CvdM94 (who found or , normalized to our assumed distance). However the total mass of the galaxy, as measured on the MGE model, is 2 , consistent with the value derived by CvdM94 (again for the present assumed distance of 21.5 Mpc). We also find an excellent agreement between our value for the predicted circular velocity at 2′, 219 , and the one derived by CvdM94, 217 . This means that this mass to light ratio discrepancy comes mostly from a difference of zero points in the photometry of about 0.2 magnitude. Our estimate is however significantly higher than the one obtained by Pizzella et al. (1997) for a triaxial geometry.
Fig. 18 provides a representation of the total best-fit distribution function (even plus odd parts) versus the two integrals of motions. This plot can be compared to the one derived for NGC 3115 (EDB99). In contrast with NGC 2974, NGC 3115 posseses rather bright and very thin disc structures, which can be easily identified in the even part of the distribution function as strong peaks near the expected location for the circular orbits ().


4.3 Gaseous Density wave modelling
As mentioned in Sect. 3.2.1, the observed two-dimensional morphology and velocity field of the ionized gas in the central few arcsec show the presence of a highly contrasted, two-arm spiral structure with strong streaming motions. At a radius of 2″, corresponding to about 220 pc at the distance of NGC 2974, and for a velocity of about 200 , the dynamical timescale is only about years. The contrast and large opening of the spiral arms are therefore suggesting that a quasi-stationary process is at play here. In what follows, we thus present our attempt to fit the gas morphology and kinematics with a density wave model.
4.3.1 The geometry of the spiral arms

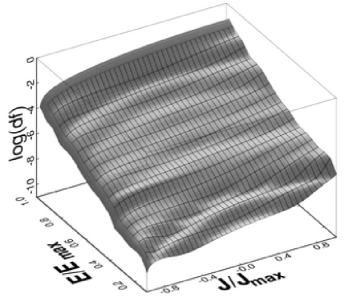
We first need to constrain the parameters of the spiral arms, namely its geometry and amplitude. This was done with the help of the H[N ii] WFPC2 image corrected for extinction (Goudfrooij & Emsellem 2003, in preparation). The narrow-band image was deprojected assuming an inclination angle as obtained from the stellar dynamical model (Sect. 4.2). We then estimated the pitch angle as a function of radius. The gaseous arm on the NE side of the centre is better defined and less patchy, probably due to the lower extinction (the near side of the galaxy being the SE side). We therefore decided to preferentially use the NE arm to measure the pitch angle. The average pitch angle is around 35° (see Fig. 19), with values between 20° and 50°. It seems to increase towards the centre, although the spiral is not easily traceable close to the nucleus where the unresolved central source of emission dominates (see Fig. 21). We can follow the spiral up to a deprojected radius of about 08 (i.e. apparent radius of 04, as the connection of the spiral with the central source unfortunately occurs close to the minor-axis of the galaxy). Starting at a radius of 15, an abrupt change in the pitch angle occurs: it decreases from 40° to almost 0° in 05.
4.3.2 Hints for the presence of a tumbling potential
The total mass of ionized gas within the central 3″is 2 M⊙, to be compared with a stellar mass of 2 M⊙ derived from the MGE model (Sect. 4.2). We can safely say that the gas component is therefore not self-gravitating in this region. In the limit of tightly wound spirals, we could use the dispersion relation for non self-gravitating spirals to derive the pitch angle (assuming a value for the sound speed , see e.g. Englmaier & Shlosman 2000). Such density waves are supported inside their own Inner Lindblad Resonance (ILR hereafter), or outside the Outer Lindblad Resonance (Maciejewski et al. 2002). However, the large pitch angle observed in the case of the inner gaseous spiral arms of NGC 2974 prevents us to use such an approximation.
More importantly, we can also exclude the role of self-gravity as the source for the observed mode. We therefore need to search for another driver to explain the highly contrasted set of arms in the inner 300 pc of NGC 2974. The large pitch angle of the gaseous arms observed in the inner 2″of NGC 2974 is reminiscent of the straight/curved gaseous and dust lanes seen in large-scale bars (e.g. Athanassoula 1992). Such structures correspond to bar-driven shocks inside the Corotation Resonance of the bar (CR hereafter), the dissipative component being driven towards the Inner Lindblad Resonance (ILR hereafter) along the leading edge of the bar. This obviously requires the presence of an Inner Lindblad Resonance (Athanassoula 1992, Maciejewski et al. 2002), therefore setting some constraints on the central mass profile.
Maciejewski et al. (2002) emphasized the characteristic features of the gas flow in a single bar. One of the main characteristics is the abrupt change of velocity when the gas crosses the principal shocks mentioned above, flowing from the trailing to the leading side of the arms. This could qualitatively explain the strong streaming seen in Fig. 12 and the large width of the emission line on the trailing side of the spiral arms in NGC 2974. Maciejewski et al. (2002) also observe gas being funelled towards the 4/1 resonance (or Ultra Harmonic Resonance, hereafter UHR) along convergence regions. This can create gas concentrations at the end of the principal shocks, and in the case of NGC 2974 could account for the abrupt change in the pitch angle at . This hypothesis of the presence of an inner bar in NGC 2974 is examined in the next section, using the formalism described in Emsellem et al. (2001).
4.4 The bar model
In Section 4.2, we obtained a mass model assuming axisymmetry which reproduces the observed stellar kinematics of NGC 2974 in the central 18″. We can obtain a first and rough estimate of the pattern speed of a presumed tumbling bar by deriving an “azimuthally averaged” resonance diagram for NGC 2974 using this mass model, which is shown in Fig. 20. The first striking thing is that the radial profile predicted by this model (which does not include any central dark mass) inevitably implies the presence of a single Inner Lindblad Resonance. As emphasized above, the ILR is a prerequisite for the building of shock lanes by a tumbling bar. The principal shocks should lie inside the radius of the Ultra Harmonic 4:1 Resonance, therefore constraining -1 . We also assume that the spiral arms are at least partly outside the ILR, thus implying that -1 .
We then add a bar-like component in the model by perturbing the gravitational potential with a simple second harmonic function of the form , where and are the radius and azimuth in the frame co-rotating with the bar perturbation, respectively. For (), we use the functional form provided by the bar provided by Kalnajs (1976; see also Emsellem et al. 2001). Finally, gas orbits were calculated using the epicycle approximation for a potential perturbed by a bar-like component (Lindblad & Lindblad 1994; Wada 1994). We included a ‘damping’ term as in Emsellem et al. (2001). The free parameters of this model are: the damping coefficient , the pattern speed of the bar , the amplitude (in km2 s-2) and radius (in arcsecond) of the perturbation (see a similar but more complete approach in Wada & Koda 2001). For each set of parameters, we need to adjust the angle , in the equatorial plane of the galaxy, between the bar and the line of nodes.

4.4.1 Comparison with the observed morphology and kinematics
We examined systematically models with values of within the constrained range ( in units of ; see above) with steps of 10 , for different values of , , and . Only values of between 24 and 27 can reproduce the change of direction of the arm at 21; the best fit value is = 26 (or about 270 pc at 21.5 Mpc). For values of greater than , the pitch angle of the corresponding arms become too high with respect to the observed values. As the pattern speed increases, the inner side of the spiral arms moves towards the centre. As to , we can find reasonably good qualitative fits to the observed structures if (in ).
The gas orbits for a model with -1 , and ° are shown in Fig. 21, along with the observed morphology of the ionized gas. For this model, the ILR, UHR, CR and OLR are at radii of 14, 32, 49, and 85 respectively. The projected major-axis of the bar is then at about 35° from the major-axis of the galaxy (for ). The crowding of the streamlines correspond to compression regions: the model thus predicts the presence of shocks on the inner side of the arms due to the convergence of streamlines. This is consistent with the high velocity dispersion observed in the TIGER maps (Fig. 13). Note that this model corresponds to a perturbation in the potential of less than 2% and a maximum torque of 10%: this definitely corresponds to a weak bar (see Fig. 1 of Block et al. 2002).
A detailed comparison between the observed kinematics and the one predicted by this model is however beyond the scope of the present study, as it would first require a reasonable fit of the observed line emission distribution (all observed maps being luminosity weighted). This density wave model is only intended to provide a first qualitative attempt at reproducing the observed gas distribution and kinematics. The existing data are not sufficient to really constrain the input parameters of the static model we developed: we can only provide rough estimates of the main parameters such as: the pattern speed , the CR radius , the angle between the bar and the line of nodes . It may be possible to narrow the range of possible values for the pattern speed of the wave, as its value determines the location of the resonances, but this would require a full hydrodynamical simulation. A deeper high-resolution H+[N ii] image would also help to follow the gaseous distribution to greater galactocentric distances.
5 Discussion
5.1 Dynamical models for NGC 2974
CvdM94 assumed the presence of a hidden thin stellar disc in NGC 2974, contributing a significant 7% to the total visible mass of NGC 2974. In the present study however, we solely relied on the observed surface brightness (in the band) to build our photometric model, and did not include any additional disc component. Our dynamical modeling shows that there is no need for the presence of such a hidden component (see Table 2) to fit the observed stellar kinematics. We should however emphasize that the detailed characteristics of the individual gaussian components provided by the MGE formalism are (also) somewhat model-dependent, and should be taken with some level of caution. We derived the corresponding two-integral distribution function (strictly speaking, only the even part is constrained by our mass model) thus providing a self-consistent model.
We note that Jeans models do not guarantee that the distribution function is positive everywhere. They are generally mainly used to constrain the first two velocity moments. They should therefore be taken with caution, and should only be used, in our view, as a useful tool to provide first approximations on global parameters (e.g. mass-to-light ratio, inclination). Self-consistent models should be favoured to derive LOSVDs, as assuming the shape (e.g., Gaussian) of the contribution of individual components (bulge, disc) may lead to misleading results.
In our modeling of the stellar kinematics, we made the assumptions of axisymmetry and a constant mass-to-light ratio, and neglected the effect of dust extinction. The central gaseous kinematics (see Sect. 4.4), and the possible stellar rotation along the minor-axis seem however to invalidate the hypothesis of axisymmetry. We also know from the HST/WFPC2 images that dust is indeed present in the central kpc of NGC 2974, although its distribution is localized. The fact that a simple two-integral model fits rather well the observed kinematics might just then be due to a lack of two-dimensional coverage in the outer part, and to the lack of spatial resolution in the central few arcseconds. New integral field data acquired with a larger field of view (e.g. SAURON on the 4.2-m WHT), better spatial resolution and signal-to-noise ratio should thus permit one to further constrain the stellar dynamical structure of NGC 2974.
5.2 The central dark mass
If we now interpret the large line width of the central peak of the ionized gas ( ) in terms of a rotating Keplerian disc, it implies333This depends on the – unknown – radial distribution of the gas within the central 01. an enclosed mass of about . This is to be compared with the visible mass of M⊙ from the MGE model within this radius, which would thus be inconsistent with the upper limit for a central dark mass of M⊙ (Sect. 4.2). This was however derived under the assumption of a two-integral dynamical model, which is not valid if a tumbling bar is present. Also we would definitely need data at very high spatial resolution to probe the central peak, and check our hypothesis of a Keplerian rotating disk. The only instrument currently available to help unravel the dynamical nature of the innermost region of ionized gas in NGC 2974 is the Space Telescope Imaging Spectrograph (STIS) aboard HST.
5.3 The bar in NGC 2974
The bar model presented in Sect. 4.4 provides a good representation of the observed gaseous structure and kinematics. Within this picture, we can roughly estimate the expected extent of the bar by assuming it is a factor of 1.2 smaller than its CR radius: this gives a radius of 41 or pc. The presence of strong shocks in the gaseous spiral arms then implies some dissipation, with a loss of angular momentum in the case of the observed trailing spiral in NGC 2974. At the scale of the ILR radius (14 or 146 pc), the dynamical timescale is short, of the order of yr (the rotation period of the suggested bar being yr). We therefore expect a significant time evolution of the observed structure within a few yr. In this context, the static model based on the epicyclic approximation presented in Sect. 4.4 should be used with caution, and can only serve as a guideline for future full hydrodynamical simulations.
The gaseous response to a tumbling bar for a potential with a single ILR was examined by Fukuda, Wada & Habe (1998) via numerical simulations. Their corresponding run ”Bb” indeed produces trailing spiral shocks resembling the ones we observe in NGC 2974. Their simulations suggest that fueling is rather inefficient in this case: only gas originally within a radius about twice the ILR falls into a central structure much smaller than the ILR (roughly 70 pc in the case of NGC 2974). The central peak of ionized gas, which represents a reservoir of a few 2 M⊙ (see Sect. 3.2.1) within a radius of less than 006 (6.25 pc), could be the result of such an accretion.
We finish the discussion on a perhaps more provocative note. Considering the relatively low contrast of the presumed bar-like perturbation in NGC 2974, and the dust extinction, such a structure is extremely difficult to detect using visible broad-band photometry, even with the help from two-dimensional stellar kinematics. Our result was only possible because of the availability of a deep, high-resolution image of emission-line gas which showed the spiral structure (Figs. 3 and 21) and the simultaneous use of two-dimensional integral-field spectroscopy. This brings up the question of how many such bars might be hidden in other early-type galaxies? We suggest that these might be more common than thought previously, and may provide the possibility to funnel gas down to a scale of a few tens of parcsecs, a step further towards feeding the AGNs, which are commonly found in early-type disk galaxies. In this context, emission line gas may certainly be a more helpful tracer than the dust features in probing the central structure of nearby galaxies, but this then requires both high spatial resolution and two-dimensional coverage.
6 Conclusions
In this final Section, we summarize the main results of this study.
-
•
We have presented integral field spectroscopy obtained with the TIGER spectrograph which allowed us to probe the stellar and gaseous distribution in the central 500 pc of NGC 2974. We have applied an iterative scheme to disentangle the relative contributions of the gaseous emission and stellar absorption lines from the obtained datacubes.
-
•
The stellar line indices do not reveal any significant metallicity gradient in the central 500 pc.
-
•
The ionized gas distribution exhibits a highly contrasted two-arm spiral structure extending up to about 2″, as well as a central unresolved peak of emission, representing a total gas mass of 2 M⊙.
-
•
The gas kinematics shows strong evidence for non-circular motions, with complex and broad line profiles on the inner side of the spiral arms.
-
•
We have detected a central, unresolved line-emitting component with , both in H, and in forbidden lines ([N ii] and [S ii]). Assuming this corresponds to an inner Keplerian disc within the central unresolved peak observed in the narrow-band (H+[N ii]) HST/WFPC2 image, this corresponds to an equivalent mass of about .
-
•
We built a dynamical model which provides a very good fit to the TIGER (and available long-slit) stellar kinematics without requiring the addition of an extra component such as a disc or a central dark mass. An upper limit of M⊙ for the mass of a potential supermassive black hole is derived under the assumption of a two-integral distribution function: a more general dynamical model could however relax this upper limit significantly.
-
•
A simple density wave ( bar) model provides a good explanation for the observed gas morphology and kinematics. Our mass model then inevitably implies the existence of a strong Inner Lindblad Resonance, which in turn leads to the presence of strong trailing shocks.
-
•
The best-fit bar model requires a quadrupole perturbation in the potential of only about 2% (with a maximum torque of 10%), with a pattern speed of km.s-1 kpc-1. This leads to radii for the Corotation and Inner Lindblad Resonance of 49 and 14 respectively.
-
•
Considering the low contrast of the required bar-like perturbation, its small size (270 pc in radius), and the presence of patchy dust in NGC 2974, such a structure would be difficult to detect photometrically in the visible. The presence of such inner bars may therefore be more common in early-type disk galaxies than generally thought. Still, the inner bar in NGC 2974 is of sufficient strength to drive gas from a few hundreds of parsecs inwards to the central tens of parsecs.
Acknowledgments.
EE wishes to thanks Witold Maciejewski for insightful discussions. This paper is based on observations taken with the Canada-France-Hawaii Telescope, operated by the National Research Council of Canada, the Centre National de la Recherche Scientifique of France, and the University of Hawaii. This paper is based on observations obtained with the NASA/ESA Hubble Space Telescope, which is operated by AURA, Inc., under NASA contract NAS 5–26555. EE is grateful to the Space Telescope Science Institute for a visitorship during which part of this project was carried out. PG was affiliated with the Astrophysics Division of the Space Science Department of the European Space Agency during part of this project.
References
- [Athanassoula 1992] Athanassoula E., 1992, MNRAS, 259, 345
- [Bacon et al. 1995] Bacon R., et al., 1995, A&AS, 113, 347
- [Bender 1990] Bender R., 1990, A&A, 229, 441
- [Bender et al. 1994] Bender R., Saglia R. P., Gerhard O., 1994, MNRAS, 269, 785
- [Bica 1988] Bica E., 1988, A&A, 195, 76
- [Block 2002] Block D. L., Bournaud F., Combes F., Puerari I., Buta R., 2002, A&A, 394, 35
- [Cappellari 2002] Cappellari M., 2002, MNRAS, 333, 400
- [Chokshi & Turner 1992] Chokshi A., Turner E. L., 1992, MNRAS, 279, 421
- [Cinzano & van der Marel 1994] Cinzano P., van der Marel R. P., 1994, MNRAS, 270, 325
- [Davies et al. 1987] Davies R. L., Burstein D., Dressler A., et al., 1987, ApJS, 64, 586
- [Elmegreen et al. 1998] Elmegreen, B. G., Elmegreen D. M., Brinks E., et al., 1998, ApJ, 503, L119
- [Elmegreen, Chromey, Santos 1998] Elmegreen D. M., Chromey, F. R., Santos, M., 1998, AJ, 116, 1221
- [Emsellem & Ferruit 2000] Emsellem E., Ferruit P., 2000, A&A 357, 111
- [Emsellem et al. 1994] Emsellem E., Monnet G., Bacon R., 1994, A&A, 285, 723
- [Emsellem et al. 1996] Emsellem E., Bacon R., Monnet G., Poulain P., 1996, A&A, 312, 777
- [Emsellem et al. 2001] Emsellem E., Greusard D., Combes F., et al., 2001, A&A, 368, 52
- [Erwin & Sparke 1999] Erwin H. P., Sparke L. S., 1999, ApJ, 521, L37
- [Erwin & Sparke 2002] Erwin H. P., Sparke L. S., 2002, AJ, 124, 65
- [Ferrarese & Merritt 2000] Ferrarese L., Merritt D., 2000, ApJ, 539, L9
- [Ferruit et al. 1999] Ferruit P., Wilson A. S., Falcke H., Simpson C., Pécontal E., Durret F., 1999, MNRAS, 309, 1
- [Fukuda et al. 1998] Fukuda H., Wada K., Habe A., 1998, MNRAS, 295, 463
- [Gebhardt et al. 2000] Gebhardt K., Bender R., Bower G., et al., 2000, ApJ, 539, L13
- [Goudfrooij & Emsellem 1996] Goudfrooij P., Emsellem E., 1996, A&A, 306, L45
- [Goudfrooij et al. 1994a] Goudfrooij P., Nørgaard-Nielsen H.U., Hansen L., et al., 1994a, A&AS, 104, 179
- [Goudfrooij et al. 1994b] Goudfrooij P., Nørgaard-Nielsen H.U., Hansen L., et al., 1994b, A&AS, 105, 341
- [Kim et al. 1988] Kim D.-W., Guhathakurta P., van Gorkom J. H., Jura M., Knapp G. R., 1988, ApJ, 330, 684
- [Krist 1992] Krist J., 1992, Tinytim v2.1 User Manual (STScI)
- [Maciejewski et al. 2002] Maciejewski W., Teuben P. J., Sparke L. S., Stone J. M., 2002, MNRAS, 329, 502
- [Martini & Pogge 1999] Martini P., Pogge R. W., 1999, AJ, 118, 2646
- [Monnet et al. 1992] Monnet G., Bacon R., Emsellem E., 1992, A&A, 253, 366
- [Pfenniger 1991] Pfenniger D., 1991, in Sundelius B., ed, Dynamics of disc galaxies. Chalmers Univ. Press, Göteborg, p. 191
- [Pfenniger & Norman 1990] Pfenniger D., Norman C. A., 1990, ApJ, 363, 391
- [Pizzella et al.(1997)] Pizzella, A., Amico, P., Bertola, F., Buson, L. M., Danziger, I. J., Dejonghe, H., Sadler, E. M., Saglia, R. P., de Zeeuw, P. T., Zeilinger, W. W., 1997, A&A, 323, 349
- [Plana et al. 1998] Plana H., Boulesteix J., Amram Ph., Carignan C., Mendes de Oliveira C., 1998, A&A 128, 75
- [Regan & Mulchaey 1999] Regan M., Mulchaey J. S., 1999, AJ, 117, 2676
- [Rieke & Lebofsky 1985] Rieke G. H., Lebofsky M. J., 1985, ApJ, 288, 618
- [Rousset 1992] Rousset, A., 1992, Ph.D. Thesis, Univ. de Saint-Etienne
- [Shlosman et al. 1989] Shlosman I., Frank J., Begelman M. C., 1989, Nat, 338, 45
- [Tonry et al.(2001)] Tonry, J. L., Dressler, A., Blakeslee, J. P., Ajhar, E. A., Fletcher, A. B., Luppino, G. A., Metzger, M. R., & Moore, C. B. 2001, ApJ, 546, 681
- [Wada 1994] Wada, K., 1994, PASJ, 46, 165
- [Wada & Koda 2001] Wada, K., Koda, J., 2001, PASJ, 53, 1163
- [Zeilinger et al. 1996] Zeilinger W. W., Pizzella A., Amico P., et al., 1996, A&AS, 120, 257