Abstract
During the last few years, a number of exceptional core-collapse supernovae (SNe) have been discovered. Although their properties are rather diverse, they have the common feature that at least some of their basic parameters (kinetic energy of the explosion, mass of the ejecta, mass of the synthesized 56Ni), and sometimes all of them, are larger, sometimes by more than an order of magnitude, than the values typically found for this type of SNe. Therefore, these SNe have been given the collective classification of ‘Hypernovae’. The best known object in this class is SN 1998bw, which owes its fame to its likely association with the gamma-ray burst (GRB) 980425. In this paper, we first describe how the basic parameters of SN 1998bw can be derived from observations and modeling, and discuss the properties of other hypernovae individually. These hypernovae seem to come from rather massive stars, being more massive than 20 - 25 on the main-sequence, thus forming black holes. On the other hand, there are some examples of massive SNe with only a small kinetic energy. We suggest that stars with non-rotating black holes are likely to collapse ”quietly” ejecting a small amount of heavy elements (Faint supernovae). In contrast, stars with rotating black holes are likely to give rise to very energetic supernovae (Hypernovae). We present distinct nucleosynthesis features of these two types of ”black-hole-forming” supernovae. Nucleosynthesis in Hypernovae are characterized by larger abundance ratios (Zn,Co,V,Ti)/Fe and smaller (Mn,Cr)/Fe. Nucleosynthesis in Faint supernovae is characterized by a large amount of fall-back. We show that the abundance pattern of the recently discovered most Fe deficient star, HE0107-5240, and other extremely metal-poor carbon-rich stars are in good accord with those of black-hole-forming supernovae, but not pair-instability supernovae. This suggests that black-hole-forming supernovae made important contributions to the early Galactic (and cosmic) chemical evolution. Finally we discuss the nature of First (Pop III) Stars.
keywords:
Supernovae, Hypernovae, Nucleosynthesis, Chemical Evolution, Gamma-Ray BurstsHypernovae and Other Black-Hole-Forming Supernovae
49 pages, to be published in ”Stellar Collapse” (Astrophysics and Space Science; Kluwer) ed. C. L. Fryer (2003)
1 Introduction
One of the most interesting recent developments in the study of supernovae (SNe) is the discovery of some very energetic supernovae, whose kinetic energy (KE) exceeds erg, about 10 times the KE of normal core-collapse SNe (hereafter erg). The most luminous and powerful of these objects, the Type Ic supernova (SN Ic) 1998bw, was probably linked to the gamma-ray burst GRB 980425 (Galama et al. 1998), thus establishing for the first time a connection between gamma-ray bursts (GRBs) and the well-studied phenomenon of core-collapse SNe. However, SN 1998bw was exceptional for a SN Ic: it was as luminous at peak as a SN Ia, indicating that it synthesized of 56Ni, and its KE was estimated at erg (Iwamoto et al. 1998; Woosley, Eastman, & Schmidt 1999). Because of its large KE, SN 1998bw was called a “Hypernova (HN)”.
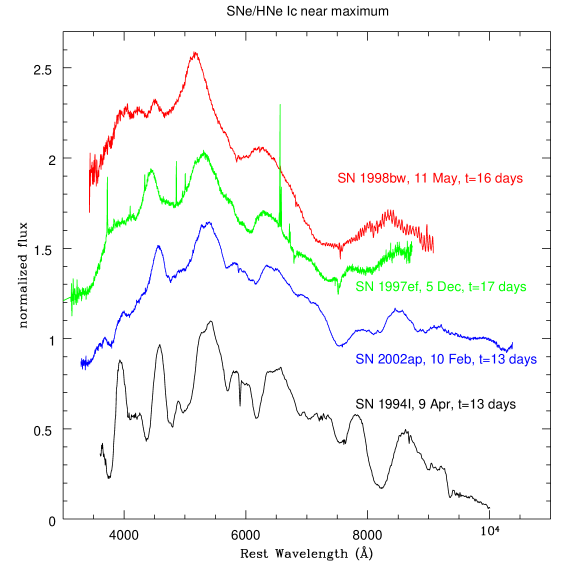
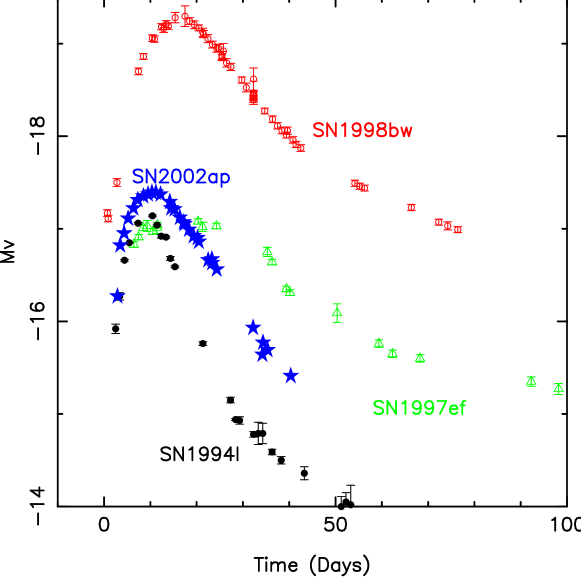
Subsequently, other “hypernovae” of Type Ic have been discovered or recognised, such as SN 1997ef (Iwamoto et al. 2000; Mazzali, Iwamoto & Nomoto 2000), SN 1997dq (Matheson et al. 2001), SN 1999as (Knop et al. 1999), and SN 2002ap (Mazzali et al. 2002). Although these SNe Ic did not appear to be associated with GRBs, most recent “hypernova” SN 2003dh is clearly associated with GRB 030329 (Stanek et al. 2003; Hjorth et al. 2003; Kawabata et al. 2003). Figures 1 and 2 show the near-maximum spectra and the absolute V-light curves of these hypernovae. These objects span a wide range of properties, although they all appear to be highly energetic compared to normal core-collapse SNe.
SN 1999as is the most luminous supernova ever discovered, reaching a peak magnitude , while the brightness of SN 2002ap appears to be similar to that of normal core collapse SNe. The analysis of these various objects suggests that the KE may be related to the progenitor’s main-sequence mass, which was probably for SN 1999as, for SN 1998bw, for SN 1997ef, and for SN 2002ap. Another possible hypernovae, although of Type IIn, were SN 1997cy and 1999E, which was also estimated to have a large mass ( ; Germany et al. 2000; Turatto et al. 2000; Rigon et al. 2003). These mass estimates place hypernovae at the high-mass end of SN progenitors, as they are always larger than the mass of the progenitors of normal core-collapse SNe, which is .
In the following sections, we examine the properties of these hypernovae as derived from optical light curves and spectra and discuss what may be the discriminating factor for the birth of a hypernova or the connection with a GRB. We then focus on nucleosynthesis in hypernovae, which is quite distinct from the case of ordinary supernovae, thus making a unique contribution to galactic chemical evolution.
2 SN 1998bw and GRB980425
In the early spectra of SN 1998bw, only few features were present. Absorption features were very broad, if present at all, while broad peaks were present at 4000, 5,000, 6,000 and 8,000 Å(Galama et al. 1998). The absence of any hydrogen lines, of any clear He I features, and of a strong Si II 6355 line indicated that SN1998bw should be classified as a Type Ic SN, despite some deviation from previously known objects of this class, mostly due to the extreme line width. SNe Ic are thought to be the result of core-collapse-induced explosions of C+O stars, which are massive stars that have lost their H-rich envelope and almost all of their He shell, through either a wind or binary interaction (Nomoto et al. 1994).
SN 1998bw is located in a spiral arm of the barred spiral galaxy ESO 184-G82, for which a distance is measured as Mpc from its redshift velocity 2550 km s-1 (Galama et al. 1998) and a Hubble constant km s-1 Mpc-1. Then, the peak absolute luminosity is estimated to be ergs sec-1, which is about ten times brighter than typical core-collapse SNe (SNe Ib/Ic, or II). Assuming that the GRB was at the same distance as SN 1998bw, the gamma-ray fluence of GRB980425 reported by the BATSE (CGRO) group, erg cm-2 (Kippen et al. 1998), corresponds to a burst energy ergs (in gamma-rays). This is four orders of magnitude smaller than for average GRBs, implying that either GRB980425 might not be a typical burst or that it may not be related to SN 1998bw. However, the recent case of GRB030329/SN2003dh has provided a solid evidence of connection between the ordinary GRBs and Hypernovae (Stanek et al. 2003; Hjorth et al. 2003; Kawabata et al. 2003). Wang & Wheeler (1998) studied the correlation between SNe and GRBs in the literature systematically.
Extensive follow-up observations of SN 1998bw have brought us invaluable information on this peculiar SN and put rather strong constraints on corresponding theoretical models.
Early Light Curve
The early light curve of SN 1998bw has been modeled based on spherically symmetric explosions. Various investigations reached the similar conclusion that the early light curve can be successfully reproduced by the explosion of a massive C+O star with a kinetic energy more than ten times larger than a canonical SN explosion (Iwamoto et al. 1998; Woolsey et al. 1999). Figure 5 compares the light curve of SN 1998bw with those of other SNe Ic and their model light curves (Table 1).
SN 1998bw showed a very early rise. It had a luminosity of erg s-1 already at day 1. This rapid rise requires the presence of 56Ni near the surface. Since spherically symmetric explosion models produce 56Ni in deep inner layers of the ejecta, they can only reproduce this behaviour if extensive mixing is postulated to have occurred, dredging 56Ni up to outer layers (Iwamoto et al. 1998; Nakamura et al. 2001a).
The light curve of SN 1998bw reaches the peak on about day 16, with the peak absolute magnitude being comparable to that of normal SNe Ia. We obtain a qualitative guess of model parameters such as ejecta mass , explosion kinetic energy erg, and the 56Ni mass by employing an analytic solution by Arnett (1982). At early times, the bolometric luminosity of a “compact” SN that is powered by radioactive decay of 56Ni is written as
| (1) |
where days and erg g-1 are the decay time of 56Ni and the energy deposited per gram of 56Ni, respectively, and the function is given by
| (2) |
It is assumed that 56Ni is distributed homogeneously and that -rays are all trapped in the ejecta. This latter assumption is correct at the early phases we are considering. The dimensionless variable , where is the elapsed time and is the characteristic time of the light curve , where and are the hydrodynamical time scale and the diffusion time scale of optical photons through the ejecta, respectively. The variable is defined as . For the principal mode of diffusion (Arnett 1982; Pinto & Eastman 2000), turns out to be
| (3) |
where is the effective opacity. Hereafter, the symbol denotes . The ejecta are assumed to be a sphere of constant density expanding homologously, and thus and erg are given by , , where , , and are the radius, density, and surface velocity of the ejecta, respectively.
| 56Ni mass | ||||||
|---|---|---|---|---|---|---|
| Model | () | () | () | () | () | (1051 erg) |
| CO138E50 | 40 | 13.8 | 10 | 0.4 | 4 | 50 |
| CO138E30 | 40 | 13.8 | 10.5 | 0.4 | 3.5 | 30 |
| CO138E7 | 40 | 13.8 | 11.5 | 0.4 | 2.5 | 7 |
| CO138E1 | 40 | 13.8 | 12 | 0.4 | 2 | 1 |
| CO100 | 30 | 10.0 | 7.6 | 0.15 | 2.4 | 10 |
| CO60 | 25 | 6.0 | 4.4 | 0.15 | 1.4 | 1 |
| CO21 | 15 | 2.1 | 0.9 | 0.07 | 1.2 | 1 |
Differentiating with respect to , it is found that has a maximum . As given in Table 1 of Arnett (1982), the maximum occurs at and (Arnett 2001). For SN 1998bw, corresponds to and , thus . Given the fact that the 56Co contribution doubles this luminosity at day , the mass of 56Ni is approximately given by
| (4) |
where is the peak luminosity in units of erg s-1. The observed peak luminosity of SN 1998bw, with being the distance, translates into an estimated mass of 56Ni , which is much larger than that of typical core-collapse SNe .
A constraint for and can be obtained from with the use of equation (3) such that
| (5) |
Another equation is necessary to resolve the degeneracy of masses and energies in this equation. One useful quantity to use is the evolution of the photospheric velocity, as this has a different dependence on the parameters and . The photospheric velocity can either be obtained from observations, determining the approximate velocity of absorption lines, or it can be computed in the explosion models. An equivalent but more quantitative approach is to compare the observed and synthetic spectra.
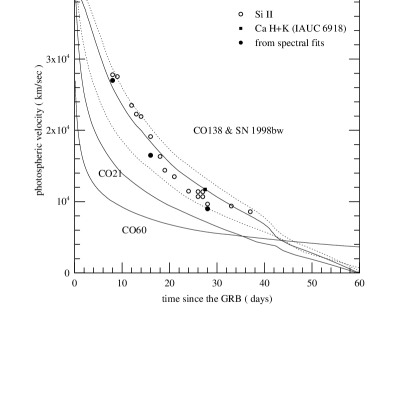
In Figure 3, the observed line velocities and photospheric velocities of SN 1998bw are compared with calculated photospheric velocities for different models. The radius of the photosphere is defined by . For the constant density sphere model used in analytic light curves, the photosphere is located at a fraction of the ejecta radius from the surface. Then, the photospheric velocity at early phases is given by
| (6) |
Using the fact that on day 8 km s-1, we obtain from equation (6) another constraint:
which, combined with equation (5), results in
| (7) |
This very large energy, exceeding erg, led us to refer to SN 1998bw as a “Hypernova (HN)”, an exceptional class of energetic SN explosion with kinetic energy (Iwamoto et al. 1998; Woosley et al. 1999). The above estimate provides model parameters in good agreement with those given by detailed light curve models (Iwamoto et al. 1998; Woosley et al. 1999; Nakamura et al. 2001a). Nakamura et al. (2001a) selected a model (CO138E50) with as the best model to reproduce the light curve and photospheric velocities using a distance Mpc and an extinction for SN1998bw (see Table 1 and Fig. 5).

Early Spectra
A more quantitative constraint on these basic model parameters and crucial diagnosis of chemical compositions of the ejecta can be obtained by detailed spectral modeling (Iwamoto et al. 1998; Branch 2001; Nomoto et al. 2001ab; Nakamura et al. 2001a; Mazzali et al. 2001).
Figure 4 shows early spectra of SN 1998bw for three epochs (Nakamura et al. 2001a; Patat et al. 2001). The spectra are dominated by broad absorption features. These line features are also seen in other SNe Ic. For SN 1998bw, however, they are exceptionally broad and blueshifted. Stathakis et al. (2000) found that absorption line minima are shifted 10-50 per cent blueward at day 15 in comparison with ordinary SNe Ic. These features shift significantly to the red over the three weeks covered by the spectra shown, indicating how the photosphere is receding to inner, lower velocity parts of the ejecta. The bluest of these features is likely due to Fe II lines, while the feature near 6000Å is dominated by Si II and the redmost one is a blend of O I and Ca II. That the O I and Ca I lines merge into a single broad absorption is very unusual for any SN, and it indicates that the ejecta velocities are very large (the line separation is km/s).
In Fig. 4, the observed spectra are compared with synthetic spectra computed with a hypernova model CO138E50 (Nakamura et al. 2001a). A distance modulus of mag and an extinction are adopted. The assumption of low reddening is supported by the upper limit of 0.1 Å in the equivalent width of Na i D line obtained from high-resolution spectra (Patat et al. 2001).
The synthetic spectra of CO138E50 are in good agreement with the observed spectra. The Si II feature near 6,000Å and, in particular, the OI+CaII feature between 7,000 and 8,000Å, are as broad as the observations. Nevertheless, the blue sides of those absorptions are still too narrow, indicating that the new model CO138E50 may not contain enough mass in the high velocity part. Nakamura et al. (2001a) tried a model CO138E50 with its density structure in the envelope made shallower artificially and examined the effect on the synthetic spectra. They found that a reduction of density gradient from to at km s-1 leads to a significant increase of mass in higher velocity regions, making strong absorption features at km s-1. Similar conclusions were reached by Branch (2001), who presented parameterized synthetic spectra for the early phases of SN 1998bw.
Late-time Light Curves and Spectra

The dominant contributions to the light curve change as the SN evovles. The light curve is initially powered by -rays from 56Co, then by positrons of the 56Co decay, and finally by -rays from 57Co and positrons from 44Ti.
The optical depth of the ejecta to the -ray photons produced by the 56Co decay, , is given by
| (8) |
where is the effective -ray opacity for the 56Co gamma-ray lines. In model CO138E50 for SN 1998bw, the ejecta become optically thin in -rays () at around day 50. Using a deposition fraction for (Colgate , Petschek, & Kriese 1980), we find
| (9) |
Assuming that the energy deposited by -rays is thermalized and subsequently radiated in optical/IR wavelengths, the bolometric luminosity is given by
where is the energy available per gram of 56Co per second
| (10) |
where erg g-1 and days are the energy deposited per gram of 56Co and its decay time, respectively. Since at late times most of the energy deposition comes from the 56Co decay, we have
| (11) | |||||
This luminosity depends on and as well as on . Thus we can use late-time light curves to distinguish between different models that produce similar early light curves. For CO138E50, equation (11) gives erg s-1 at day 400, which is in agreement with the observations of SN 1998bw (Fig. 5).
Figure 5 compares light curves calculated for hypernova models CO138E50 (solid line) and CO138E30 (long-dashed line) with the observed light curve of SN 1998bw (filled circles). The light curve of CO138E50 is consistent with the observations until day 50 but declines at a faster rate afterwards. The light curve of CO138E30 shows a slower decline, in better agreement with SN1998bw, but it still declines too rapidly (Nakamura et al. 2001a; McKenzie & Schaefer 1999; Patat et al. 2001). All of these models (see Table 1) originate from a 13.8 CO core, which is formed in a star. The explosion may have given rise to a Black Hole.
The early light curve of SN 1998bw is well reproduced by higher-energy models, but they deviate from the observations at late times. On the other hand, the late-time light curve is more easily reproduced by a lower-energy model with a smaller 56Ni mass (model CO138E7), which is however too dim at early phases (Nakamura et al. 2001a). This difficulty may be overcome if the ejecta have multiple components with different characteristic velocities, suggesting that either the density distribution or the 56Ni distribution in the ejecta or both are not spherically symmetric. A similar situation occurrs for SN 1997ef (Iwamoto et al. 2000; Mazzali et al. 2000) and SN 2002ap (Maeda et al. 2003).
As seen in Fig.5, the light curve of SN 1998bw seems to flatten after about day 400. The model light curves do not really follow this behavior. At days, the -ray deposition fraction decreases to below 1% in model CO138E50. However, about 3.5% of the decay energy of 56Co is carried by positrons (e.g., Axelrod 1980). These are effectively trapped in the ejecta because of the postulated weak magnetic fields (e.g. Colgate & Petschek 1979). Therefore, the energy deposition from positrons makes the dominant contribution to the light curve at days (dotted line in Fig. 5).

The luminosity provided by the positrons is given as
| (12) |
where the positrons are assumed to be completely trapped in the ejecta. Therefore, if the observed tail follows the positron-powered, exponentially declining light curve, the 56Co mass can be determined directly. However, the light curve of SN 1998bw after day 400 is still steeper than the positron-dominated light curve. The light curve of SN 1998bw showed a further flattening at around day 800. The latest observed point in Figure 5 is the HST observation on June 11, 2000 (day 778) (Fynbo 2000).
The observed magnitude (V = 25.41 0.25) is consistent with the prediction of CO138E7, but brighter than CO138E50 (Fig.5).
One possibility is that, as the density decreases, the recombination time scale becomes longer than the decay time and ionization freeze-out makes the bolometric light curve even flatter (Fransson & Kozma 1993). Another possible source of the excess luminosity is the emission of radiation due to the interaction of the ejecta with a circumstellar medium (CSM) (Sollerman et al. 2000). Finally, the flattening may be due to a contribution from an underlying star cluster (Fynbo 2000) rather than to the SN itself.
Late time spectra provide a wealth of information on the elemental abundances and their distributions in velocity space. SN 1998bw seems to have entered the nebular phase between day 65 and 115 (Mazzali et al. 2001; Patat et al. 2001). The spectroscopic features at late times are very similar to those of SNe Ic as shown in Figure 6. Dominant emission features include Mg I4571, an Fe II blend around 5,200 Å, the O I6300,6364 doublet, a feature around 7,200 Å(identified as Ca II and C II by Mazzali et al. 2001), and the Ca II IR triplet. What is different from ordinary SNe Ic, in particular, is the broadness of the line features. Patat et al. (2001) estimated the expansion velocity of the Mg I emitting region and found a value 9,800 500 km s-1on day 201. Stathakis et al. (2000) also found emission features 45 per cent broader than ordinary SNe Ic for day 94.
Mazzali et al. (2001) showed that the late time spectra of SN 1998bw (Patat et al. 2001) contain both broad and relatively narrow lines. They interpreted the absence of Fe III nebular lines as a sign of clumpiness of the ejecta. Interestingly, some Fe lines are found to be broader than O lines, which is the opposite as to what spherically symmetric models predict. This may imply that the explosion was aspherical (Fig. 6; Mazzali et al. 2001).
Aspherical Models
The result that the explosion energy of SN 1998bw was extremely large is based on the analysis of the light curve and spectra and on the assumption that the explosion was spherically symmetric. There is a possible alternative explanation for the large peak luminosity of SN 1998bw. If the explosion was aspherical, the estimate of the explosion energy might be smaller. There is growing evidence that light from SNe Ib/c is weakly polarized (%), implying that these explosions might be somewhat aspherical. A similar degree of polarization was observed in SN 1998bw at early photospheric phases (Kay et al. 1998; Iwamoto et al. 1998; Patat et al. 2001).
As discussed earlier, it is difficult to reproduce the entire light curve of SN 1998bw consistently using spherically symmetric models, indicating that there exists some degree of asphericity in the explosion of SN 1998bw. An analysis of the late-time light curve suggested a 56Ni mass (Sollerman et al. 2000), which is close to the values obtained with spherically symmetric models for early light curves. Thus, the possible effects of asymmetry in SN 1998bw seem to be only moderate.
In an asymmetric explosion, nucleosynthesis should also depart from spherical symmetry. Maeda et al. (2002) calculated nucleosynthesis in aspherical explosion models for SN 1998bw with a 2D hydrodynamical code and a detailed nuclear reaction network. They used the progenitor model CO138 (Iwamoto et al. 1998; Nakamura et al. 2001a) and assumed aspherical initial velocity profiles. Figure 7 shows the composition in the ejecta at the homologous expansion phase for erg and an initial axial-to-radial velocity ratio . In this model, 56Ni is synthesized preferentially along the polar axis, where the shock is stronger, while a lot of unburned material, dominated by O, is left at low velocity in the equatorial region, where burning is much less efficient.
Maeda et al. (2002) found that the nebular line profiles in SN 1998bw can be reproduced by such an aspherical model if the explosion is observed at an angle of about 15 degrees from the polar axis. At such an angle, one might expect that the GRB is weaker than it would be if observed along the jet axis. The actual aspect ratio of the ejecta is much smaller than 8:1, however, as the jet expands laterally, and this may be consistent with the observed polarization.
Such a highly aspherical explosion could occur in the collapse of a rotating stellar core that forms a system consisting of a rotating black hole and an accretion torus around it (MacFadyen & Woosley 1999). Thermal neutrinos from the torus release a large amount of energy as electron-positron pairs. If the black hole is accompanied by a strong magnetic field, rotational energy may be extracted from the black hole via the Blandford-Znajek mechanism (Blandford & Znajek 1977). Jet formation and propagation after energy deposition by the above processes are studied using hydrodynamical simulations (MacFadyen, Woosley, & Heger 2001; Aloy et al. 2000). MacFadyen et al. (2001) suggested that SN 1998bw may be a case in which a black hole was produced by ’fall back’ and the resulting jet was less collimated.
The aspherical SN explosion could also be induced in the neutron star formation, e.g., by a strong magnetic field (Nakamura 1998; Wheeler 2001) and convection driven by neutrino heating (e.g., Janka & Müller 1994; Fryer & Warren 2002). Shimizu et al. (2001) pointed out that anisotropy in the neutrino emission would increase the net energy gain by neutrino heating, which leads to a larger explosion energy than in spherically symmetric models.
3 SN 1997ef
This SN was an immediate precursor of SN 1998bw. Its broad-lined spectrum defied interpretation in the context of standard-energy explosion models (Iwamoto et al. 2000). The realization with SN 1998bw that energies much larger than the supposedly standard value erg were possible led to the reinterpretation of SN 1997ef as a hypernova, although of smaller energy than SN 1998bw.
Light Curve


The light curve tail starts only days after maximum, much later than in other SNe Ic. This can be reproduced by different explosion models. In Figure 8 we compare the calculated V light curves for the standard energy model CO60 and the energetic model CO100 (erg) with the observed V light curve of SN1997ef. We adopt a distance of 52.3 Mpc (a distance modulus of mag) as estimated from the recession velocity, 3,400 km s-1 (Garnavich et al. 1997) and a Hubble constant km s-1 Mpc-1. We assume no color excess, . The light curve of SN 1997ef has a very broad maximum, which lasts for 25 days.
Since the model parameters of CO100 and CO60 give similar timescales, the light curves of the two models look similar: both have quite a broad peak and reproduce the light curve of SN1997ef reasonably well (Fig. 8).
The light curve shape depends also on the distribution of 56Ni, which is produced in the deepest layers of the ejecta. More extensive mixing of 56Ni leads to an earlier rise of the light curve. For SN 1997ef, the best fit is obtained when 56Ni is mixed almost uniformly to the surface for both models. Without such extensive mixing, the rise time to V 16.5 mag would be 30 d for CO100. However, spectroscopic dating suggests that the peak occurred days after the explosion.
Model CO60 has the same kinetic energy ( erg) as model CO21, which was used for SN Ic 1994I (see Table 1 for the model parameters). Since the light curve of SN 1997ef is much slower than that of SN 1994I, the ejecta mass of CO60 is 5 times larger than that of CO21.
The ejecta mass of CO100 is a factor of larger than that of CO60, and it is only % smaller than that of model CO138, which was used for SN 1998bw (Table 1). Thus the explosion energy of CO100 should be times larger than that of CO60 to reproduce the light curve of SN 1997ef. This explosion is very energetic, but still much weaker than the one in CO138. The smaller for a comparable mass allows CO100 to reproduce the light curve of SN 1997ef, which has a much broader peak than that of SN 1998bw.
The light curve of SN 1997ef enters the tail around day 40. Since then, the observed V magnitude declines linearly with time at a rate of mag day-1, which is slower than in other SNe Ic and is close to the 56Co decay rate mag day-1. Such a slow decline implies much more efficient -ray trapping in the ejecta of SN 1997ef than in SN 1994I. The ejecta of both CO100 and CO60 are fairly massive and are able to trap a large fraction of the -rays, so that the calculated light curves have slower tails compared with CO21.
However, the light curves of both models decline somewhat faster in the tail than the observations. A similar discrepancy has been noted for the Type Ib supernovae (SNe Ib) 1984L and 1985F (Swartz & Wheeler 1991; Baron, Young, & Branch 1993). The late time light curve decline of these SNe Ib is as slow as the 56Co decay rate, so that the inferred value of is significantly larger (and/or is smaller) than those obtained by fitting the early light curve shape. Baron et al. (1993) suggested that the ejecta of these SNe Ib must be highly energetic and as massive as 50 . We will suggest that such a discrepancy between the early- and late-time light curves might be an indication of asphericity in the ejecta of SN 1997ef and that it might be the case in those SNe Ib as well.
Spectra
As we have shown, light curve modeling provides direct constraints on and . However, it is difficult to determine uniquely these values, and hence the characteristics of the explosion, from the light curve shape alone, since models with different values of and can yield similar light curves. Fortunately, however, models with different values of and are expected to show different spectral evolution.
Using detailed spectrum synthesis, we can therefore distinguish between different models clearly, because the spectrum contains much more information than a single-band light curve.
Around maximum light, the spectra of SN 1997ef show just a few very broad features, and are quite different from those of ordinary SNe Ib/c, but similar to those of SN 1998bw. However, at later epochs the spectra develop features that are easy to identify, such as the Ca II IR triplet at Å, the O I absorption at 7500 Å, several Fe II features in the blue, and they look very similar to the spectrum of the ordinary SN Ic 1994I.
We computed synthetic spectra with a Monte Carlo spectrum synthesis code using the density structure and composition of the hydrodynamic models CO60 and CO100. We produced synthetic spectra for three epochs near maximum, of SN 1997ef: Nov 29, Dec 5, and Dec 17. These are early enough that the spectra are very sensitive to changes in the kinetic energy. As in the light curve comparison, we adopted a distance modulus of mag, and .
In Figure 9 (upper) we show the synthetic spectra computed with the ordinary SN Ic model CO60. The lines in the spectra computed with this model are always much narrower than the observations. This clearly indicates a lack of material at high velocity in model CO60, and suggests that the kinetic energy of this model is much too small.
Synthetic spectra obtained with the hypernova model CO100 for the same 3 epochs are shown in Figure 9 (lower). The spectra show much broader lines, and are in good agreement with the observations. In particular, the blending of the Fe lines in the blue, giving rise to broad absorption troughs, is well reproduced. The two ‘emission peaks’ observed at and 5200Å correspond to the only two regions in the blue that are relatively line-free.
The spectra are characterized by a low temperature, even near maximum, because the rapid expansion combined with the relatively low luminosity (from the tail of the light curve we deduce that SN 1997ef produced about of 56Ni, compared to about in a typical SN Ia and in SN 1998bw) leads to rapid cooling. Thus the Si ii 6355Å line is not very strong.
Model CO100 has erg, , Ni) . From these values, we find , . A CO core is formed in a star. Although model CO100 yields rather good synthetic spectra, it still fails to reproduce the observed large width of the O I - Ca II feature in the only near-maximum spectrum that extends sufficiently far to the red (5 Dec 1997). An improvement can be obtained by introducing an arbitrary flattening of the density profile at the highest velocities (Mazzali et al. 2000; Branch 2001). This leads to higher values of both and .
Possible Aspherical Effects
The light curve, the photospheric velocities, and the spectra of SN 1997ef are better reproduced with the hyper-energetic model CO100 than with the ordinary SN Ic model CO60. However, there remain several features that are still difficult to explain with model CO100.
These discrepancies may be interpreted as a possible sign of asphericity in the ejecta: A part of the ejecta moves faster than average to form the lines at high-velocities at early phases, while the other part of ejecta expands with a lower velocity so that the low-velocity Si II line comes up at later epochs. Having a low-velocity component would also make it easier to reproduce the slow tail and the long duration of the photospheric phase.
Extensive mixing of 56Ni is required to reproduce the short rise time of the light curve. One possibility to induce such mixing in the velocity space is an asymmetric explosion. In the extremely asymmetric cases, material ejection may take place in a jet-like form (e.g., MacFadyen & Woosley 1999; Khokhlov et al. 1999). A jet could easily bring some Ni from the deepest layers out to the high velocity surface. The lack of a strong case of coincidence with a GRB suggests that if a jet was produiced it was either weak or it was not pointing towards us.
Unlike other hypernovae, SN 1997ef does not seem to be a unique case. At least two other SNe, SN 1997dq (Matheson et al. 2001) and SN 1999ey show very similar properties. Unfortunately, these two objects were not very intensively observed. Whether this is just a coincidence, or whether it really indicates that SN 1997ef-like hypernovae are more frequent than others remains an interesting question that must be answered observationally.
4 SN 2002ap

SN Ic 2002ap was discovered in M74 on 2002 January 30 (Hirose 2002). The SN was immediately recognised as a hypernova from its broad spectral features (Kinugasa et al. 2002; Meikle et al. 2002; Gal-Yam, Ofek & Shemmer 2002; Filippenko & Chornock 2002). This indicates high velocities in the ejected material, which is the typical signature of hypernovae. It was therefore followed from several observatories, and the relative proximity also favored observations with small telescopes. Luckily, the SN was discovered very soon after it exploded: the discovery date was January 29, while the SN was not detected on January 25 (Nakano, Kushida, & Li 2002). This is among the earliest any SN has been observed, with the obvious exceptions of SN 1987A and SN 1993J.
Light Curve
Figure 2 shows the -band light curves of the same four SNe as in Figure 1. SN 2002ap reached maximum on about February 8 at mag. SN 2002ap peaks earlier than both hypernovae 1998bw and 1997ef, but later than the normal SN 1994I, suggesting an intermediate value of the ejecta mass .
Using a distance to M74 of 8 Mpc ( mag; Sharina, Karachentsev, & Tikhonov 1996), and a combined Galaxy and M74 reddening of mag (estimated from a Subaru HDS spectrum; Takada-Hidai, Aoki, & Zhao 2002), the absolute magnitude is . This is comparable to SN 1997ef and fainter than SN 1998bw by almost 2 mag. Since peak brightness depends on the ejected 56Ni mass, SNe 2002ap, 1997ef, and 1994I appear to have synthesized similar amounts of it. Estimates were for SN 1994I (Nomoto et al. 1994) and 0.13 for SN 1997ef (Mazzali et al. 2000). The 56Ni mass for SN 2002ap is estimated to be , which is similar to that of normal core-collapse SNe such as SNe 1987A and 1994I.
Spectra
Figure 1 shows the maximum-light spectra of SN 2002ap, of the hypernovae SNe 1998bw and 1997ef, and of the normal SN Ic 1994I. If line width is the distinguishing feature of a hypernova, then clearly SN 2002ap is a hypernova, as its spectrum resembles that of SN 1997ef much more than that of SN 1994I. Line blending in SN 2002ap and SN 1997ef is comparable. However, some individual features that are clearly visible in SN 1994I but completely blended in SN 1997ef can at least be discerned in SN 2002ap (e.g. the Na i–Si ii blend near 6000 Å and the Fe ii lines near 5000 Å). Therefore, spectroscopically SN 2002ap appears to be located just below SN 1997ef in a “velocity scale,” but far above SN 1994I, which appears to confirm the evidence from the light curve.
The spectral evolution of SN 2002ap shown in Figure 10 appears to follow closely that of SN 1997ef, at a rate about 1.5 times faster. The spectra and the light curve of SN 2002ap can be well reproduced by a model with ejected heavy-element mass = 2.5–5 and –10. Both and are much smaller than those of SNe 1998bw and 1997ef (but they could be larger if a significant amount of He is present).
Is SN 2002ap a Hypernova or a Supernova?
Although SN 2002ap appears to lie between normal core-collapse SNe and hypernovae, it should be regarded as a hypernova because its kinetic energy is distinctly higher than for normal core-collapse SNe. In other words, the broad spectral features that characterize hypernovae are the results of a high kinetic energy. Also, SN 2002ap was not more luminous than normal core-collapse SNe. Therefore brightness alone should not be used to discriminate hypernovae from normal SNe, while the criterion should be a high kinetic energy, accompanied by broad spectral features. Further examples of hypernovae are necessary in order to establish whether a firm boundary between the two groups exists.
For these values of , , and Ni), we can constrain the progenitor’s main-sequence mass and the remnant mass . Modeling the explosions of C+O stars with various masses, we obtain Ni) as a function of the parameter set (, , ). The model which is most consistent with our estimates of (, ) is one with , , and . The 5 C+O core forms in a He core of mass , corresponding to a main-sequence mass –25 . The relation depends on convection and metallicity (e.g., Nomoto & Hashimoto 1988; Umeda & Nomoto 2002).
The estimated progenitor mass and explosion energy are both smaller than those of previous Hypernovae such as SNe 1998bw and 1997ef, but larger than those of normal core-collapse SNe such as SN 1999em. This mass range is consistent with the non-detection of the progenitor in pre-discovery images of M74 (Smartt et al. 2002).
Given the estimated mass of the progenitor, binary interaction including the spiral-in of a companion star (Nomoto et al. 2001a) is probably required in order for it to lose its hydrogen and some (or most) of its helium envelope. This would suggest that the progenitor was in a state of high rotation. It is possible that a high rotation rate and/or envelope ejection are also necessary conditions for the birth of a hypernova.
Possible Aspherical Effects
SN 2002ap was not apparently associated with a GRB. This may actually be not so surprising, since the explosion energy of SN 2002ap is about a factor of 5-10 smaller than that of SN 1998bw, as also indicated by the weak radio signature (Berger, Kulkarni, & Chevalier 2002). The present data show no clear signature of asymmetry, except perhaps for some polarization (Kawabata et al. 2002; Leonard et al. 2002; Wang et al. 2003), which is smaller than that of SN 1998bw. This suggests that the degree of asphericity is smaller in SN 2002ap and that the possible “jet” may have been weaker, which makes GRB generation more difficult.
5 SN 1999as
SN 1999as was discovered on February 18, 1999 by the Supernova Cosmology Project (Knop et al. 1999) in an anonymous galaxy having a redshift of 0.127. The absolute magnitude was exceptionally bright, , at least nine times brighter than the hypernova SN 1998bw.
SN 1999as is spectroscopically classified as a SN Ic because its photospheric phase spectra show no conspicuous lines of hydrogen, He I, or Si II 6355. The usual SN Ic spectral lines such as Ca II and O I are very broad, like in other hypernovae. However, some narrow ( 2000 km s-1) but highly blueshifted ( 11,000 km s-1) lines of Fe II are also present (Hatano et al. 2001).
By fitting the observed light curve, we have obtained the following constraints on the explosion model: the ejected mass 10 – 20 , the kinetic energy of ejected matter 1052 – 1053 ergs, and the mass of ejected radioactive 56Ni 4 (Deng et al. 2001). The progenitor of this may have been as massive as , and the explosion almost certainly resulted in the formation of a Black Hole. Unfortunately, the spectral coverage is not very extensive, and an accurate determination of the properties of this supernova is therefore difficult.
The asymmetric hydrodynamical model of Maeda et al. (2002) could represent this new class of hypernovae. In this model, a clump of freshly synthesized 56Ni exists at high velocity ( 15,000 km s-1) near the symmetry axis; such a clump could produce narrow but high–velocity absorption lines if the viewing angle with respect to the symmetry axis is small. On the other hand, the lack of a detected GRB may suggest that the angle was not very small.
6 Type IIn Hypernova: SN 1997cy and SN 1999E
SN 1997cy is a different type of hypernova, as it is of Type IIn. However, the energy deduced from its light curve is extremely large. The energy reveals itself in the strength of the ejecta-CSM interaction. Furthermore, the SN may have a correlated GRB. SN 1999E is very similar to SN 1997cy in the spectra and light curve (Rigon et al. 2003).
SN 1997cy displayed narrow H emission on top of broad wings, which lead to its classification as a Type IIn (Germany et al. 2000; Turatto et al. 2000). Assuming for the galactic extinction (NED) we get an absolute magnitude at maximum . It is the brightest SN II discovered so far. The light curve of SN 1997cy does not conform to the classical templates of SN II, namely Plateau and Linear, but resembles the slow evolution of Type IIn SN 1988Z. As seen from the uvoir bolometric light curve in Figure 11, the SN light curve decline is slower than the 56Co decay rate between day 120 to 250, suggesting circumstellar interaction for the energy source. (Here the outburst is taken to be coincident with GRB970514.)
In the interaction model (Turatto et al. 2000), collision of the SN ejecta with the slowly moving circumstellar matter (CSM) converts the kinetic energy of the ejecta into light, thus producing the observed intense light display of the SN. The exploratory model considers the explosion of a massive star of with a parameterized kinetic energy . The collision is assumed to start near the stellar radius at a distance , where the density of the CSM is , and adopt for the CSM a power-law density profile . The parameters , , and , are constrained from comparison with the observations.
The regions excited by the forward and reverse shock emit mostly X-rays. The density in the shocked ejecta is so high that the reverse shock is radiative and a dense cooling shell is formed (e.g., Suzuki & Nomoto 1995; Terlevich et al. 1992). The X-rays are absorbed by the outer layers and the core of the ejecta, and re-emitted as UV-optical photons.
Narrow lines are emitted from the slowly expanding unshocked CSM photoionized by the SN UV outburst or by the radiation from the shocks; intermediate width lines come from the shock-heated CSM; broad lines come from either the cooler region at the interface between ejecta and CSM.
Figure 11 shows the model light curve which best fits the observations. The model parameters are: erg, g cm-3 at cm (which corresponds to a mass-loss rate of yr-1 for a wind velocity of 10 km s-1), and . The large mass-loss episode giving rise to the dense CSM is supposed to occur after the progenitor makes a loop in the HR diagram from BSG to RSG. In this model, the mass of the low-velocity CSM is , which implies that the transition from BSG to RSG took place about yr before the SN event.
The large CSM mass and density are necessary to have large shocked masses and thus to reproduce the observed high luminosity, and so is the very large explosion energy. For models with low and high , the reverse shock speed is too low to produce a sufficiently high luminosity. For example, a model with erg and as above yields a value of lower than the observed luminosity by a factor of 5. For high or low , the expansion of the SN ejecta is too fast for the cooling shell to absorb enough X-rays to sustain the luminosity. Thus in this model and are constrained within a factor of 3 of the reported values.
The shape of the light curve constrains the circumstellar density structure. For , the case of a steady wind, decreases too rapidly around day 200. To reproduce the observed decrease after day 300, the CSM density is assumed to drop sharply at the radius the forward shock reaches at day 300, so that the collision becomes weaker afterwards. (Such a change of the CSM density corresponds to the transition from BSG to RSG of the progenitor yr before the SN explosion.) This is consistent with the simultaneous decrease in the H luminosity.

The observed light curve drops sharply after day 550. The model reproduces such a light curve behavior (Figure 11) assuming that when the reverse shock propagates through 5 , it encounters exceedingly low density region and thus it dies. In other words, the model for the progenitor of SN 1997cy assumes that most of the core material has fallen into a massive black hole of, say, , while the extended H/He envelope of 5 has not collapsed. Then material is ejected from the massive black hole possibly in a jet-like form, and the envelope is hit by the “jet” and ejected at high velocity.
In this model, the ejecta are basically the H/He layers and thus contain the original (solar abundance) heavy elements plus some heavy elements mixed from the core (before fall back) or jet materials. This might explain the lack of oxygen and magnesium lines in the spectra particularly at nebular phases (Turatto et al. 2000).
7 Properties of Hypernovae
Based on the observed objects and their interpretation, it is possible to make some generalisation regarding the properties of Hypernovae and their relation to the progenitor stars.
The Explosion Kinetic Energy
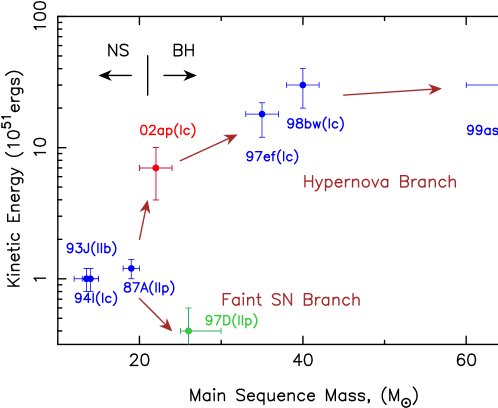
In Figure 12 we plot as a function of the main-sequence mass of the progenitor star as derived from fitting the optical light curves and spectra of various hypernovae, of the normal SNe 1987A, 1993J, and 1994I (e.g., Shigeyama & Nomoto 1990; Nomoto et al. 1993; Nomoto et a. 1994; Shigeyama et al. 1994; Iwamoto et al. 1994; Woosley et al. 1994; Young, Baron, & Branch 1995), and of SNe 1997D (Turatto et al. 1998). Properties of Type Ib/c supernovae/hypernovae thus derived are summarized in Table 2. It appears that increases with , forming a ‘Hypernova Branch’, reaching values much larger than the canonical erg. SNe 1997D and 1999br, on the contrary, are located well below that branch, forming a ’Faint SN Branch’.
This trend might be interpreted as follows. Stars with 20-25 form a neutron star (SN 1987A may be a borderline case between the neutron star and black hole formation). Stars with 20-25 form a black hole (e.g., Ergma & van den Heuvel 1998); whether they become hypernovae or faint SNe may depend on the angular momentum in the collapsing core, which in turn depends on the stellar winds, metallicity, magnetic fields, and binarity.
Hypernovae might have rapidly rotating cores owing possibly to the spiraling-in of a companion star in a binary system. The core of faint SNe II might not have a large angular momentum, because the progenitor had a massive H-rich envelope so that the angular momentum of the core might have been transported to the envelope possibly via a magnetic-field effect.
Between these two branches, there may be a variety of SNe. A dispersion in the properties of SNe II-P has been reported (Hamuy 2003).
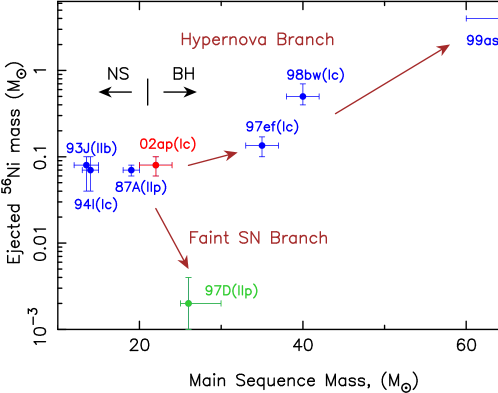
The Mass of Ejected 56Ni
A similar relation is observed between the mass of 56Ni, Ni), synthesized in core-collapse supernovae and in Figure 12, which is important to know for the study of the chemical evolution of galaxies. Stars with 20-25 , forming a neutron star, produce 0.08 0.03 56Ni as in SNe 1993J, 1994I, and 1987A.
For stars with 20-25 , which form black holes, Ni) appears to increase with in the ‘Hypernova Branch’, while SNe in the ’ Faint SN Branch’ produced only very little 56Ni. For faint SNe, because of the large gravitational potential, the explosion energy was so small that most of 56Ni fell back onto a compact star remnant.
| 83N | 94I | 02ap | 97ef | 98bw | |
| Ib | Ic | Ic (Hypernovae) | |||
| Pre-explosion | |||||
| 15 | 15 | 21 | 34 | 40 | |
| 4 | 4 | 6.6 | 13 | 16 | |
| 2 | 2 | 4.5 | 11 | 14 | |
| 4 | 2.1 | 4.6 | 11.1 | 13.8 | |
| Post-explosion | |||||
| 1.25 | 1.2 | 2.1 | 1.6 | 2.9 | |
| 2.75 | 0.9 | 2.5 | 9.5 | 10.9 | |
| 2.0 | 0 | 0.1 | 0 | 0 | |
| 0.5 | 0.6 | 1.8 | 5.3 | 8 | |
| 0.1 | 0.2 | 0.5 | 4 | 2 | |
| 0.15 | 0.07 | 0.1 | 0.13 | 0.7 | |
| 1 | 1 | 7 | 19 | 30 | |
Asymmetry
All Hypernovae of Type Ic show some signatures of asymmetry, or at least of a departure from purely 1-dimensional spherically symmetric models. This may support the case for their connection with at least some GRB’s.
So far only SN 1998bw and 2003dh have the well established connection with GRBs. In the other cases, either a GRB was not generated, or if it was it was weak and/or not pointing towards us. The issue of directionality is very important. If hypernovae are aspherical, we expect to find a range of hypernova properties for the same Ni mass. This can be established at late times, independetly of the shape of the ejecta. These objects may be very different at early phases, showing different light curves, velocities, abundances. So far, however, this evidence is missing.
Gamma-Ray Bursts/Supernovae Connection
Candidates for the GRB/SN connection include GRB 980425/SN Ic 1998bw (Galama et al. 1998; Iwamoto et al. 1998), GRB 971115/SN Ic 1997ef (Wang & Wheeler 1998), GRB 970514/SN IIn 1997cy (Germany et al. 2000; Turatto et al. 2000), GRB 980910/SN IIn 1999E (Thorsett & Hogg1999), and GRB 991002/SN IIn 1999eb (Terlevich, Fabian, & Turatto 1999). Recently, GRB 030329 has shown the evidence of a supernova (SN Ic 2003dh) in its optical afterglow spectra, confirming the GRB/SN connection directly (Stanek et al. 2003; Hjorth et al. 2003; Kawabata et al. 2003).
Several GRB’s are suggested to be associated with SNe, such as GRB 980326 (Bloom et al. 1999), GRB 970228 (Reichart 1999; Galama et al. 2000), and GRB 011121/SN 2001ke (Bloom et al. 2002; Garnavich et al. 2002). The decline of the light curve of the optical afterglows of these GRBs slowed down at late phases, and this can be reproduced if a red-shifted SN 1998bw-like light curve is superposed on the power-law component.
A question is whether the supernovae associated with GRBs have a uniform maximum luminosity, i.e., whether 0.5 56Ni production as in SN 1998bw is rather common or not. Figure 12 shows that the 56Ni mass and thus intrinsic maximum brightness of Hypernovae has a large diversity. We certainly need more examples before we can define the luminosity function and the actual distribution of masses of 56Ni produced in supernovae/hypernovae.
For several hypernovae such as SNe 1998ey and 2002ap, no GRB counterpart has been proposed. These hypernovae were less energetic events than SN 1998bw. It is possible that a weaker explosion is less efficient in collimating the -rays to give rise to a detectable GRB (GRB980425 was already quite weak compared to the average GRBs), or that some degree of inclination of the beam axis to the line-of-sight results in a seemingly weaker supernova and in the non-detection of a GRB. Only the accumulation of more data will allow us to address these questions.
Properties of hypernova nucleosynthesis suggest that hypernovae of massive stars may make important contributions to the Galactic (and cosmic) chemical evolution (Nakamura et al. 2001b; Nomoto et al. 2001b). In view of small frequencies of GRBs, this implies that hypernovae are much more frequent than GRBs, i.e., only a special class of hypernovae gives rise to GRBs (Nomoto et al. 2003).
8 Possible Evolutionary Scenarios to Hypernovae
Here we classify possible evolutionary paths leading to C+O star progenitors. In particular, we explore the paths to the progenitors that have rapidly rotating cores with a special emphasis, because the explosion energy of hypernovae may be extracted from rapidly rotating black holes (Blandford & Znajek 1977).
(1) Case of a single star: If the star is as massive as 40 , it could lose its H and He envelopes in a strong stellar wind (e.g., Schaller et al. 1992). This would be a Wolf-Rayet star.
(2) Case of a close binary system: Suppose we have a close binary system with a large mass ratio. In this case, the mass transfer from star 1 to star 2 inevitably takes place in a non-conservative way, and the system experiences a common envelope phase where star 2 is spiraling into the envelope of star 1. If the spiral-in releases enough energy to remove the common envelope, we are left with a bare He star (star 1) and a main-sequence star (star 2), with a reduced separation. If the orbital energy is too small to eject the common envelope, the two stars merge to form a single star (e.g., van den Heuvel 1994).
(2-1) For the non-merging case, possible channels from the He stars to the C+O stars are as follows (Nomoto, Iwamoto, & Suzuki 1995).
(a) Small-mass He stars tend to have large radii, so that they can fill their Roche lobes more easily and lose most of their He envelope via Roche lobe overflow.
(b) On the other hand, larger-mass He stars have radii too small to fill their Roche lobes. However, such stars have large enough luminosities to drive strong winds to remove most of the He layer (e.g., Woosley, Langer, & Weaver 1995). Such a mass-losing He star would again be a Wolf-Rayet star.
Thus, from the non-merging scenario, we expect two different kinds of SNe Ic, fast and slow, depending on the mass of the progenitor. SNe Ic from smaller mass progenitors (channel 2-1-a) show faster light-curve and spectral evolutions, because the ejecta become more quickly transparent to both gamma-ray and optical photons. The slow SNe Ic originate from the Wolf-Rayet progenitors (channels 1 and 2-1-b). The presence of both slow and fast SNe Ib/Ic has been noted by Clocchiatti & Wheeler (1997).
(2-2) For the merging case, the merged star has a large angular momentum, so that its collapsing core must be rotating rapidly. This would lead to the formation of a rapidly rotating black hole from which possibly a hyper-energetic jet could emerge. If the merging process is slow enough to eject the H/He envelope, the star would become a rapidly rotating C+O star. Such stars are the candidates for the progenitors of Type Ic hypernovae like SNe 1997ef and 1998bw. If a significant amount of H-rich envelope remains after merging, the rapidly rotating core would lead to a hypernova of Type IIn possibly like SN 1997cy (or Type Ib).
9 Explosive Nucleosynthesis in Hypernovae


In core-collapse supernovae/hypernovae, stellar material undergoes shock heating and subsequent explosive nucleosynthesis. Iron-peak elements are produced in two distinct regions, which are characterized by the peak temperature, , of the shocked material. For K, material undergoes complete Si burning whose products include Co, Zn, V, and some Cr after radioactive decays. For K K, incomplete Si burning takes place and its after decay products include Cr and Mn (e.g., Hashimoto, Nomoto, & Shigeyama 1989; Thielemann, Nomoto, & Hashimoto 1996).
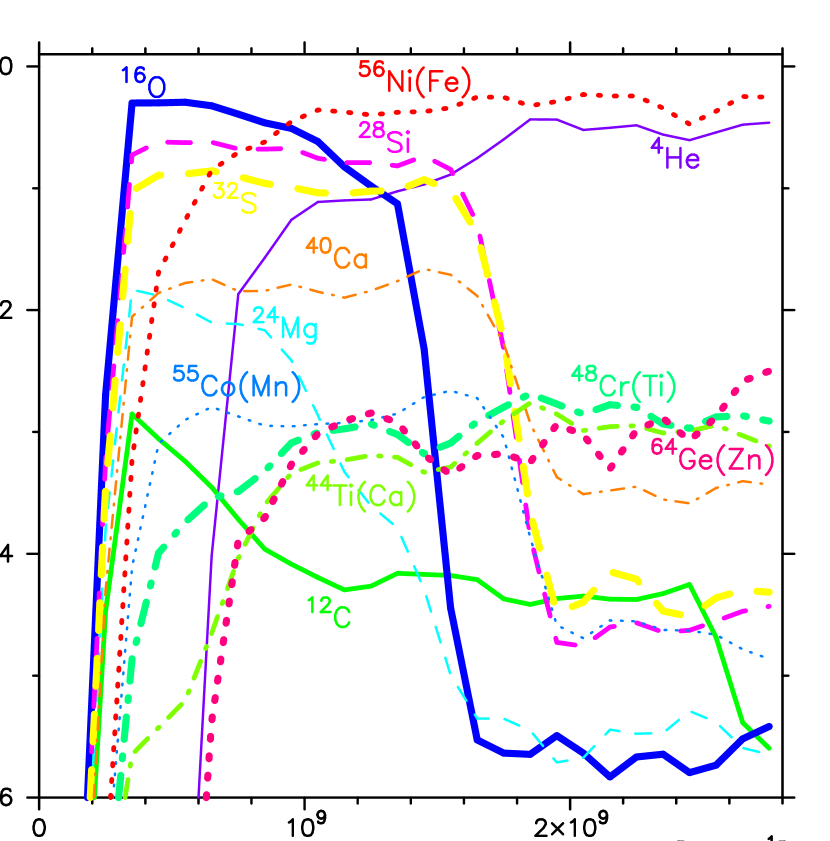
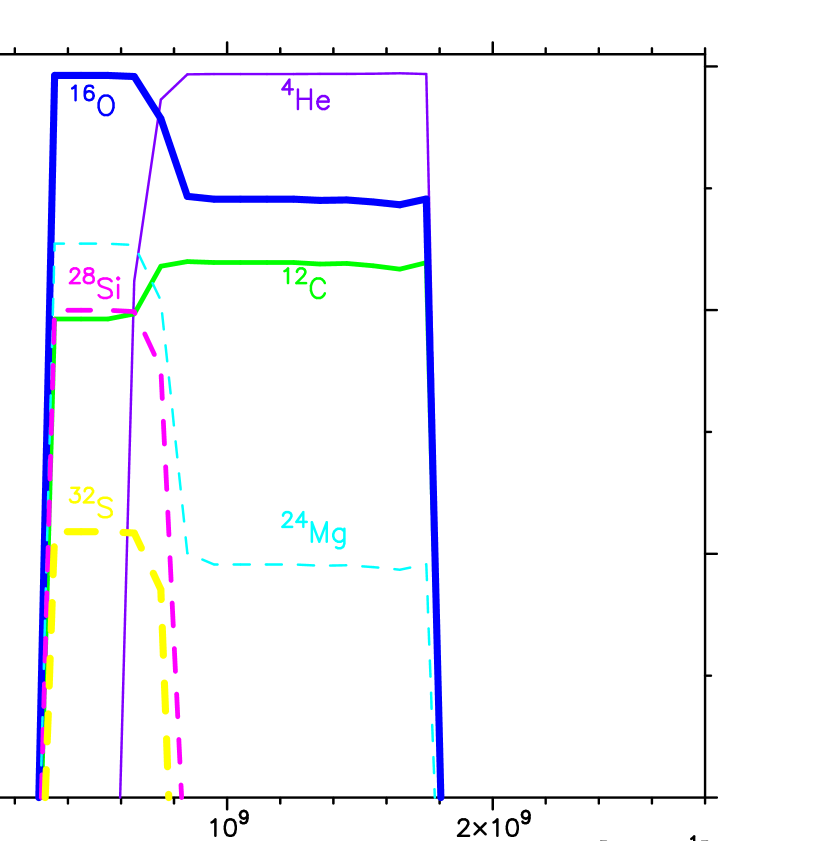
Supernovae vs. hypernovae
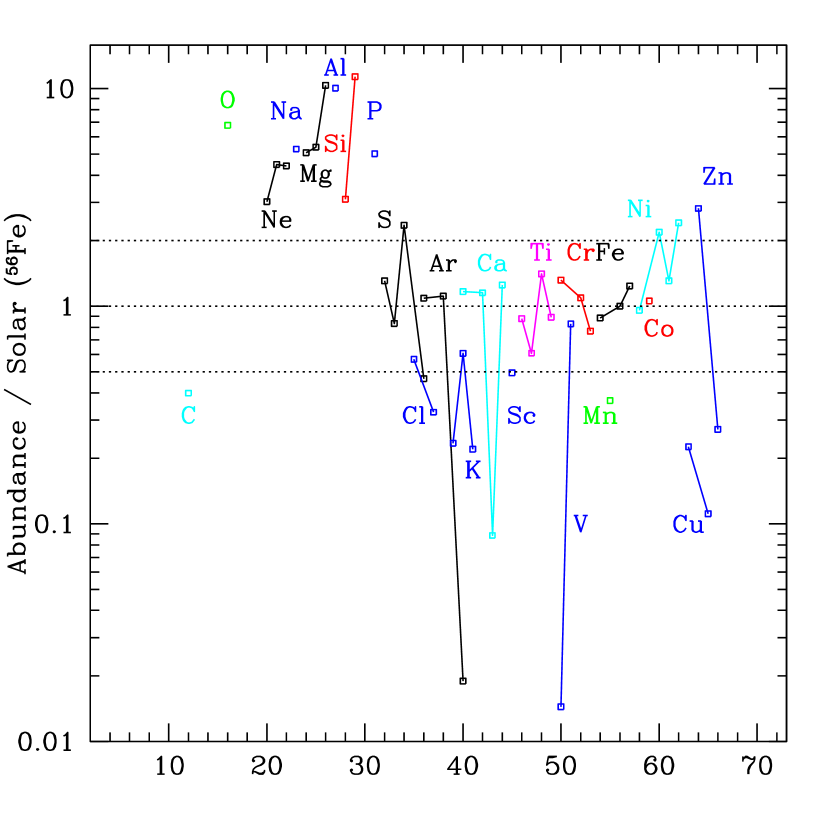
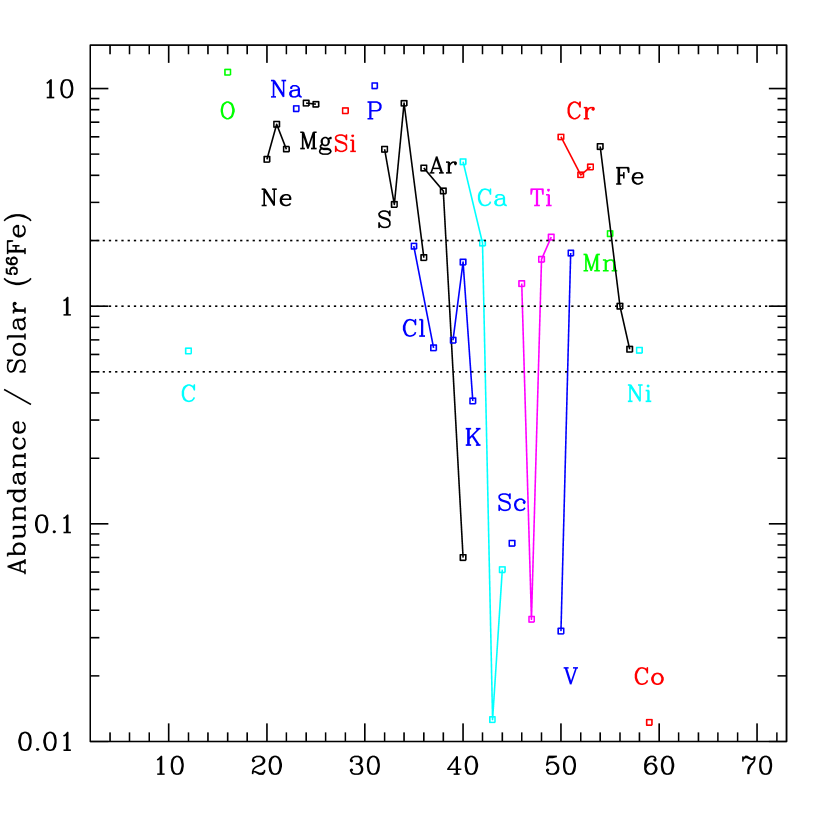
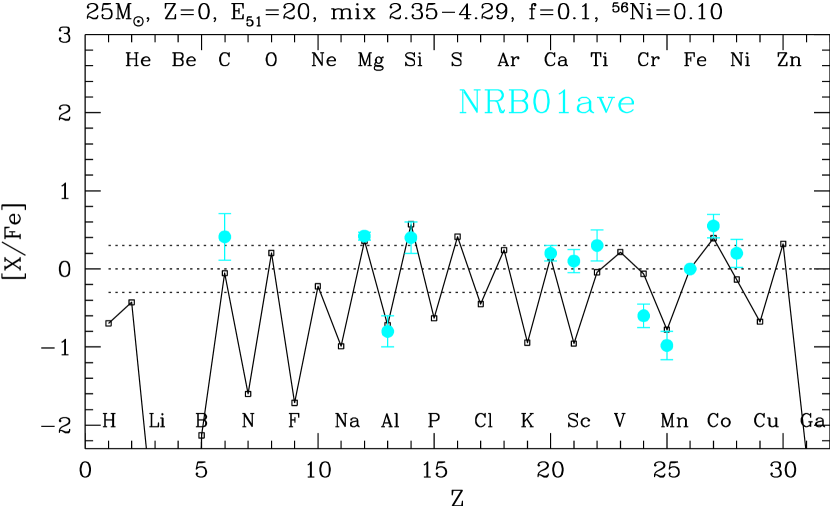
The right panel of Figure 13 shows the composition in the ejecta of a 25 hypernova model (). The nucleosynthesis in a normal 25 SN model () is also shown for comparison in the left panel of Figure 13.
We note the following characteristics of nucleosynthesis with very large explosion energies (Nakamura et al. 2001b; Nomoto et al. 2001ab; Ohkubo, Umeda, & Nomoto 2003):
(1) Both complete and incomplete Si-burning regions shift outward in mass compared with normal supernovae, so that the mass ratio between the complete and incomplete Si-burning regions becomes larger. As a result, higher energy explosions tend to produce larger [(Zn, Co, V)/Fe] and smaller [(Mn, Cr)/Fe] ([X/Y] ), which can explain the trend observed in very metal-poor stars (Ohkubo et al. 2003).
(2) In the complete Si-burning region of hypernovae, elements produced by -rich freezeout are enhanced. Hence, elements synthesized through capturing of -particles, such as 44Ti, 48Cr, and 64Ge (decaying into 44Ca, 48Ti, and 64Zn, respectively) are more abundant.
(3) Oxygen burning takes place in more extended regions for the larger KE. Then more O, C, Al are burned to produce a larger amount of burning products such as Si, S, and Ar. Therefore, hypernova nucleosynthesis is characterized by large abundance ratios of [Si,S/O], which can explain the abundance feature of M82 (Umeda et al. 2002).
Hypernovae and Zn, Co, Mn, Cr
Hypernova nucleosynthesis may have made an important contribution to Galactic chemical evolution. In the early galactic epoch when the galaxy was not yet chemically well-mixed, [Fe/H] may well be determined by mostly a single SN event (Audouze & Silk 1995). The formation of metal-poor stars is supposed to be driven by a supernova shock, so that [Fe/H] is determined by the ejected Fe mass and the amount of circumstellar hydrogen swept-up by the shock wave (Ryan, Norris, & Beers 1996). Then, hypernovae with larger are likely to induce the formation of stars with smaller [Fe/H], because the mass of interstellar hydrogen swept up by a hypernova is roughly proportional to (Ryan et al. 1996; Shigeyama & Tsujimoto 1998) and the ratio of the ejected iron mass to is smaller for hypernovae than for normal supernovae.
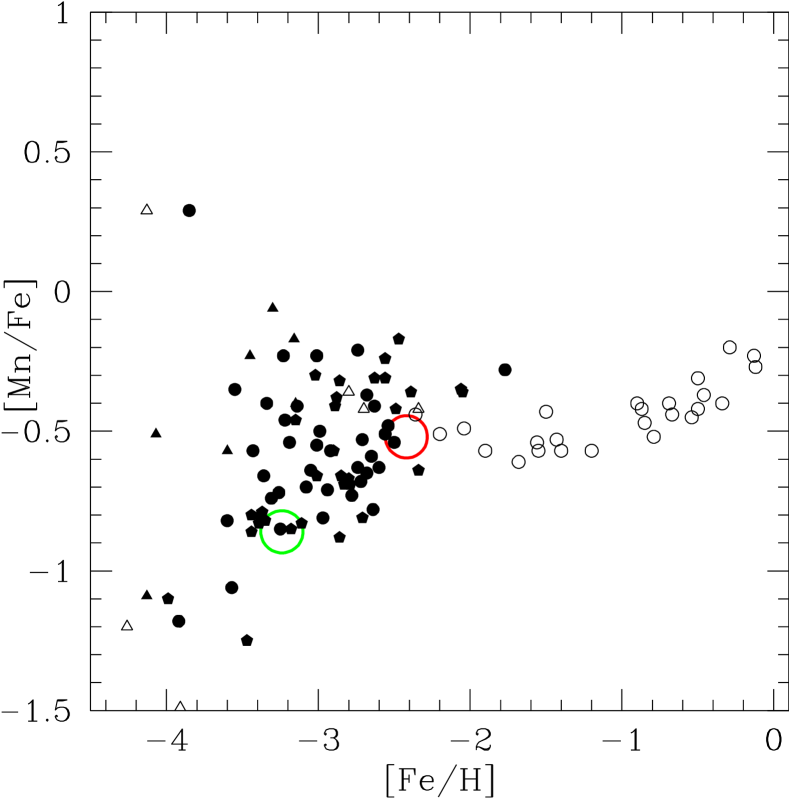
In the observed abundances of halo stars, there are significant differences between the abundance patterns in the iron-peak elements below and above [Fe/H] - .
(1) For [Fe/H], the mean values of [Cr/Fe] and [Mn/Fe] decrease toward smaller metallicity, while [Co/Fe] increases (Fig. 14: McWilliam et al. 1995; Ryan et al. 1996).
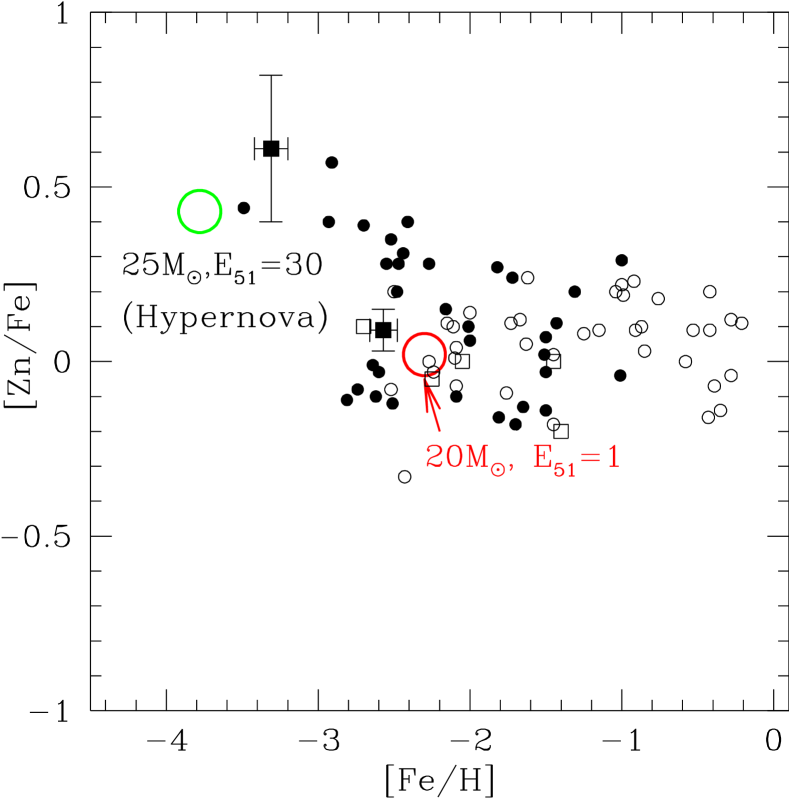
(2) [Zn/Fe] for [Fe/H] to (Sneden, Gratton, & Crocker 1991), while at [Fe/H] , [Zn/Fe] increases toward smaller metallicity (Fig. 14: Primas et al. 2000; Blake et al. 2001).
The larger [(Zn, Co)/Fe] and smaller [(Mn, Cr)/Fe] in the supernova ejecta can be realized if the mass ratio between the complete Si burning region and the incomplete Si burning region is larger, or equivalently if deep material from the complete Si-burning region is ejected by mixing or aspherical effects. This can be realized if (1) the mass cut between the ejecta and the compact remnant is located at smaller (Nakamura et al. 1999), (2) is larger to move the outer edge of the complete Si burning region to larger (Nakamura et al. 2001b), or (3) mixing and/or asphericity in the explosion is larger (Umeda & Nomoto 2002, 2003; Maeda & Nomoto 2003).
Among these possibilities, a large explosion energy enhances -rich freezeout, which results in an increase of the local mass fractions of Zn and Co, while Cr and Mn are not enhanced (Umeda & Nomoto 2002; Ohkubo et al. 2003). Models with do not produce sufficiently large [Zn/Fe]. To be compatible with the observations of [Zn/Fe] , the explosion energy must be much larger, i.e., for , i.e., hypernova-like explosions of massive stars () with are responsible for the production of Zn.
In the hypernova models, the overproduction of Ni, as found in the simple “deep” mass-cut model, can be avoided (Ohkubo et al. 2003). Therefore, if hypernovae made significant contributions to the early Galactic chemical evolution, it could explain the large Zn and Co abundances and the small Mn and Cr abundances observed in very metal-poor stars (Umeda & Nomoto 2002; Ohkubo et al. 2003).
Mixing and Fall-back
As noted above, large [Zn, Co/Fe] and small [Mn, Cr/Fe] can be obtained simultaneously if is sufficiently small and is sufficiently large. However, the ejected 56Ni mass is larger for smaller , and Ni) required to get [Zn/Fe] appears to be too large to be compatible with observations [O/Fe] in extremely metal-poor stars.
Here we consider a possible process that realizes effectively smaller mass-cuts without changing the 56Ni mass. In SNe II, when the rapidly expanding core hits the H and He envelopes, a reverse shock forms and decelerates core expansion. The deceleration induces Rayleigh-Taylor instabilities at the composition interfaces of H/He, He/C+O, and O/Si as has been found in SN 1987A (e.g., Ebisuzaki, Shigeyama, & Nomoto 1989; Arnett et al. 1989). Therefore, mixing can take place between the complete and incomplete Si burning regions according to the recent two dimensional numerical simulations (Kifonidis et al. 2000). The reverse shock can further induce matter fall-back onto the compact remnant (e.g., Chevalier 1989).
Based on these earlier findings, we propose that the following “mixing fall-back” process takes place in most SNe II.
(1) Burned material is uniformly mixed between the “initial” mass-cut () and the top of the incomplete Si-burning region at . Then [Zn/Fe] in the mixed region becomes as large as 0.5.
(2) Afterwards the mixed materials below () fall-back onto the compact remnant, and becomes the final mass-cut. Then Ni) becomes smaller while the mass ratios (Zn, Co, Mn)/Fe remain the same compared with the values determined by .
We note that the occurrence of the mixing has been demonstrated by the multi-D simulations of SN1987A and SNe Ib (e.g., Arnett et al. 1989; Hachisu et al. 1990, 1991; Kifonidis et al. 2000), but the fall-back simulations has been done only in 1D (Woosley & Weaver 1995). Therefore, we need multi-D simulations of fall-back to confirm the occurrence of the “mixing and fall-back” process and the resulting modification of the ejecta composition, which has not been done. Only when the mixing takes place across the “final mass-cut”, the SN yields are modified by the mixing, which has not been taken into account in previous SN yields.
Aspherical Explosions
| Model | (56Ni) | [S/Si] | [C/O] | ||||||
| 40A | 40 | 1.5 | 0.01 | 15 | 10.9 | 5.9 | 1.07E-1 | -0.46 | -1.3 |
| 40B | 40 | 1.5 | 0.01 | 45 | 1.2 | 6.8 | 8.11E-2 | -0.54 | -1.2 |
| 40C | 40 | 1.5 | 0.05 | 15 | 32.4 | 2.9 | 2.40E-1 | -0.30 | -1.3 |
| 40D | 40 | 3.0 | 0.01 | 15 | 8.5 | 10.5 | 6.28E-8 | -1.1 | -1.0 |
| 25A | 25 | 1.0 | 0.01 | 15 | 6.7 | 1.9 | 7.81E-2 | -0.28 | -0.80 |
| 25B | 25 | 1.0 | 0.01 | 45 | 0.6 | 1.5 | 1.51E-1 | -0.26 | -0.82 |
The “mixing and fall-back” effect may also be effectively realized in non-spherical explosions accompanying energetic jets (e.g., Maeda & Nomoto 2003; Maeda et al. 2002; Khokhlov et al. 1999; Nagataki et al. 1997). Compared with the spherical model with the same and , the shock is stronger (weaker) and thus temperatures are higher (lower) in the jet (equatorial) direction. As a result, a larger amount of complete Si-burning products are ejected in the jet direction, while only incomplete Si-burning products are ejected in the equatorial direction. In total, complete Si-burning elements can be enhanced (Maeda & Nomoto 2003; Nomoto et al. 2001ab).
Recently, Maeda & Nomoto (2003) have reported hydrodynamics and nucleosynthesis of jet-induced explosion models. We show some of the results below (See Maeda & Nomoto 2003 for detailes). .
The main ingredient of the above models is a pair of jets propagating through a stellar mantle. At the beginning of each calculation, the central part () of a progenitor star is displaced by a compact remnant. The jets are injected at the interface with the opening half-angle . The energy injected by the jets is assumed to be proportional to the accretion rate (i.e., ). The accretion at the inner boundary is traced and is used to update the central remnant’ mass and the property of the jets. The models are summarized in Table 3. The outcome of the explosion depends on the interaction between the jets and the stellar mantle, and on the accretion rate which is affected by the interaction itself. The hydrodynamic evolution and nucleosynthesis in two dimensions are found to be as follows.
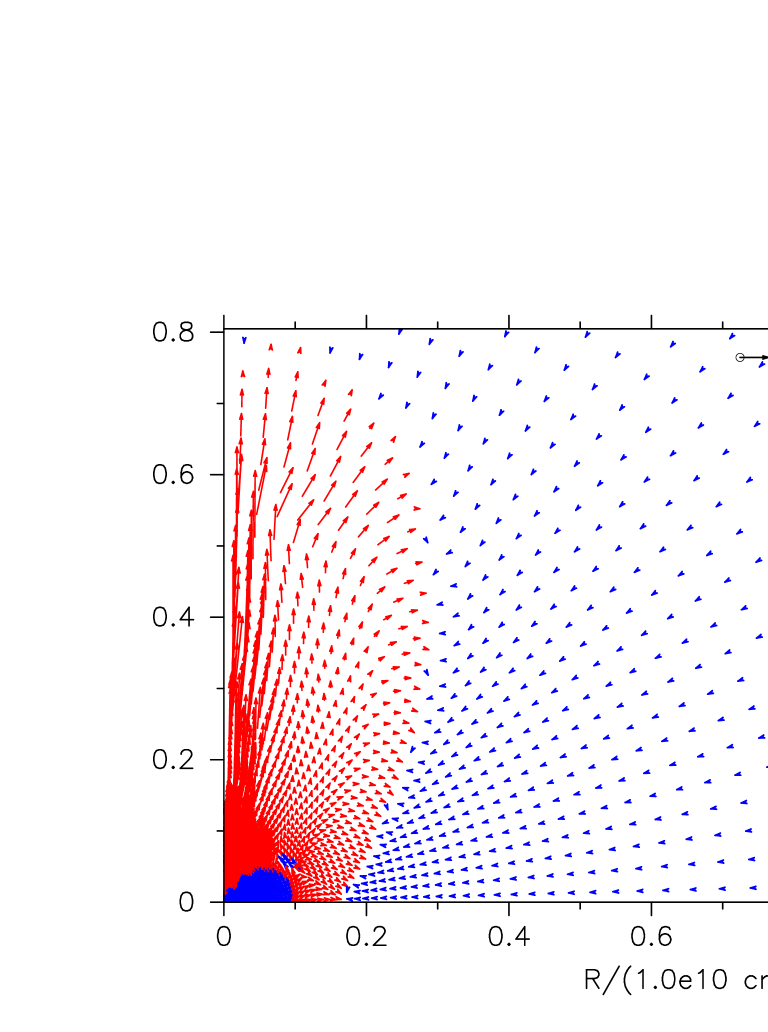
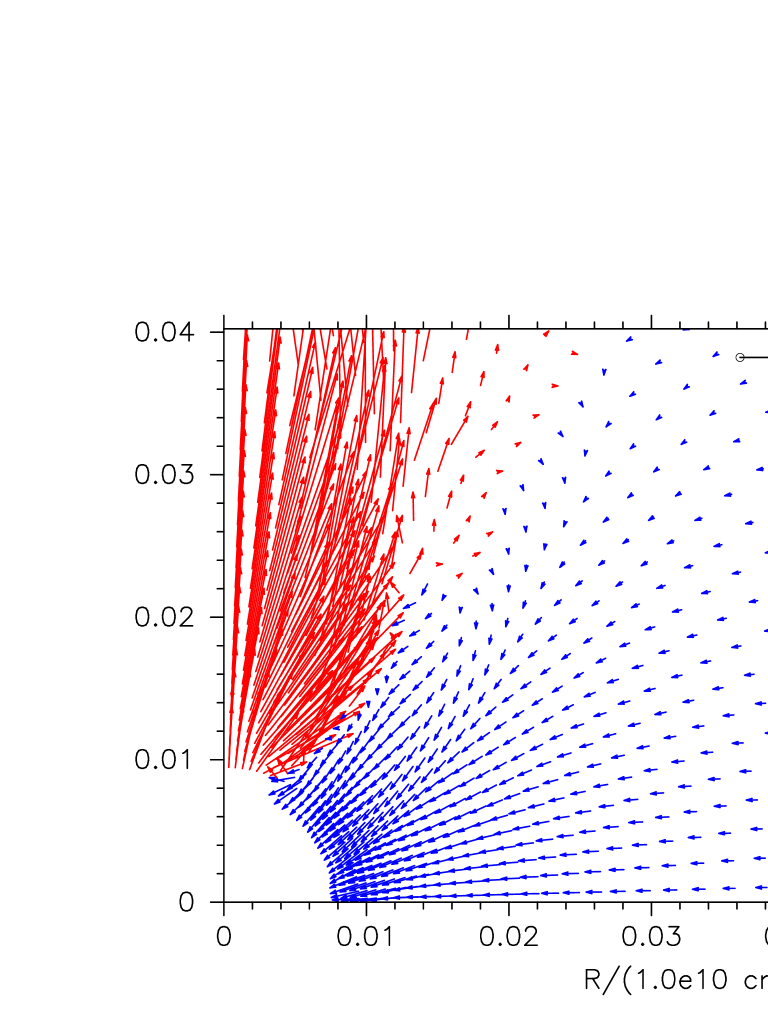
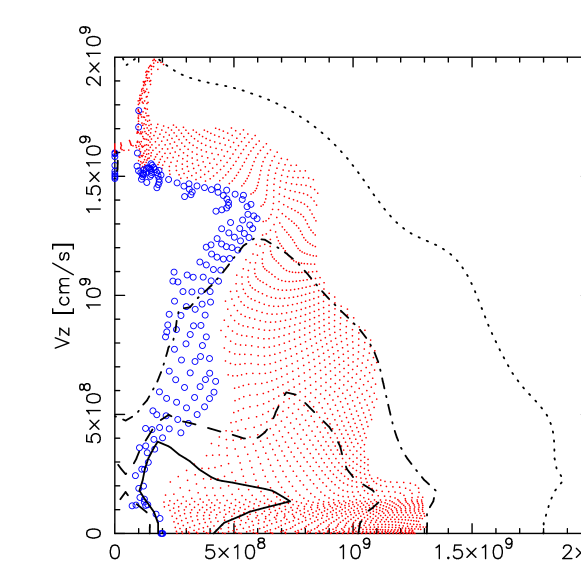
Figure 15 shows a snapshot of the velocity distribution of Model 40A at 1.5 seconds after the initiation of the jets. The jets propagate through the stellar mantle, depositing their energies into ambient matter at the working surface. The bow shock expands laterally to push the stellar mantle sideways, which reduces the accretion rate. The strong outflow occurs along the -axis (the jet direction), while matter accretes from the side. As the accretion rate decreases, the jets are turned off. Then the inflow along the -axis turns to the weak outflow.
The outcome is a highly aspherical explosion. The accretion forms a central dense core. Densities near the center become much higher than those in spherical models. This feature is consistent with the suggestions by the spectroscopic (Mazzali et al. 2000) and the light curve (Nakamura et al. 2001a; Maeda et al. 2003) modeling of hypernovae.
Other hydrodynamic properties are as follows (Tab. 3):
(1) A more massive star makes a more energetic explosion. The reason is that a more massive star has a stronger gravity to make the accretion rate higher. This is consistent with the relation seen in the hypernova branch (Fig. 12).
(2) A more massive star forms a more massive compact remnant. The remnant’s mass increases as the accretion feeds it. The final mass reaches typically for a star, and for a star. The bipolar models provide the way of explosions with black hole formation in a consistent manner. Given the discovery of the evidence of a hypernova explosion that accompanied formation of a black hole of (X-ray Nova Sco; Israelian et al. 1999; Podsiadlowski et al. 2002), it offers an interesting possibility.
Relatively high temperatures along the -axis and low temperatures along the -axis have significant effects on nucleosynthesis. It results in angle-dependent distribution of nucleosynthetic products as shown in Figure 16. The distribution of 56Ni (which decays into 56Fe) is elongated along the -axis, while that of 16O is concentrated in the central region. Though this feature has been already shown in Maeda et al. (2002) (see Fig. 7), Maeda & Nomoto (2003) have found that the central concentration of 16O and the enhancement of the density there are much more significant than the previous model of Maeda et al. (2002), because of the continuous accretion from the side. Such a configuration, i.e., high velocity Fe and low velocity O, has been suggested to be responsible for the feature in the late phase spectra of SN1998bw, where the OI] 6300 was narrower than the FeII] 5200 blend (Mazzali et al. 2001; Maeda et al. 2002)
Along the -axis, heavy isotopes which are produced with high temperatures K are blown up to the surface. As a result, 64Ge, 59Cu, 56Ni, 48Cr, and 44Ti (which decay into 64Zn, 59Co, 56Fe, 48Ti, and 44Ca, respectively) are ejected at the highest velocities. Isotopes which are synthesized with somewhat lower temperatures () are first pushed aside as the jets propagate, then experience circulation to flow into behind the working surface. 55Co, 52Fe (which decay into 55Mn and 52Cr, respectively), 40Ca, 32S, and 28Si are therefore ejected at the intermediate velocities. Isotopes which are not synthesized but are only consumed during the explosion are accreted from the side. 24Mg, 16O, and 12C occupy the innermost region at the lowest velocities.
The distribution of isotopes as a function of the velocity shows inversion as compared with conventional spherical models. This affects the overall abundance patterns in the whole ejecta as shown in Figure 17. As noted above, materials which experience higher are preferentially ejected along the -axis, while materials with lower accrete from the side in the bipolar models. Zn and Co are ejected at higher velocities than Mn and Cr, so that the latter accrete onto the central remnant more easily. As a consequence, [Zn/Fe] and [Co/Fe] are enhanced, while [Mn/Fe] and [Cr/Fe] are suppressed.
Interestingly, the abundance pattaerns of [(Zn, Co, Mn, Cr)/Fe] are the same as seen in extremely metal-poor stars. The bipoar models have the effect of “mixing and fallback” which has been suggested by Umeda & Nomoto (2002, 2003).
10 Extremely Metal-Poor (EMP) Stars and Faint Supernovae
Recently the most Fe deficient and C-rich low mass star, HE0107-5240, was discovered (Christlieb et al. 2002). This star has [Fe/H] but its mass is as low as 0.8 . This would challenge the recent theoretical arguments that the formation of low mass stars, which should survive until today, is suppressed below [Fe/H] (Schneider et al. 2002).
The important clue to this problem is the observed abundance pattern of this star. This star is characterized by a very large ratios of [C/Fe] = 4.0 and [N/Fe] = 2.3, while the abundances of elements heavier than Mg are as low as Fe (Christlieb et al. 2002). Interestingly, this is not the only extremely metal poor (EMP) stars that have the large C/Fe and N/Fe ratios, but several other such stars have been discovered (Ryan 2002). Therefore the reasonable explanation of the abundance pattern should explain other EMP stars as well. We show that the abundance pattern of C-rich EMP stars can be reasonably explained by the nucleosynthesis of 20 - 130 supernovae with various explosion energies and the degree of mixing and fallback of the ejecta.
The Most Metal-Poor Star HE0107-5240
We consider a model that C-rich EMP stars are produced in the ejecta of (almost) metal-free supernova mixed with extremely metal-poor interstellar matter. We use Pop III pre-supernova progenitor models, simulate the supernova explosion and calculate detailed nucleosynthesis (Umeda & Nomoto 2003).
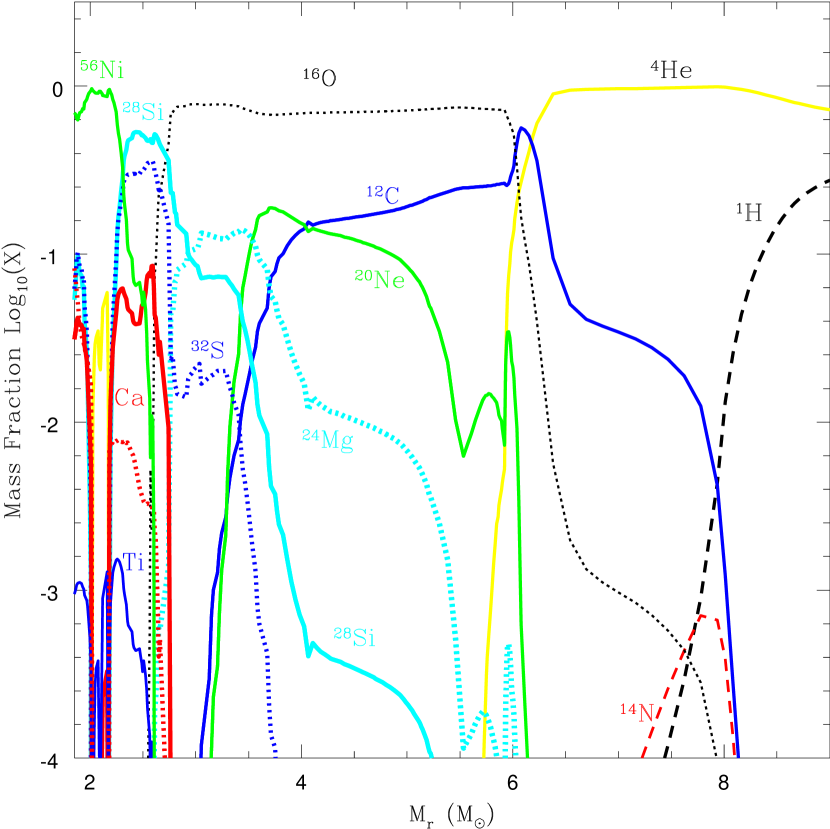
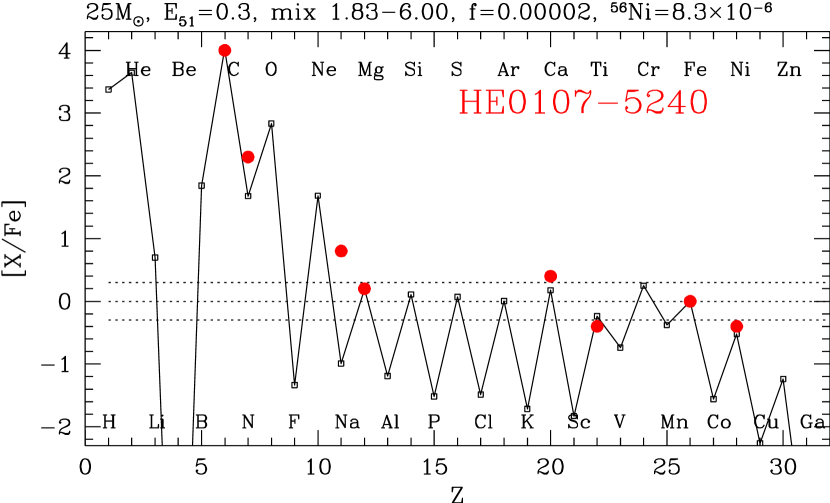
In Figure 18 (right) we show that the elemental abundances of one of our models are in good agreement with HE0107-5240, where the progenitor mass is 25 and the explosion energy 0.3 (Umeda & Nomoto 2003).
In this model, explosive nucleosynthesis takes place behind the shock wave that is generated at 1.8 and propagates outward. The resultant abundance distribution is seen in Figure 18 (left), where denotes the Lagrangian mass coordinate measured from the center of the pre-supernova model (Umeda & Nomoto 2003). The processed material is assumed to mix uniformly in the region from 1.8 and 6.0 . Such a large scale mixing was found to take place in SN1987A and various explosion models (e.g., Hachisu et al. 1990; Kifonidis et al. 2000). Almost all materials below 6.0 fall back to the central remnant and only a small fraction ( 10-5) is ejected from this region. The ejected Fe mass is 8 10-6 .
The CNO elements in the ejecta were produced by pre-collapse He shell burning in the He-layer, which contains 0.2 12C. Mixing of H into the He shell-burning region produces 4 10-4 14N. On the other hand, only a small amount of heavier elements (Mg, Ca, and Fe-peak elements) are ejected and their abundance ratios are the average in the region of 1.8 - 6.0 . The sub-solar ratios of [Ti/Fe] and [Ni/Fe] are the results of the relatively small explosion energy ( 0.3). With this ”mixing and fallback”, the large C/Fe and C/Mg ratios observed in HE0107-5240 are well reproduced (Umeda & Nomoto 2003).
In this model, N/Fe appears to be underproduced. However, N can be produced inside the EMP stars through the C-N cycle, and brought up to the surface during the first dredge up stage while becoming a red-giant star (Boothroyd & Sackmann 1999).
Carbon-rich EMP stars: CS 22949-037 and CS 29498-043
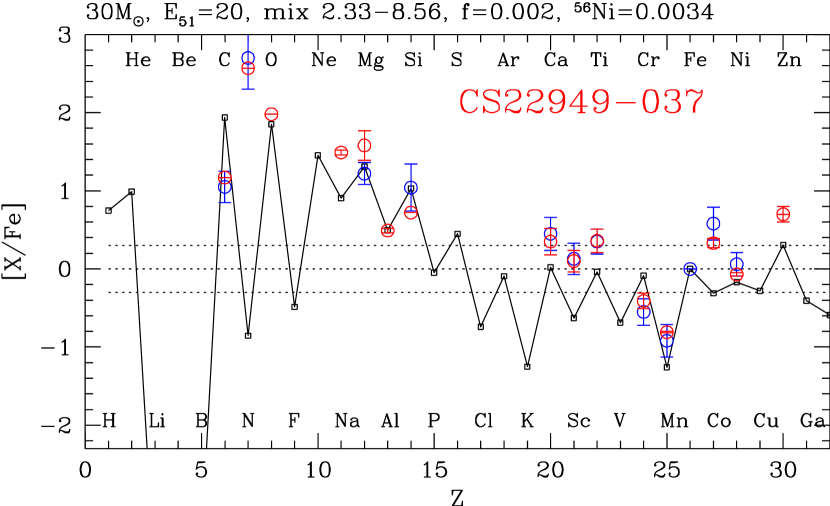
The ”mixing and fallback” is commonly required to reproduce the abundance pattern of typical EMP stars. In Figure 19 (left) we show a model, which is in good agreement with CS22949-037 (Umeda & Nomoto 2003). This star has [Fe/H] and also C, N-rich (Norris et al. 2001; Depagne et al. 2002), though C/Fe and N/Fe ratios are smaller than HE0107-5240. The model is the explosion of a 30 star with 20. In this model, the mixing region ( 2.33 - 8.56 ) is chosen to be smaller than the entire He core ( 13.1 ) in order to reproduce relatively large Mg/Fe and Si/Fe ratios. Similar degree of the mixing would also reproduce the abundances of CS29498-043 (Aoki et al. 2002), which shows similar abundance pattern.
We assume a larger fraction of ejection, 2%, from the mixed region for CS22949-037 than HE0107-5240, because the C/Fe and N/Fe ratios are smaller. The ejected Fe mass is 0.003 . The larger explosion energy model is favored for explaining the large Zn/Fe, Co/Fe and Ti/Fe ratios (Umeda & Nomoto 2002).
Without mixing, elements produced in the deep explosive burning regions, such as Zn, Co, and Ti, would be underproduced. Without fallback the abundance ratios of heavy elements to lighter elements, such as Fe/C, Fe/O, and Mg/C would be too large. In this model, Ti, Co, Zn and Sc are still under-produced. However, these elements may be enhanced efficiently in the aspherical explosions (Maeda et al. 2002; Maeda & Nomoto 2003). Almost the same effects as the ”mixing and fallback mechanism” are realized if the explosion is jet-like, although the total energy can be smaller if the beaming angle of the jet is small (Maeda & Nomoto 2003).
According to Maeda & Nomoto (2003), some bipolar models explain the existence of Fe-poor explosions with very little amount of Fe, which leave a massive central remnant with . Such explosions would be responsible for the formation of the carbon-rich metal-poor stars, e.g., CS22949-037 (Norris et al. 2001; Aoki et al. 2002; Depagne et al. 2002), as the bipoplar explosions with smaller (56Ni) lead to larger [C/O] (See also Umeda & Nomoto 2003).
EMP Stars with a Typical Abundance Pattern
Similarly, the ”mixing and fall back” process can reproduce the abundance pattern of the typical EMP stars without enhancement of C and N. Figure 19 (right) shows that the averaged abundances of [Fe/H] stars in Norris et al. (2001) can be fitted well with the model of 25 and 20 but larger fraction ( 10%) of the processed materials in the ejecta.
SNe with Small Fe Ejection
In our model, [Fe/H] of several kinds of EMP stars can be understood in the supernova-induced star formation scheme (Audouze & Silk 1995; Shigeyama & Tsujimoto 1998; Nakamura et al. 1999). In this scheme, [Fe/H] of the second-generation stars are determined by the ejected Fe mass divided by the mass of hydrogen swept up by the supernova ejecta. As the swept-up hydrogen mass is roughly proportional to the explosion energy, Fe/H (M(Fe)/0.07) / E51, where M(Fe) is the ejected Fe mass. The average stars of [Fe/H] (Norris et al. 2001), CS22949-037, and HE0107-5240 correspond to (M(Fe)/0.07) / E51 = 0.07, 0.002, and 0.0004, respectively. This correspondence suggests that [Fe/H] of the EMP stars do not reflect the age of the stars, but rather the properties of the supernovae, such as the degree of mixing and fallback or collimation of a jet.
We have also shown that the most iron-poor star, as well as other C-rich EMP stars, is likely to be enriched by massive supernovae that are characterized by relatively small Fe ejection. Such supernovae are not hypothetical, but have been actually observed, forming a distinct class of type II supernovae (‘faint supernovae’) (Nomoto et al. 2002). The prototype is SN1997D, which is very underluminous and shows quite narrow spectral lines (Turatto et al. 2000): these features are well modeled as an explosion of a 25 star ejecting only 56Ni with small explosion energy E (Turatto et al. 2000). SN1999br is a very similar faint supernova (Zampieri et al. 2003). On the other hand, typical EMP stars without enhancement of C and N correspond to the abundance pattern of energetic supernovae (‘hypernovae’). For both cases, black holes more massive than must be left as results of fallback, suggesting copious formation of the first black holes from the first stars. These black holes may make up some of the dark mass in the Galactic halo.
In our model, HE0107-5240 with [Fe/H]= was formed from C- and O-enhanced gases with [(C,O)/H] . With such enhanced C and O, the cooling efficiency is large enough to form small-mass stars. In other word, our model predicts that low-mass EMP stars with [Fe/H] are likely to have enhanced [(C, N, O)/Fe] and [Mg/Fe] in some cases. A consequence of the low-mass EMP stars being carbon-rich is that the population III stars that provided their metals are massive enough to form (the first) black holes.
11 The First Stars
It is of vital importance in current astronomy to identify the first generation stars in the Universe, i.e., totally metal-free, Pop III stars. The impact of the formation of Pop III stars on the evolution of the Universe depends on their typical masses. Recent numerical models have shown that, the first stars are as massive as 100 (Abel, Bryan, & Norman 2002). The formation of long-lived low mass Pop III stars may be inefficient because of slow cooling of metal free gas cloud, which is consistent with the failure of attempts to find Pop III stars.
If the most Fe deficient star, HE0107-5240, is a Pop III low mass star that has gained its metal from a companion star or interstellar matter (Yoshii 1981), would it mean that the above theoretical arguments are incorrect and that such low mass Pop III stars have not been discovered only because of the difficulty in the observations?
Based on the results in the earlier section, we propose that the first generation supernovae were the explosion of 20-130 stars and some of them produced C-rich, Fe-poor ejecta. Then the low mass star with even [Fe/H] can form from the gases of mixture of such a supernova ejecta and the (almost) metal-free interstellar matter, because the gases can be efficiently cooled by enhanced C and O ([C/H] ).
| mass () | 80 | 100 | 120 | 150 | 180 | 300 |
|---|---|---|---|---|---|---|
| Pop III | (9.03) | (4.83) | (2.15) | |||
| Pop I | (7.02) | (2.35) | (1.43) | (1.21) | (1.71) |
Pair-Instability Supernovae
We have shown that the ejecta of core-collapse supernova explosions of massive stars can well account for the abundances of EMP stars. We can put further constraint on the typical mass of Pop III. The abundances of all observed EMP stars including the most metal-poor one are inconsistent with the abundance pattern of pair-instability supernovae (PISNe). For typical EMP stars and CS22948-037, enrichment by PISNe cannot be consistent with the observed abundant Zn/Fe and Co/Fe ratios (Umeda & Nomoto 2002; Heger & Woosley 2002). For HE0107-5240 and other C-rich EMP stars, PISNe enrichment is difficult to account for the large C/Mg ratios. Therefore the supernova progenitors that are responsible for the formation of EMP stars are in the range of , but not more massive than 130 . This upper limit depends on the stability of massive stars as will be discussed below.
Stability and Mass Loss of Massive Pop III Stars
To determine the upper limit mass of the Zero Age Main Sequence (ZAMS), we analyze a linear non-adiabatic stability of massive ( - ) Pop III stars using a radial pulsation code (Nomoto et al. 2003). Because CNO elements are absent during the early stage of their evolution, the CNO cycle does not operate and the star contracts until temperature rises sufficiently high for the reaction to produce 12C. We calculate that these stars have , and the central temperature on their ZAMS. We also examine the models of Pop I stars for comparison.
Table 4 shows the results for our analysis. The critical mass of ZAMS Pop III star is while that of Pop I star is . This difference comes from very compact structures (with high ) of Pop III stars.
Stars more massive than the critical mass will undergo pulsation and mass loss. We note that the -folding time of instability is much longer for Pop III stars than Pop I stars with the same mass, and thus the mass loss rate is much lower. These results are consistent with Ibrahim, Boury, & Noels (1981) and Baraffe, Heger, & Woosley (2001). However, the absence of the indication of PISNe may imply that these massive stars above 130 undergo significant mass loss, thus evolving into Fe core-collapse rather than PISNe.
12 Concluding Remarks
In this paper, we first describe how the basic parameters of hypernova SN 1998bw are derived from observations and modeling, and discuss the properties of other hypernovae individually. These hypernovae seem to come from rather massive stars, being more massive than 20 - 25 on the main-sequence, thus forming black holes. On the other hand, there are some examples of massive SNe with only a small kinetic energy. We suggest that stars with non-rotating black holes are likely to collapse ”quietly” ejecting a small amount of heavy elements (Faint supernovae). In contrast, stars with rotating black holes are likely to give rise to very energetic supernovae (Hypernovae).
We present distinct nucleosynthesis features of these two types of ”black-hole-forming” supernovae. Nucleosynthesis in Hypernovae are characterized by larger abundance ratios (Zn,Co,V,Ti)/Fe and smaller (Mn,Cr)/Fe. Nucleosynthesis in Faint supernovae is characterized by a large amount of fall-back, yielding large [/Fe]. We show that the abundance pattern of the recently discovered most Fe deficient star, HE0107-5240, and other extremely metal-poor carbon-rich stars are in good accord with those of black-hole-forming supernovae, but not pair-instability supernovae. This suggests that black-hole-forming supernovae made important contributions to the early Galactic (and cosmic) chemical evolution. Finally we discuss the nature of First (Pop III) Stars.
Acknowledgements.
This work has been supported in part by the grant-in-Aid for Scientific Research (14047206, 14540223) of the Ministry of Education, Science, Culture, and Sports in Japan.1
References
- [1] Abel, T., Bryan, G.L., & Norman, M.L. 2002, Science, 295, 93
- [2] Aoki, W., Ryan, S.G., Beers, T.C., & Ando, H. 2002, ApJ, 567, 1166
- [] Aloy, M.A., Müller, E., Ibáñez, J.M., Martí, J.M., MacFadyen, A. 2000, ApJ, 531, L119
- [3] Arnett, D. 1982, ApJ, 253, 785
- [4] Arnett, D. Bahcall, J.N., Kirshner, R.P., Woosley, S.E. 1989, ARA&A, 27, 629
- [5] Arnett, D. 2001, in Supernovae and Gamma-Ray Bursts (Proceedings of the Space Telescope Science Institute Symposium, Baltimore, USA), eds. M. Livio, N. Panagia, K. Sahu (Cambridge), 250
- [6] Audouze, J., & Silk, J. 1995, ApJ, 451, L49
- [7] Axelrod, T.S. 1980, Ph.D. thesis, University of California
- [8] Baraffe, I., Heger, A., & Woosley, S.E. 2001, ApJ, 550, 890
- [9] Baron, E., Young, T.R., Branch, D. 1993, ApJ, 409, 417
- [10] Berger, E., Kulkarni, S.R., Chevalier, R.A. 2002, ApJ, 577, L5
- [11] Blake, L.A.J., Ryan, S.G., Norris, J.E., Beers, T.C. 2001, Nucl. Phys. A. 688, 502
- [12] Blandford, R.D., & Znajek, R.L. 1977, MNRAS, 179, 433
- [13] Bloom, J.S., et al. 1999, Nature, 401, 453
- [14] Bloom, J.S., et al. 2002, ApJ, 572, L45
- [15] Boothloyd, A.I., & Sackmann, I.-J. 1999, ApJ, 510, 217
- [16] Branch, D. 2001, in Supernovae and Gamma-Ray Bursts (Proceedings of the Space Telescope Science Institute Symposium, Baltimore, USA), eds. M. Livio, N. Panagia, K. Sahu (Cambridge), 96
- [17] Chevalier, R.A. 1989, ApJ, 346, 847
- [18] Christlieb, N., et al. 2002, Nature, 419, 904
- [19] Clocchiatti, A., & Wheeler, J.C. 1997, ApJ, 491, 375
- [20] Colgate, S.A., & Petschek, A.G. 1979, ApJ, 229, 682
- [21] Colgate, S.A., Petschek, A.G., Kriese, J.T. 1980, ApJ, 237, L81
- [22] Deng, J., Hatano, K., Nakamura, T., Maeda, K., Nomoto, K., Nugent, P., Aldering, G., & Branch, D. 2001, in New Century of X-ray Astronomy, ASP Conference Series, 251, eds. H. Inoue, & H. Kunieda (ASP; San Francisco), 238
- [23] Depagne, E., et al. 2002, A&A, 390, 187
- [24] Ebisuzaki, T., Shigeyama, T., & Nomoto, K. 1989, ApJ, 344. 65
- [25] Ergma, E., & van den Heuvel, E.P.J. 1998, A&A, 331, L29
- [26] Filippenko, A.V., & Chornock, R. 2002, IAU Circ., 7825
- [27] Fransson, C., & Kozma, C 1993, ApJ, 408, L25
- [28] Fryer, C.L., & Warren, M.S. 2002, ApJ, 574, L65
- [29] Fynbo, J.U. 2000, ApJ, 542, L89
- [30] Galama, T.J., et al. 1998, Nature, 395, 670
- [31] Galama, T.J., et al. 2000, ApJ, 536, 185
- [32] Gal-Yam, A., Ofek, E.O., & Shemmer, O. 2002, MNRAS, 332, L73
- [33] Garnavich, P., et al. 1997, IAU Circ., 6798
- [34] Garnavich, P., et al. 2002, ApJ, 582, 924
- [35] Germany, L.M., Reiss, D.J., Schmidt, B.P., Stubbs, C.W., Sadler, E.M. 2000, ApJ, 533, 320
- [36] Hachisu, I., Matsuda, T., Nomoto, K., Shigeyama, T. 1990, ApJ, 358, L57
- [37] Hachisu, I., Matsuda, T., Nomoto, K., Shigeyama, T. 1991, ApJ, 368, L27
- [38] Hamuy, M. 2003, ApJ, 582, 905
- [39] Hashimoto, M., Nomoto, K., Shigeyama, T. 1989, A&A, 210, L5
- [40] Hatano, K., Branch, D., Nomoto, K., Deng, J.S., Maeda, K., Nugent, P., Aldering, G. 2001, BAAS, 198, 3902
- [41] Heger, A., & Woosley, S.E. 2002, ApJ, 567, 532
- [42] Hirose, Y. 2002, IAU Circ., 7810
- [43] Hjorth, J. et al. 2003, Nature, 423, 847
- [44] Ibrahim, A., Boury, A., & Noels, A. 1981, A&A, 103, 390
- [45] Israelian, G., et al. 1999, Nature, 401, 142
- [46] Iwamoto, K., Nomoto, K., Höflich, P., Yamaoka, H., Kumagai, S., Shigeyama, T. 1994, ApJ, 437, L115
- [47] Iwamoto, K. et al. 1998, Nature, 395, 672
- [48] Iwamoto, K. et al. 2000, ApJ, 534, 660
- [49] Janka, H.-T., Müller, E. 1994, A&A, 290, 496
- [50] Kawabata, K.S., Jeffery, D., Kosugi, G., Sasaki, T., et al. 2002, ApJ, 580, L39
- [51] Kawabata, K.S. et al. 2003, ApJ, 593, L19
- [52] Kay, L.E., Halpern, J.P., Leighly, K.M., Heathcote, S., Magalhaes, A.M., Filippenko, A.V. 1998, IAU Circ., 6969
- [53] Khokhlov, A.M., Höflich, P.A., Oran, E.S., Wheeler, J.C., Wang, L., Chtchelkanova, A.Yu. 1999, ApJ, 524, L107
- [54] Kifonidis, K., Plewa, T., Janka, H-Th., Müller, E. 2000, ApJ, 531, L123
- [55] Kinugasa, K., et al. 2002, ApJ, 577, L97
- [56] Kippen, R.M. et al. 1998, GCN Circ., 67
- [57] Knop, R., Aldering, G., Deustua, S., et al. 1999, IAU Circ., 7128
- [58] Leonardo, D.C., Filippenko, A.V., Chornock, R., Foley, R.J., 2002, PASP, 114, 1333
- [59] MacFadyen, A.I., & Woosley, S.E. 1999, ApJ, 524, 262
- [60] MacFadyen, A.I., Woosley, S.E., Heger, A. 2001, ApJ, 550, 410
- [61] Maeda, K., Nakamura, T., Nomoto, K., Mazzali, P.A., Patat, F., Hachisu, I. 2002, ApJ, 565, 405
- [62] Maeda, K., Mazzali, P.A., Deng, J., Nomoto, K., Yoshii, Y., Tomita, H., Kobayashi, Y. 2003, ApJ, in press (astro-ph/0305182)
- [63] Maeda, K., & Nomoto, K. 2003, ApJ, in press (astro-ph/0304172)
- [64] Matheson, T., Filippenko, A.V., Li, W., Leonard, D.C., Shields, J.C. 2001, AJ, 121, 1648
- [65] Mazzali, P.A., Iwamoto, K., Nomoto, K. 2000, ApJ, 545, 407
- [66] Mazzali, P.A., Nomoto, K., Patat, F., Maeda, K. 2001, ApJ, 559, 1047
- [67] Mazzali, P.A., et al. 2002, ApJ, 572, L61
- [68] McKenzie, E.H., & Schaefer, B.E. 1999, PASP, 111, 964
- [69] McWilliam, A., Preston, G.W., Sneden, C., Searle, L. 1995, AJ, 109, 2757
- [70] Meikle, P., Lucy, L., Smartt, S., et al. 2002, IAU Circ., 7811
- [71] Nagataki, S., Hashimoto, M., Sato, K., & Yamada, S. 1997, ApJ, 486, 1026
- [72] Nakamura, T. 1998, Prog. Theor. Phys, 100, 921
- [73] Nakamura, T., Umeda, H., Nomoto, K., Thielemann, F.-K., Burrows, A. 1999, ApJ, 517, 193
- [74] Nakamura, T., Mazzali, P.A., Nomoto, K., Iwamoto, K. 2001a, ApJ, 550, 991
- [75] Nakamura, T., Umeda, H., Iwamoto, K., Nomoto, K., Hashimoto, M., Hix, W.R., Thielemann, F.-K. 2001b, ApJ, 555, 880
- [76] Nakano, S., Kushida, R., Li, W. 2002, IAU Circ., 7810
- [77] Nomoto, K., & Hashimoto, M. 1988, Phys.Rep., 256, 173
- [78] Nomoto, K., Suzuki, T., Shigeyama, T., Kumagai, S., Yamaoka, H., Saio, H. 1993, Nature, 364, 507
- [79] Nomoto, K., et al. 1994, Nature, 371, 227
- [80] Nomoto, K., Iwamoto, K., Suzuki, T. 1995, Phys. Rep., 256, 173
- [81] Nomoto, K., et al. 2001a, in Supernovae and Gamma-Ray Bursts (Proceedings of the Space Telescope Science Institute Symposium, Baltimore, USA), eds. M.Livio, N.Panagia, K.Sahu (Cambridge), 144
- [82] Nomoto, K., Maeda, K., Umeda, H., Nakamura, T. 2001b, in The Influence of Binaries on Stellar Populations Studies, ed. D. Vanbeveren (Kluwer), 507 (astro-ph/0105127)
- [83] Nomoto, K., Maeda, K., Umeda, H., Ohkubo, T., Deng, J., Mazzali, P. 2003, in IAU Symp 212, A Massive Star Odyssey, from Main Sequence to Supernova, eds. van der Hucht, A. Herrero, & C. Esteban (ASP, San Francisco 2003), 395 (astro-ph/0209064)
- [84] Norris, J.E., Ryan, S.G., & Beers, T.C. 2001, ApJ, 561, 1034
- [85] Ohkubo, T., Umeda, H., & Nomoto, K., 2003, Nuc.Phys. A. 718, 632c
- [86] Patat, F. et al. 2001, ApJ, 555, 917
- [87] Pinto, P., & Eastman, R. 2000, ApJ, 530, 744
- [88] Podsiadlowski, Ph., Nomoto, K., Maeda, K., Nakamura, T., Mazzali, P.A., Schmidt, B. 2002, ApJ, 567, 491
- [89] Primas, F., Reimers, D., Wisotzki, L., Reetz, J., Gehren, T., Beers, T.C. 2000, in The First Stars, ed. A. Weiss, et al. (Springer), 51
- [90] Reichart, D.E. 1999, ApJ, 521, L111
- [91] Rigon, L., Turatto, M., Benetti, S., et al. 2003, MNRAS, 340, 191
- [92] Ryan, S.G., Norris, J.E., Beers, T.C. 1996, ApJ, 471, 254
- [93] Ryan, S.G. 2002, in CNO in the Universe, eds. C. Charbonnel, D. Schaerer, & G. Meynet, in press (astro-ph/0211608)
- [94] Schaller, G., Schaerer, D., Meynet, G., Maeder, A. 1992, A&AS, 96, 269
- [95] Schneider, R., Ferrara, A., Natarajan, P., & Omukai, K. 2002, ApJ, 571, 30
- [96] Sharina, M.E., Karachentsev, I.D., Tikhonov, N.A. 1996, A&AS, 119, 499
- [97] Shigeyama, T., & Nomoto, K. 1990, ApJ, 360, 242
- [98] Shigeyama, T., Suzuki, T., Kumagai, S., Nomoto, K., Saio, H., Yamaoka, H. 1994, ApJ, 420, 341
- [99] Shigeyama, T., & Tsujimoto, T. 1998, ApJ, 507, L135
- [100] Shimizu, T.M., Ebisuzaki, T., Sato, K., Yamada, S. 2001, ApJ, 552, 756
- [101] Smartt, S.J., Vreeswijk, P., Ramirez-Ruiz, E., et al. 2002, ApJ, 572, L147
- [102] Sneden, C., Gratton, R.G., Crocker, D.A. 1991, A&A, 246, 354
- [103] Sollerman, J., Kozma, C., Fransson, C., Leibundgut, B., Lundqvist, P., Ryde, F., Woudt, P. 2000, ApJ, 537, L127
- [104] Stanek, K.Z., et al. 2003, ApJ, 591, L17
- [105] Stathakis, R.A., et al. 2000, MNRAS, 314, 807
- [106] Suzuki, T., & Nomoto, K. 1995, ApJ, 455, 658
- [107] Swartz, D.A., & Wheeler, J.C. 1991, ApJ, 379, L13
- [108] Takada-Hidai, M., Aoki, W., Zhao, G. 2002, PASJ, 54, 899
- [109] Terlevich, R., Tenorio-Tagle, G., Franco, J., Melnick, J. 1992, MNRAS, 255, 713
- [110] Terlevich, R., Fabian, A., Turatto, M. 1999, IAU Circ., 7269
- [111] Thielemann, F.-K., Nomoto, K., Hashimoto, M. 1996, ApJ, 460, 408
- [112] Thorsett, S.E., & Hogg, D.W. 1999, GCN Cir., 197
- [113] Turatto, M., et al. 1998, ApJ, 498, L129
- [114] Turatto, M., Suzuki, T., et al. 2000, ApJ, 534, L57
- [115] Umeda, H., & Nomoto, K. 2002, ApJ, 565, 385
- [116] Umeda, H., Nomoto, K., Tsuru, T.G., Matsumoto, H. 2002, 578, 855
- [117] Umeda, H., & Nomoto, K. 2003, Nature, 422, 871
- [118] van den Heuvel, E.P.J. 1994, in Interacting Binaries, ed. H. Nussbaumer & A.Orr (Berlin:Springer Verlag), 263
- [119] Wang, L., & Wheeler, J.C. 1998, ApJ, 504, L87
- [120] Wang, L., Baade, D., Fransson, C., et al. 2003, ApJ, 592, 457
- [121] Wheeler, J.C. 2001, ApJ, 504, 87
- [122] Woosley, S.E., Eastman, R.G., Weaver, T.A., Pinto, P.A. 1994, ApJ, 429, 300
- [123] Woosley, S.E., Langer, N., Weaver, T.A. 1995, ApJ, 448, 315
- [124] Woosley, S.E., & Weaver, T.A. 1995, ApJS, 101, 181
- [125] Woosley, S.E., Eastman, R., Schmidt, B. 1999, ApJ, 516, 788
- [126] Yoshii, Y. 1981, A&A, 97, 280
- [127] Young, T., Baron, E., Branch, D. 1995, ApJ, 449, L51
- [128] Zampieri et al. 2003, MNRAS, 338, 711