Ram pressure stripping and the formation of cold fronts
Abstract
Chandra and XMM-Newton observations of many clusters reveal sharp discontinuities in the surface brightness, which, unlike shocks, have lower gas temperature on the X-ray brighter side of the discontinuity. For that reason these features are called “cold fronts”. It is believed that some cold fronts are formed when a subcluster merges with another cluster and the ram pressure of gas flowing outside the subcluster gives the contact discontinuity the characteristic curved shape. While some edges may not arise directly from mergers (e.g., A496, Dupke & White 2003), this paper focuses on those which arise as contact discontinuities between a merging subcluster and the ambient cluster gas. We argue that the flow of gas past the merging subcluster induces slow motions inside the cloud. These motions transport gas from the central parts of the subcluster towards the interface. Since in a typical cluster or group (even an isothermal one) the entropy of the gas in the central regions is significantly lower than in the outer regions, the transport of the low entropy gas towards the interface and the associated adiabatic expansion makes the gas temperature immediately inside the interface lower than in any other place in the system, thus enhancing the temperature jump across the interface and making the “tip” of the contact discontinuity cool. We illustrate this picture with the XMM-Newton gas temperature map of the A3667 cluster.
keywords:
methods: numerical, galaxies: general, galaxies: clusters: individual: A3667, X-rays: galaxies: clusters1 Introduction
Cold fronts were discovered as sharp features in the X-ray surface brightness distribution in Chandra observations of the clusters A2142 and A3667 (Markevitch et al. 2000; Vikhlinin et al. 2001a, see also Markevitch et al. 2002). Similar features have now been found in several other clusters (Sun et al., 2002; Kempner et al., 2002). A natural assumption that these sharp features were due to shocks propagating through the gas was immediately rejected since the measured gas temperature was lower on the X-ray brighter side of the feature. It was suggested instead that the observed edges were formed as a result of the flow of hotter gas around the colder gas cloud, the front itself being the contact discontinuity separating hot and cold gas (Markevitch et al., 2000; Vikhlinin et al., 2001a). The motion of the cloud with respect to the gas on larger scales can be understood, for example, as the result of a merger of a subcluster with a more massive and hotter cluster. And indeed, features resembling cold fronts were found in numerical simulations of cluster formation (Nagai & Kravtsov, 2003; Bialek et al., 2002).
In this short paper we argue that ablation of the gaseous cloud causes characteristic differential motion of the gas inside the subcluster, which transports the low entropy gas from the subcluster core towards the contact discontinuity, thus enhancing the jump in temperature and surface brightness across the discontinuity.
2 Illustrative model
2.1 Numerical Setup
In order to study the global dynamics and temperature structure of cold clouds, we ran a number of hydrodynamic simulations. Initial conditions were chosen to correspond roughly to those observed in A3667 (Vikhlinin et al., 2001a), however, we varied all relevant parameters within an order of magnitude to confirm that the conclusions we draw from the simulations are robust.
The simulations were performed using the FLASH hydro code (Fryxell et al., 2000). This code is an adaptive mesh refinement code using a high precision PPM solver, explicit in time and formally accurate to 2nd order. To verify our results, we also ran a batch of simulations using the ZEUS 3D code (Clarke et al., 1994; Stone & Norman, 1992a, b). We restricted most of the simulations to two dimensions, the bulk of the simulations assuming axi-symmetry. We ran several test cases in a cartesian semi-infinite slab geometry to confirm that the axi-symmetric assumption did not corrupt our results. Furthermore, we re-ran our fiducial simulation in 3D (at lower resolution) to confirm that the results are not an artifact of enforced symmetries.
We used an adiabatic equation of state. Both codes used incorporate shock capturing schemes. However, to keep the simulations scale free, we did not include the effects of radiative cooling. For our fiducial simulation presented in the following section, it turns out that cooling of the coolest gas is at most marginally important over the simulation time span: For our fiducial simulation (see below) the minimum cooling time anywhere during the simulation is , compared to a total simulation time of 4 Gyrs. While this is clearly a simplification, the effects of cooling will only increase the temperature contrast between the low and high entropy regions and thus enhance the effects discussed in this paper.
The initial setup consists of a stationary isothermal atmosphere111We note that the assumption of isothermality is idealistic - any realistic halo will presumably possess a stratified atmosphere with low entropy gas at the center. However, for the purpose of our study, isothermality is a conservative assumption, as it decreases the temperature contrast that can be achieved and more clearly reveals the nature of the dynamical effects we will be discussing. of cold, dense gas and a wind of uniform hot, light gas moving at uniform speed relative to the isothermal atmosphere. The isothermal atmosphere is assumed to be in hydrostatic equilibrium, following a beta model density profile of the form
| (1) |
where we chose , , and . For simplicity, we assume that the gravitational field binding the cold gas is provided predominantly by dark matter. Thus, we keep the gravitational potential fixed throughout the simulations. The uniform gas is assumed to have an electron density , with a relative velocity such that its internal Mach number is , while the Mach number with respect to the sound speed of the cold cloud is . We used a temperature normalisation of 7.7 keV for the undisturbed external medium (Vikhlinin et al., 2001a) and 3.2 keV for the undisturbed isothermal cloud, which sets the length and velocity scale of the simulation.
The computational volume was restricted to the range of and . Increasing the physical dimensions of the simulated volume by a factor of two did not affect the internal structure of the cloud significantly. The initial interface is located at the surface. Inflow boundary conditions were chosen for the boundary (forcing velocity, pressure, and density to , , and respectively), outflow boundary conditions for the and the boundaries, and reflective boundary conditions along the axis.
The effective (i.e., maximum) resolution within this box was varied between and without significant impact on the global dynamics. The bulk of the simulations were run at an effective resolution of (corresponding to a cell size of ), with a refinement depth of 8, while forcing the resolution in the central to be at least . For a typical size of (as observed in A3667) this implies that the cloud is safely resolved with more than 100 resolution elements across a cloud radius.
In order to evaluate the observed temperature distribution, we calculated emission weighted temperature maps, using the observed background temperature and background intensity around the cold front in A3667 (due to the limited box size and assumed uniform external density we cannot calculate the background emission from the host cluster self-consistently). We assumed pure bremsstrahlung emission, which is a good approximation above and sufficient for our purposes.
2.2 Simulation results
The simulations generally show the following temporal evolution: the interface between the moving and the stationary gas drives a strong shock into the stationary, dense gas, while a weak shock is driven into the hot gas (depending on the initial velocity, this weak shock develops into a compression wave or a weak bow shock upstream). The interface between the compressed/shocked gases is a contact discontinuity, which envelopes the cold gas in roughly a bullet shape.
The front of this contact discontinuity is roughly spherical, while Kelvin-Helmholtz instabilities and turbulence, induced by the tangential velocity discontinuity between cold and hot gas, lead to the development of large eddies (Mazzotta et al., 2002).
The shock passage through the cold gas moves the material with the lowest entropy and the highest density away from the center of the potential well. After the shock passage, this leads to a reversal of the velocity pattern, due to the gravitational field whose center is no longer co–spatial with the lowest entropy, highest density material. This field accelerates the material against the direction of the background flow, transporting it back towards the contact discontinuity.
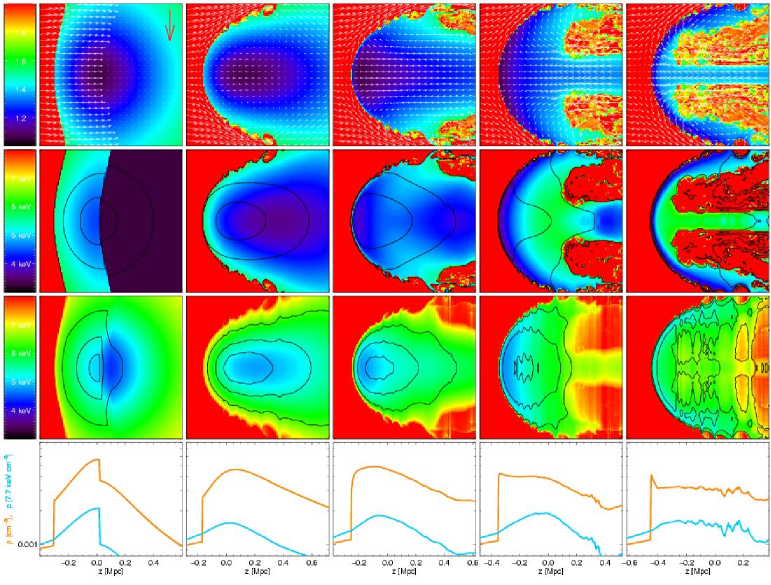
As material is streaming towards the front of the cloud, a developing shear-layer due to unstable Kelvin-Helmholtz modes drives material along the contact discontinuity backwards, in the direction of the background flow. Together with the backflow induced by the displacement of the cloud core away from the center of the gravitational well, this results in the formation of a strong vortex inside the cloud, which transports material inside the cloud against the direction of the background flow along the symmetry axis (i.e., to the left in Fig. 1), and, along the surface, in the direction of the background flow (i.e., to the right in Fig. 1). It is this vortex that leads to the transport of low entropy, low temperature material towards the front of the cloud. We have visualised this transport in an animation viewable at http://www.mpa-garching.mpg.de/heinzs/transport.html. Morphologically very similar structures have been seen in previous simulations of ram pressure stripping by Balsara et al. (1994); Murray et al. (1993).
The effect of the internal circulation on the entropy and temperature structure of the cloud can be seen in Fig. 1. The lowest entropy material is transported to the front, while material with higher entropy fills the center of the cloud. The rarefaction wave behind the cloud leads to rather low temperatures on the trailing side as well, due to the adiabatic expansion of the material in the rarefaction. However, the emission weighted temperature map shows clearly that the dense, high emission measure material at the front of the cloud produces the lowest observable projected temperature.
2.3 Transport processes and cloud destruction
In the outskirts of the cloud, the background flow can unbind gas from the cloud potential as long as the ram pressure exceeds the binding energy of the gas, i.e, as long as . This sets the initial size of the stripped cloud, after the passage of the wind driven shock wave (roughly corresponding to the second panel in Fig. 1):
| (2) |
where is the sound speed of the unperturbed, cold, isothermal cloud, is the adiabatic index of the gas, and is the velocity of the external wind. We define as the cloud density at . In the case of the above simulation, . For large velocities or small density contrasts, all the material is unbound and stripping is effective even in the absence of dynamical instabilities. This is the case if In the simulation shown above and, most likely in A3667, this condition is not met (Vikhlinin et al., 2001b). Thus additional dynamical effects must come into play to destroy the cloud.
The removal of material along the cloud surface is facilitated by Kelvin-Helmholtz eddies (Nulsen, 1982). The largest growing mode has a wavelength of order for . In the limit of (which is achieved both in observed cold fronts and the simulation shown above), the growth time of a mode of wavelength is . A shear layer of thickness set up by a fully non–linear mode of wavelength that transports material away from the cloud surface with velocity of order . Since the largest unstable mode has , the destruction time of the cloud is approximately given by
| (3) |
where we defined the ablative index to be calibrated by the simulations.
The shear layer induces a vortex inside the cloud, which becomes stronger over time as the width of the shear layer grows as longer and longer wavelengths become fully non–linear. By construction, the time it takes for this vortex to transport the lowest entropy material from the core to the front is , since this is the time for the shear layer to remove most of the mass of the cloud, and thus to turn over the entire cloud. It is therefore natural to assume that during the late stages of cloud evolution the coldest material will find itself close to the front of the cloud.
Accordingly, from the simulation shown above, we see that the cloud is destroyed at about the same time that the low entropy gas has been transported to the front. The numerical experiment yields , which is the order magnitude expected from eq. (3).
3 Illustrative case – A3667
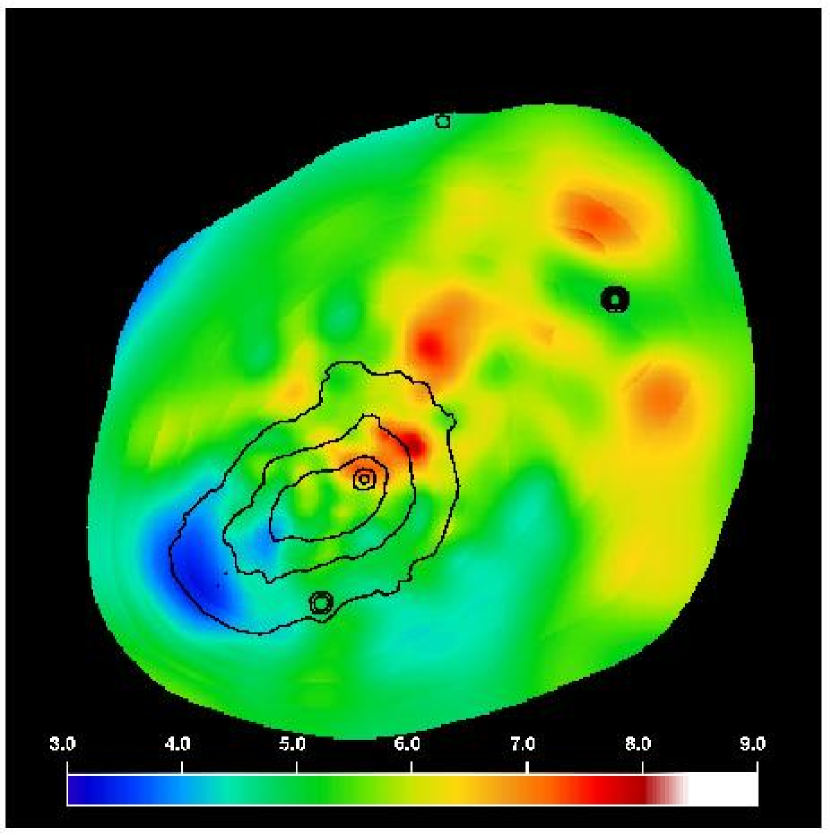
To further illustrate the relevance of the mechanism, considered above, to the actual structure of the observed cold fronts, we calculated the temperature structure of A3667 using XMM-Newton data. The front in A3667 (Vikhlinin et al., 2001a) is the clearest front detected by Chandra.
We used four XMM-Newton observations of A3667 (observations IDs 0105260301, 0105260401, 0105260501, 0105260601). The description of the data and detailed analysis are given by Briel & et al. (2003). Here we provide only the gas temperature map for this cluster based on the MOS data. To calculate the projected gas temperature distribution, we employed the method described in Churazov et al. (1999). Namely, we fit the observed spectra at a given location as a linear combination of two template spectra corresponding to emission from an optically thin plasma (convolved with the MOS energy response) with temperatures 2 and 8 keV and determine the gas temperature as a function of the relative weights of the template spectra. The resulting “temperature map”, adaptively convolved to have an effective number of counts per smoothing window of 6400, an approximate S/N of 80, is shown in Fig. 2. The contours show isophotes of the X-ray surface brightness in the 0.5-3 keV energy band. The outermost contour approximately traces the discontinuity, discussed in Vikhlinin et al. (2001a). From this figure it is clear that the lowest entropy gas is located along the interface and its temperature is lower than that in any other place. The extension of the cool region outside the discontinuity (marked by the contour) is due to the significant smoothing used to generate the temperature map. The overall structure is strikingly similar to the predictions of the simple model considered in the previous section. It is therefore reasonable to assume that this cool gas is the low entropy gas transported from the core of the cloud to the interface where it expanded and cooled to the observed low temperature.
4 Discussion and conclusion
Cold fronts were also identified in the full (cold dark matter + fluid dynamics) simulations of Nagai & Kravtsov (2003) and Bialek et al. (2002). Compared to these simulations our model is intentionally kept simple, using rather idealised initial conditions. This simplicity, however, allows us to see the evolution of the cloud characteristics in a physically more transparent and controlled situation. The results shown above are in broad agreement with the suggestions made by Nagai & Kravtsov (2003) and Bialek et al. (2002), although the detailed description of the cloud evolution is different. As such, our simulations are not meant to replace full blown 3D cluster merger simulations, rather, we use them as a tool to point an important mechanism at work inside ram pressure stripped sub-clusters, which, while present in larger scale simulations, had not been identified in previous publications on the subject.
We show that slow gas motion inside a gaseous subcluster moving through a uniform medium transports gas from the central parts of the cloud towards the contact discontinuity, which separates the subcluster gas from the external gas. In a typical cluster or group of galaxies, the entropy of the gas in the central region is significantly lower than the entropy of the outer layers. The gas transported from the core region will undergo adiabatic expansion and cool to temperatures less than its initial temperature. This cool gas may form a cool and bright tip at the leading edge of a moving cloud. Such a situation can be characteristic of a subcluster or a group that still retains gas in its gravitational potential, but spends sufficient time moving through the cluster gas so that motions inside the cloud are fully developed.
Assuming that the original subcluster had a metallicity gradient with the most metal rich gas near the center, the transport of the core gas towards the interface should also enhance the abundance contrast across the discontinuity.
As mentioned before, the simulations presented in §2 ideallized for the purpose of isolating the process we were interested in studying in this paper. Many more levels of complexity can be added to tailor the simulations to specific cluster merger scenarios. For example, it is easily possible to simulate such a merger by running two beta model atmospheres into each other. In this way, one can capture the additional effects of varying ram pressure due to the stratified cluster atmosphere and of tidal effects.
To verify that the effects discussed above act in such a more general scenario, we ran several simulations of two beta model atmospheres colliding, with one cluster being significantly larger, more massive, and hotter than the other. Indeed, the same mechanism discussed above operates in such cases as well. In addition, more complex dynamical effect occur in the stripped wake, especially immediately after the passage of the smaller cluster core through the bigger one. This interaction also induces some internal waves which produce interesting observable features inside both atmospheres (comparable to the effects of sloshing mentioned above). Additionally, adiabatic expansion of the material as it exits the larger cluster after passage leads to a significant cooling of the material, enhancing the effect described above even more: The lowest entropy and thus coolest material lies at the front of the sub-cluster.
Such simulations introduce a number of additional free parameters, and it is beyond the scope of this paper to map out all of this parameter space, in particular since even such a simulation will be artificial in that it neglects the evolution of the underlying dark matter, truncation effects of the cluster atmospheres, and non-sphericity of the gas clouds. We note, furthermore, that reproducing a specific observational scenario in detail, such as the example of Abell 3667, is a non-trivial exercise in fine tuning. For example, the estimated low Mach number of around seen in this object (Vikhlinin et al., 2001a) is difficult to reproduce by simple free-fall simulations of two clusters, which ultimately lead to Mach numbers of around near the impact of the two cores, corresponding to the typical depth of the potential well of a King model (King, 1962). The frequency of incidence of such low Mach number merger shocks is a question that can only be answered by detailed studies in the context of structure formation simulations.
Thus, many other effects will play a role in determining the observational appearance of subclusters in ram pressure dominated environments. For example, a subcluster which has already passed through the dense core of the main cluster will have been stripped of most of its outer gas. Upon leaving the core on the other side of the main cluster, the subcluster will propagate into a lower pressure and lower density environment, thus expanding adiabatically and cooling to form a cold cloud, as observed in many cluster environments. Mergers may also induce sloshing of low entropy gas in the potential wells of the cluster cores and cause the displacement of the cool gas relative to the equilibrium position (Markevitch et al., 2001, 2002; Churazov et al., 2003). Nonetheless, the processes described in this paper will operate under most of these conditions as well, leading to the transport of cold material to the front of the cloud on time scales comparable to the lifetime of the subcluster.
We would like to thank Markus Brueggen, Torsten Ensslin, Maxim Markevitch, Francesco Miniati, Alexey Vikhlinin, and Simon White for helpful discussions. CJ and WF thank MPA for hospitality and support during the summer of 2002 when this work was begun and also acknowledge support from the Smithsonian Institution and NASA contract NAS8-39073.
References
- Balsara et al. (1994) Balsara D., Livio M., O’Dea C. P., 1994, ApJ, 437, 83
- Bialek et al. (2002) Bialek J. J., Evrard A. E., Mohr J. J., 2002, ApJ, 578, L9
- Briel & et al. (2003) Briel U., et al. 2003, in preparation
- Churazov et al. (2003) Churazov E., Forman W., Jones C., Böhringer H., 2003, ApJ, 590, 225
- Churazov et al. (1999) Churazov E., Gilfanov M., Forman W., Jones C., 1999, ApJ, 520, 105
- Clarke et al. (1994) Clarke D. A., Norman M. L., Fiedler R. A., 1994
- Dupke & White (2003) Dupke R., White R. E., 2003, ApJ, 583, L13
- Fryxell et al. (2000) Fryxell B., Olson K., Ricker P., Timmes F. X., Zingale M., Lamb D. Q., MacNeice P., Rosner R., Truran J. W., Tufo H., 2000, ApJS, 131, 273
- Kempner et al. (2002) Kempner J. C., Sarazin C. L., Ricker P. M., 2002, ApJ, 579, 236
- King (1962) King I., 1962, AJ, 67, 471
- Markevitch et al. (2000) Markevitch M., Ponman T. J., Nulsen P. E. J., Bautz M. W., Burke D. J., David L. P., Davis D., Donnelly R. H., Forman W. R., Jones C., Kaastra J., Kellogg E., Kim D.-W., Kolodziejczak J., Mazzotta P., Pagliaro A., Patel S., Van Speybroeck L., Vikhlinin A., Vrtilek J., Wise M., Zhao P., 2000, ApJ, 541, 542
- Markevitch et al. (2002) Markevitch M., Vikhlinin A., Forman W., 2002, in Matter and Energy in Clusters of Galaxies, astro-ph/0208208
- Markevitch et al. (2001) Markevitch M., Vikhlinin A., Mazzotta P., 2001, ApJ, 562, L153
- Mazzotta et al. (2002) Mazzotta P., Fusco-Femiano R., Vikhlinin A., 2002, ApJ, 569, L31
- Murray et al. (1993) Murray S. D., White S. D. M., Blondin J. M., Lin D. N. C., 1993, ApJ, 407, 588
- Nagai & Kravtsov (2003) Nagai D., Kravtsov A. V., 2003, ApJ, 587, 514
- Nulsen (1982) Nulsen P. E. J., 1982, MNRAS, 198, 1007
- Stone & Norman (1992a) Stone J. M., Norman M. L., 1992a, ApJS, 80, 753
- Stone & Norman (1992b) Stone J. M., Norman M. L., 1992b, ApJS, 80, 791
- Sun et al. (2002) Sun M., Murray S. S., Markevitch M., Vikhlinin A., 2002, ApJ, 565, 867
- Vikhlinin et al. (2001a) Vikhlinin A., Markevitch M., Murray S. S., 2001a, ApJ, 551, 160
- Vikhlinin et al. (2001b) Vikhlinin A., Markevitch M., Murray S. S., 2001b, ApJ, 549, L47