The -band Luminosity and Stellar Mass Functions of Galaxies in Clusters
Abstract
We present the near-infrared (-band) luminosity function of galaxies in two cluster candidates, 3C336 and Q1335+28. A third cluster, 3C289, was observed but found to be contaminated by a foreground system. Our wide field imaging data reach to =20.5 (5), corresponding to +2.7 with respect to the passive evolution. The near-infrared luminosity traces the stellar mass of a galaxy due to its small sensitivity to the recent star formation history. Thus the luminosity function can be transformed to the stellar mass function of galaxies using the colours with only a small correction (factor2) for the effects of on-going star formation. The derived stellar mass function spans a wide range in mass from 31011 M⊙ down to 6109 M⊙ (set by the magnitude limit). The form of the mass function is very similar to lower redshift counterparts such as that from 2MASS/LCRS clusters (Balogh et al. 2001) and the clusters (Barger et al. 1998). This indicates little evolution of galaxy masses from to the present-day. Combined with colour data that suggest star formation is completed early () in the cluster core, it seems that the galaxy formation processes (both star formation and mass assembly) are strongly accerelated in dense environments and has been largely completed by . We investigate whether the epoch of mass assembly of massive cluster galaxies is earlier than that predicted by the hierarchical galaxy formation models. These models predict the increase of characteristic mass by more than factor between and the present day. This seems incompatible with our data.
keywords:
galaxies: clusters – galaxies: formation — galaxies: evolution — galaxies: stellar contentReceived, Accepted
1 Introduction
In the hierarchical structure formation scenario based on a CDM Universe, a galaxy forms by the assembly of many proto-galactic fragments. These small systems collapse first in the high density peaks in the initial density fluctuation fields, and grow by successive mergers between galaxies. This overall picture is supported by various pieces of observational evidence, such as the existence of dynamically decoupled subgalactic components within a galaxy (eg., de Zeeuw et al. 2002) or on-going mergers with tidal remains. Le Fèvre et al. (2000) count the statistical associations of close companions around galaxies in the redshift survey fields (CFRS and LDSS) based on the high spatial resolution images by WFPC2 on the Hubble Space Telescope (HST). They find a rapid increase in the fraction of close pairs with redshift, suggesting that a typical galaxy today has undergone 1-2 significant merger events since . Dickinson et al. (2002) have shown that the most luminous Lyman break galaxies at in the Hubble Deep Field North are an order of magnitude less massive than today.
Clusters of galaxies are specially selected areas that grow from high density regions in the large scale structure of the early Universe. In these regions, the galaxy formation process is likely to be accerelated. This qualitatively explains why the majority of star formation in galaxies in cluster cores take place much earlier () than that in the general field (as shown by the extensive analyses based on the fundamental planes (FP) and the colour-magnitude relations (CMR) both locally and at higher redshifts eg., Bower et al. 1992; 1998; Ellis et al. 1997; van Dokkum et al. 1998; Stanford et al. 1998; Kodama et al. 1998, Kelson et al.2000). Compared to star formation, hierarchical galaxy formation models (eg., Kauffmann 1996) predict that the mass assembly process is more widely spread over time. Indeed, van Dokkum et al. (1999) find many mergers or close companions in a cluster, suggesting that mass assembly is still in an active phase in this high redshift cluster, even though the star formation in most of these mergers have been completed (as suggested from their red colours). The key issue now is to identify the epoch by which the cluster galaxies have accumulated most of their mass. This is still an open question.
However, measuring total galaxy masses at high redshifts is difficult, since dynamical measurements of internal velocity dispersion for a large statistical sample becomes extremely time consuming even with 8-10 m telescopes (van Dokkum & Stanford 2002). In contrast, stellar mass can be more easily estimated based on the near-infrared luminosity. The near-infrared luminosity of a galaxy is relatively insensitive to its on-going/recent star formation history even at high redshifts (), and hence gives a good measure of the underlying total stellar mass of the galaxy. Kauffmann & Charlot (1998) showed that the evolution of near-infrared luminosity function (LF) was a sensitive test of galaxy formation models, where we should expect to see strong evolution with redshift if the mass of the galaxies are growing due to the assembly processes. Kauffmann & Charlot argued that this evolution will be most prominent in the number density of massive galaxies, since it takes longer to form these massive systems.
For the brightest cluster galaxies, Aragón-Salamanca, Baugh, & Kauffmann (1998) have shown that there is significant mass evolution between and present-day, typically by a factor 2-3. The observational result that the central galaxy of a cluster is separated to multiple systems supports this view (Yamada et al. 2002). This can be easily understood, since the brightst cluster galaxy preferentially sits in the dynamical centre of a cluster, where the satellite galaxies tend to sink and merge towards the central galaxy due to the dynamical friction (Binney & Tremaine 1987).
Pioneering work using the -band LF to quantify the mass evolution of the cluster galaxy population has been presented by Barger et al. (1996; 1998) and De Propris (1999) for many distant clusters out to . They both find that the change of characteristic luminosities of the -band LFs with redshift is entirely consistent with the passive evolution of galaxies formed at high redshifts (), suggesting mass evolution is negligable between and the present. These results have pushed the mass assembly epoch of the massive cluster galaxies to higher redshift (). It is worth noting, however, that their analyses are limited to the very central part of the clusters (typically clustercentric distance of 0.5 Mpc), and may not be representative of the whole cluster population due to dynamical mass segregation.
In this paper, we present the combined -band luminosity function of the two clusters drawn from a wide field (1 Mpc) in order to study the stellar mass evolution of the representative cluster population as a whole. We use colours to correct for the effect of star formation on the mass-to-luminosity () ratio in order to derive the stellar mass. The crucial issue is whether there is a deficit of massive galaxies () at compared to the less massive galaxies. A detection of this deficit would confirm the importance of galaxy mergers, as suggested by hierarchical galaxy formation models.
An outline of the paper follows. After describing the cluster selection, observation and the data reduction in § 2, and the data processing including the corrections for incompleteness and foreground and background contamination in § 3, we present the -band number counts, luminosity function, and the stellar mass function of the clusters in § 4. Discussion and conclusions are given in § 5 and § 6, respectively. The cosmological parameters adopted throughout this paper are (, , )=(0.7, 0.3, 0.7), unless otherwise stated. Here we define and as /(100 km s-1 Mpc-1) and /(70 km s-1Mpc-1), respectively.
2 Observation and Data Reduction
| Cluster | Redshift | RA (J2000) | Dec (J2000) | (sec) | (sec) | FoV (arcmin2) |
|---|---|---|---|---|---|---|
| 3C336 | 0.927 | 16 24 39.1 | 23 45 13 | 5,400 | 10,320 | 12.56 |
| 3C289 | 0.967 | 13 45 26.4 | 49 46 33 | 5,400 | 5,520 | 12.94 |
| Q1335+28 | 1.086 | 13 38 07.5 | 28 05 11 | 5,400 | 10,440 | 13.09 |
2.1 cluster sample
We selected three cluster candidates at , 3C336, 3C289 and Q1335+28, which are all associated with QSO’s. The positions and redshifts of the QSO’s are given in Table 1. Each of our sample is a highly plausible cluster at similar redshift, . The existence of the 3C336 cluster was firmly established by Steidel et al. (1997) in their spectroscopic observations of the galaxies around the QSO to identify the QSO absorbers. Bower & Smail (1997) detected a weak lensing signal in the HST WFPC2 images towards this field which is probably originated from the deep cluster potential associated to the QSO. The 3C289 cluster also shows a merginal weak lensing signal (Bower & Smail 1997). Best (2000) has shown a clear number excess of galaxies around the 3C289 QSO in their near-infrared image and the HST optical image. These galaxies form a tight red colour-magnitude sequence, indicating the existence of a cluster. The Q1335+28 (B2 1335+28) cluster was first noted by Huchings et al. (1995) as the excess of Oii emitters in a narrow-band survey. Yamada et al. (1997) have confirmed an excess of red galaxies which form a colour-magnitude sequence. Tanaka et al. (2000) conducted a detailed photometric analysis of this cluster based on the optical and near-infrared imaging data.
2.2 Observation
We have conducted a wide-field, near-infrared imaging in and bands of the three clusters with INGRID on the 4.2m telescope William Hershel Telescope (WHT) at La Palma for 28-31 Mar 2001. Our exposure times are given in Table 1. INGRID has a large field of view of 4′4′ with a pixel scale of 0.238′′. The actual field of view of the combined frames are slightly smaller due to the dithering and are given in Table 1. The typical field size is 3.6′3.6′, covering 1.7 Mpc on a side at the cluster redshifts. The field centres are chosen at the QSO positions, except for the Q1335+28 cluster where the field centre is shifted to 1′ to the South and 1′ to the West to optimally cover the known structures of the cluster (Tanaka et al. 2000).
The second half of the run had good seeing conditions at FWHM0.6-0.7′′. The combined frames have FWHM=0.7-0.8′′. The observation was mostly photometric and the photometric zero-points were calibrated using the UKIRT faint standard stars (Casali & Hawarden; Hawarden et al. 2001) taken during the photometric nights. The 5 limiting magnitudes are =23.0 and =20.5, which correspond to +2.5-2.7 with respect to passively evolving galaxies at .
2.3 Data reduction
We used IRAF software in reducing the data following standard procedures. Flat fielding was made using the super-flat constructed by combining all the non-aligned frames. We then subtract the sky background by median filtering. Finally, we median combine the frames after aligning the frames using 2-5 stellar objects. SExtractor v.2.1.6 (Bertin & Arnouts 1996) is then used for object detection in the -band frame. More than 5 connected pixels with counts greater than 1.5 above the background noise level is detected as an object. -band magnitude is measured at each point of the -band selected object. The SExtractor output MAGBEST is used as an estimate of the total magnitude in , and the 2′′ diameter aperture is used to derive the colour in . Some obvious stars are excluded on the basis of the SExtractor output (CLASS_STAR0.6) in the -band (which is 0.1-0.3 mag deeper than for the passive cluster members). Colour images of the three systems are shown in Figs. 1–3.
3c336_colour.jpg
3c289_colour.jpg
q1335_colour.jpg
3 Data Analysis


3.1 Completeness correction
Since we are interested in the number density of the faint objects, it is essential to correct for the completeness for the object detection at faint magnitudes. To estimate the completeness, we use ‘artificially dimmed true images’, rather than artificially generated galaxies, which are embedded in the data frames. We first construct a ‘noise frame’ by combining the randomly shifted individual frames instead of being aligned correctly according to the dithering (as done for constructing the ‘science frame’ in § 2.3). We then dim the properly combined original science frame by 1-2 magnitudes. We now combine the noise frame and the dimmed science frame together, by properly weighting the two frames according to the dimmed magnitudes. In this way, we can make up a new frame where the objects are dimmed by a certain magnitudes while keeping the noise amplitude unchanged. The object detection using the SExtractor is then processed on this frame using the same set-up parameters as used for the original frame, and count the number of galaxies which are detected in the original science frame but are not detected in the dimmed new frame. From this simulation, we estimate the completeness to be 90% at the =18.5-19.5 bin, 80% at =18.5-19.5, and 70% at =19.5-20.5 magnitudes for 3C336 and Q1335+28 clusters. For 3C289, the completeness is slightly lower due to the lower exposure time in the -band (90% at =16.5-17.5, 80% at =17.5-18.5, 70% at 18.5-19.5 and 50% at =19.5-20.5), but this cluster will be excluded from our sample to construct the luminosity and mass functions due to foreground contamination (see § 3.2). We scale the galaxy counts by multiplying the inverse of the completeness factor at each magnitude bin. The maximum factor that is multiplied for the incompleteness correction is therefore only 1.429 (or 0.155 dex) at the faintest bin () for 3C336 and Q1335+28 clusters. In the colour-magnitude diagrams in Figs. 4a–c, we generated additional faint galaxies to compensate the incompleteness by scattering the existing galaxies according to the Gaussian photometric errors.
3.2 Stars, foreground and background galaxies subtraction
Our star and field galaxy subtraction scheme has two steps. Firstly, a loose colour cut in is applied to initially suppress the contamination. And secondly, a statistical field subtraction is applied using the blank field data.
In addition to the star exclusion based on the CLASS_STAR (§ 2.3), we use a colour cut at (Figs. 4) to suppress the remaining star contamination. The objects bluer than this line are likely to be stars or blue foreground galaxies, since these colours are too blue for cluster members. For example, a constant star formation model with gives 1.1 at . In contrast, most stars are bluer than =1.0 except for M giants which can be as red as (Bessell & Brett 1988). Therefore, the cut is an effective way to subtract many of the stars and blue foreground populations while keeping the cluster members.
We also apply a colour cut (Figs. 4) well above the red colour-magnitude sequence of the cluster members at (2 photometric errors at our magnitude limit) in order to suppress contamination from red background galaxies and to thus reduce the statistical fluctuations in the background subtraction. Although we cannot deny the possibility that some member galaxies could be redder than this limit due to the heavy dust extinction even in (; Calzetti et al. 2000), these colours are much redder than passively evolving cluster members that track the reddest colour envelope.
With the above colour cuts, and the additional magnitude cut at =20.5 applied, we then apply a statistical field subtraction based on the blank field data. Here we use the deeper wide-field near-infrared data-set from the NTT Deep Field, the Chandra Deep Field, and the Hubble Deep Field South (Saracco et al. 1999; 2001). The total area amounts to 33.45 arcmin2, significantly larger area than our individual cluster field (13 arcmin2). Figures 4 show a typical Monte-Carlo run of the statistical field subtraction for each cluster. We divide the colour-magnitude diagram under consideration into 64 bins (within the colour and magnitude cuts) with the steps of 1 magnitude in and 0.25 magnitude in . The details of the method should be referred to Appendix A in Kodama & Bower (2001). The filled circles represent the plausible cluster members that are statistically in excess above the blank field.
The 3C336 and Q1335+28 cluster candidates show clear sequences of red galaxies near the passive evolution prediction at each cluster redshift (solid lines in Figs. 4), confirming the existence of the massive clusters. There are some very bright galaxies (16.5) that are statistically selected as members. However, judging from their unrealistically bright magnitudes, these are likely to be foreground galaxies which are retained due to the low number statistics in this colour-magnitude range. In fact, there are only a few galaxies brighter than =16.5 both in the cluster fields and the blank field, and it is very hard to statistically remove the field contamination correctly in this range.
As shown in Fig. 4b, 3C289 cluster has a large number of blue galaxies () left after the field subtraction process, as well as many red galaxies on or near the passive evolution line at the cluster redshift. Judging from the brightness and the narrowness of the colour distribution of these blue excess galaxies, these are likely to come from a foreground structure(s) in excess of the average field rather than blue cluster members. Therefore, we do not include this 3C289 cluster in the following analyses in order to avoid the possible impact of this foreground contamination.
There are also a few bright blue galaxies with and in the remaining two clusters, especially in the Q1335+28 cluster, that are identified as cluster members on the basis of statistical field subtraction. It would be surprising if these galaxies were genuine cluster members, given their blue colours for their brightness. Such bright, blue galaxies are not seen in spectroscopically confirmed sample of cluster members in the lower- clusters studied by such as MORPHS (eg., Dressler et al. 1999) and CNOC (eg., Yee et al. 1996) projects. Because of this uncertainty, in the following analyses, we show the results for both cases where these bright, blue galaxies are included, and excluded.
4 Results
4.1 The -band Number Counts
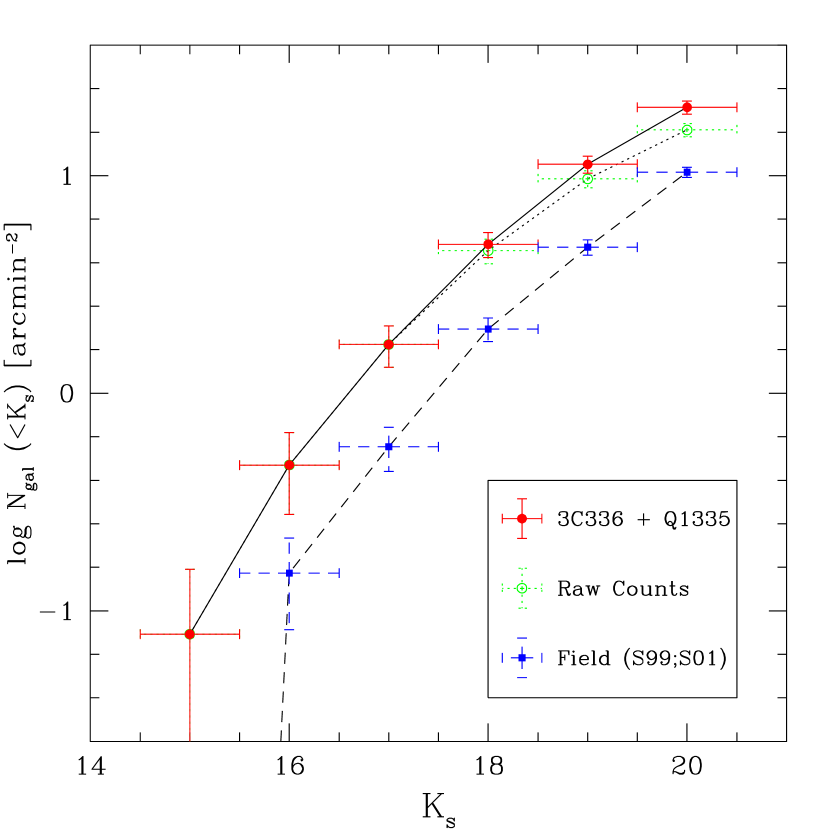
Figure 5 shows the integrated number counts of galaxies in -band for our cluster fields (dotted line for the raw counts and solid line for the incompleteness corrected one) and for the blank field (dashed line). The error bars represent the simple Poisson errors. Both counts show smooth increase towards fainter magnitudes, and the excess of the counts in our cluster field compared to the blank field is clear and is order of factor 2-3 depending on the magnitude range that is integrated over. This excess supports the existence of the distant clusters in these QSO fields.
4.2 The -band Luminosity Function
We now construct the -band LF of the cluster galaxies to investigate the mass distribution of cluster galaxies at this high redshift. We combine the two clusters 3C336 and Q1335+28 to reduce the statistical uncertainty. We note that the individual LFs of these two clusters have consistent properties within errors.
The completeness correction at the faint magnitudes is applied as in § 3.1. The field contamination is also subtracted using the same blank field data as in §3.2, but here we do not use the colour information more than to restrict the galaxies to , and simply subtract the field counts in each magnitude bin, instead of doing it by a Monte-Carlo simulation in each colour-magnitude grid (§ 3.2), to make this process simpler. The -band LF of each cluster is transformed to the common redshift of by correcting both for the small k-corrections and the small distance differences (=+0.12 and =0.15 in total for 3C336 and Q1335+28, respectively), and then combined.
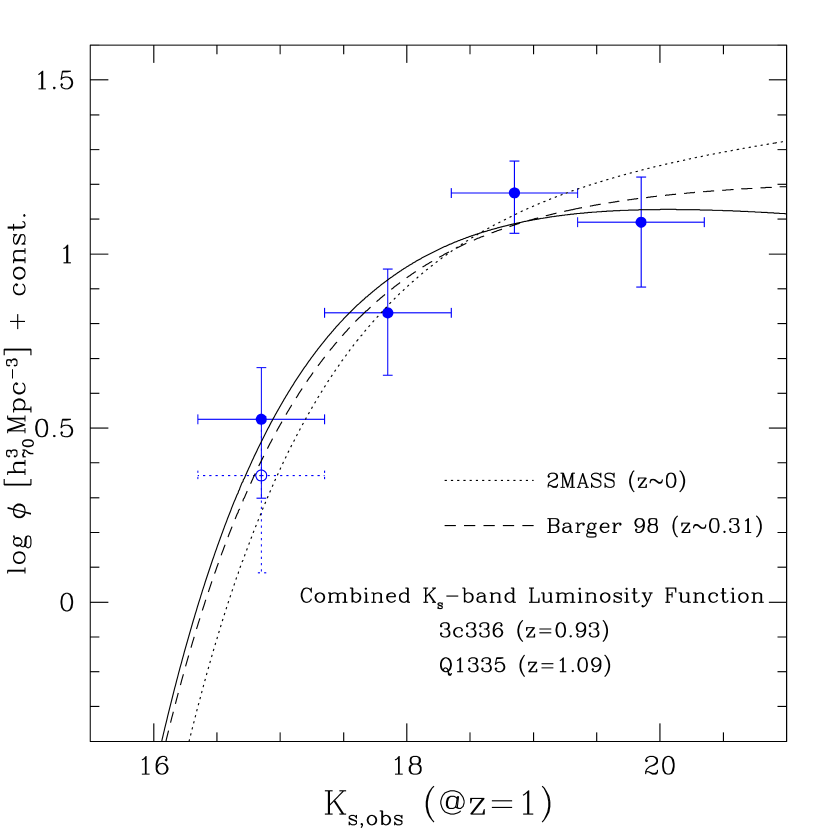
The filled circles with error bars in Fig. 6 show the combined LF of the two clusters in the observed band seen at . The solid line indicates the best-fit Schechter function. The error bars represent the Poisson statistics based on the number of cluster galaxies and that of the subtracted field galaxies. The open circles show the case where the bright and blue galaxies are excluded from the analysis with the suspicion that these galaxies are not cluster members. Since the faint-end slope () of the Schechter function is not well determined by the data due to its depth, the slope is fixed to , the same slope used in De Propris et al. (1999) who took this value from their Coma data (De Propris et al. 1998). We compare this LF to the lower redshift counterparts such as 2MASS/LCRS clusters at (Balogh et al. 2001) and the clusters by Berger et al. (1998) by transforming the low redshift data to according to passive evolution with . This shown by the dotted and the dashed curves respectively. The normalisation of is set so that all the curves have the same amplitude at each . As can be seen, once passive evolution is taken into account, further evolution of the mass function is not detected.
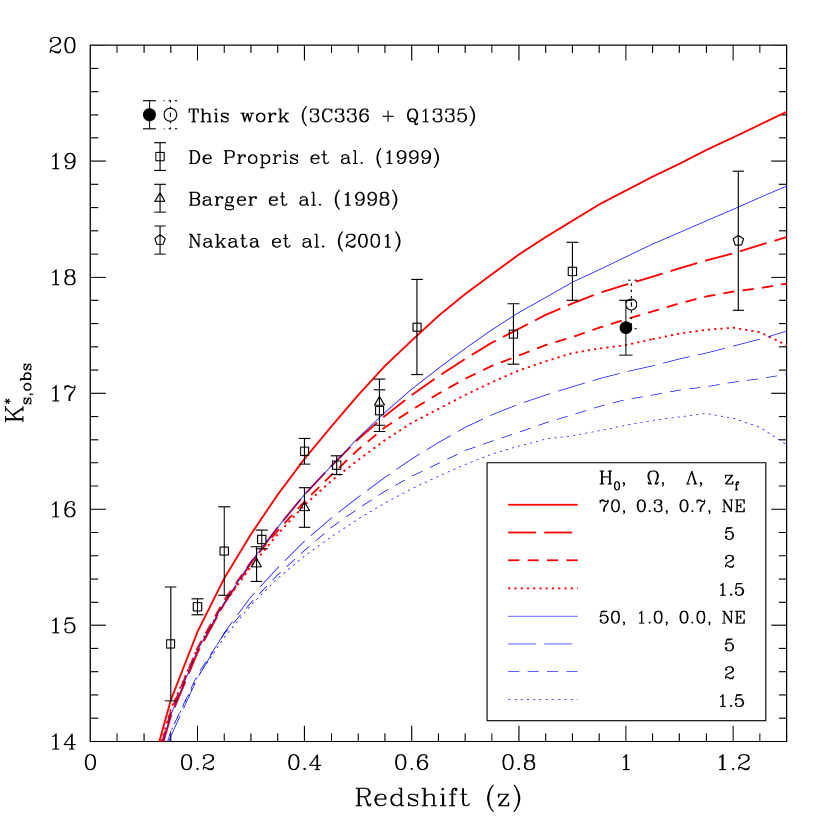
This is also clearly shown in Fig. 7 which indicates the evolution of the observed of the LF as a function of cluster redshift, compared to the passive evolution models with different formation redshifts, and no-evolution models for two different cosmologies. The filled circle represents the in the Schechter curve in Fig. 6 and the open circle shows the one if the bright blue galaxies ( and ) are excluded. Both of these points are fully consistent with the passive evolution models with in both cosmologies. Therefore, the magnitude change in the -band LF since to the present-day can be fully descibed by pure luminosity evolution following the passive evolution expected in an old stellar system.
We note however that luminosity evolution and the stellar mass evolution is degenerate in this figure (eg., van Dokkum & Stanford 2002). For example, if the formation redshift were significantly younger, eg. , the observed at clusters would be fainter than that predicted by the passive evolution and hence some stellar mass evolution (in the sense of having less massive systems at high redshifts) would be allowed. In this case, however, the galaxy colours would be significantly bluer than those observed. The passive evolution of early-type galaxies with =1.5 would give at , which would be already significantly bluer than the majority of the likely members in clusters (see Fig. 4). Therefore by combining the luminosity evolution and the colour evolution, we can simultaneously put constraints on the formation redshift of the cluster galaxies and their mass evolution. In this way, we argue that both the star formation and the mass assembly processes of galaxies have been largely completed by in cluster cores. We can reinforce this arguement by estimating the stellar masses of individual galaxies from their -band magnitudes and the colours and deriving the stellar mass function directly. This is discussed in the following section.
4.3 The Stellar Mass Function
The -band luminosity approximates the stellar mass of a galaxy due to its relatively small sensitivity to recent star formation activity and dust extinction. However, in order to derive an accurate stellar mass of an individual galaxy, we should apply a small correction to the ratio depending on the galaxy’s star formation history. This correction can decrease the derived stellar mass by upto factor2 for vigourously star forming galaxies.
The recent star formation activity of each galaxy with respect to its underlying passively evolving component affects not only on the stellar ratio in the -band but also the colour because both reflect the stellar population mix of the galaxy. Specifically, the larger the recent star formation activity is, the smaller the ratio is and the bluer is the colour. Therefore by establishing the relation between ratio and colour, we can more reliably transform the magnitude into the stellar mass by using the known colour of an individual galaxy. (We note that the ‘stellar mass’ refered to in this paper takes into account the mass loss from evolved stars and novae. The evolution of ratio in the population synthesis model that is used to transform luminosity to stellar mass includes this effect, as does the stellar mass predicted by the semi-analytic models used later in § 4.3.)
We take the relation between these two quantities from the models in a sequence of bulge-to-total ratios (Kodama, Bell, Bower 1999), where the disk component (which is mimicked by the exponentially declining star formation with a time scale of =3.5 Gyr and an infall time scale of =3.5 Gyr) is added onto the underlying passively evolving bulge component (which is represented by the elliptical galaxy model that has an old initial star-burst within the first Gyr). Using a different set of models (such as taking a different age for the underlying bulge or adding a secondary burst to the bulge) do not significantly change the relation between the ratio and the colour since both quantities always change in the same direction.
In this analysis, we shift the zero-point in the observed colours by +0.07 magnitude for the 3C336 cluster, since the observed red sequence is bluer than the model sequence (Fig. 4a). This zero-point mismatch can be probably atributed to a model uncertainty and/or an observational error on the absolute photometry. We note, however, that this mismatch does not significantly affect the conclusions presented in this paper, since it corresponds to the difference of only 10.
Furthermore, when we compare our mass function with the other data from the literature, we apply a correction to our mass function for differences in the IMF and cosmology. We have derived our mass functions with power-law IMF with and with the Hubble constant of =70, whereas the other data presented use Kennicutt’s (1983) IMF and =100. These differences shift the derived mass by 0.2 and 0.31 dex, respectively. The mass in our analysis have been therefore decreased by these amounts in Figs. 8 and Table 2 to compare with the other data.
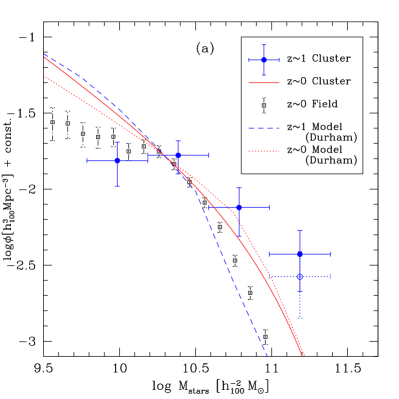
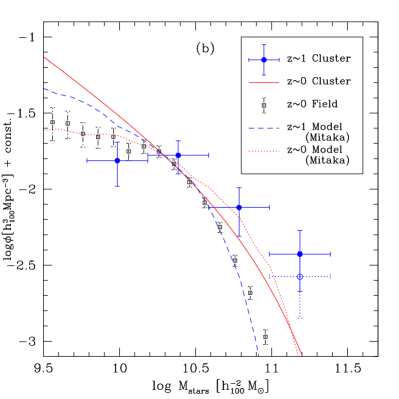
The combined stellar mass function of the galaxies in the two clusters is presented in Figs. 8. The open circle shows the case where the blue and bright galaxies are excluded (as in Fig. 6). The solid line indicates the 2MASS/LCRS result (Balogh et al. 2001) who derived the stellar mass function of galaxies in local clusters from the -band LF by applying the star formation correction using the D4000 index that is equivalent to a colour. The 2dF local stellar mass function is also shown by the squares. In the absence of an independent constraint on the total mass of each cluster, the normalisation of the mass function is arbitrary. The curves have therefore been renormalised to the same amplitude at 21010M⊙. Over the range spanned by our data, the shapes of our mass function at and the 2MASS/LCRS or 2dF ones at look very similar. This indicates again that the mass evolution is little since to the present-day. We quantify this comparison below by comparing the observed mass function with those predicted from semi-analytic models.
4.3.1 Comparison with the semi-analytic models
The fact that the massive galaxies (1011M⊙) are already abundant in the clusters can potentially put a very strong constraint on the hierarchical galaxy formation models. In such a models, massive galaxies are the end products of the repeated mergers of the smaller galaxies, and hence take a relatively long time to form. We compare our results with semi-analytic models from Durham and Mitaka (Cole et al. 2000 and Nagashima et al. 2002, respectively) prepared for us by Carlton Baugh and Masahiro Nagashima respectively. The Durham model prediction is made for the haloes with the mass chosen so that the space density of the haloes is the same as that of the present-day rich clusters such as Abell clusters (210-6 M⊙ Mpc-3), whereas the Mitaka model (Nagashima et al. 2002) prediction is made for the galaxies in the 100 haloes whose circular velosity is equal to 1000 km/s chosen at , The Durham and Mitaka models are independent implementations of the semi-analytic scheme, and the details of the treatment differ. In particular, the Mitaka models allow for mergers between satellite galaxies while the Durham models do not (see Cole et al. and Nagashima et al. for more discussion). The models differ significantly in the faint end slope of the luinosity function that is predicted, but the overall comparison with the observational data leads to similar conclusions, as we show below.
Both models predict rapid evolution in the position of the knee of the luminsoity function, even though the clusters have been selected in a way that mimics the observational data. However, the normalisation of the mass function is free because the absolute numbers of galaxies in each system depends on the total halo mass. Unfortunately we are not able to accurately constrain the total halo mass and thus cannot derive an independent normalisation. We have therefore normalised the stellar mass functions so that all the curves have the same amplitude at 21010M⊙. As a result of this normalisation we concentrate only on the shapes of the stellar mass functions. As can be seen from Figs. 8 (dashed line), the Cole et al. (2000) and the Nagashima et al. (2002) models seem to predict a much steeper mass function than is observed, and thus under-predicts the numbers of massive galaxies in distant clusters.
| cluster () | (giant/dwarf) |
|---|---|
| 2MASS/LCRS clusters () | 0.13 |
| This work () | 0.350.12 |
| This work () with bluecut | 0.320.11 |
| Durham model () | 0.18 |
| Durham model () | 0.07 |
| Mitaka model () | 0.21 |
| Mitaka model () | 0.070.05 |
To quanify the comparison between the models and data in a way that is independent of the normalisation, we define the giant-to-dwarf ratio, (giant/dwarf), as
| (1) |
The ratios are calculated from data shown in Figs. 8, and are summarised in Table 2. This shows that the fraction of giant galaxies at in the semi-analytic predictions is factor 3 smaller than the observed value. The scatter of the ratio in the Tokyo model measured from the 100 generated clusters (0.05) is too small to account for the over-abundance of the massive galaxies in the real high redshift clusters.
How much mass evolution can be allowed between and the present-day within the errors of our analysis? To answer this question, we shift the local mass function of 2MASS/LCRS clusters (Balogh et al. 2001) towards lower masses and calculate the statistical deviation from the observed mass function at by a boot-strap resampling method (ie., randomly replacing the observed points assuming the Gaussian errors on each point). From this analysis, we find that we can reject a mass decrease of a factor of 2 at 99% level (2.5) no matter whether the bright blue galaxies are included or excluded. Since the definition of bright blue cut that we introduced in §4.2 is somewhat arbitrary, we consider the effect of further reducing the numbers of galaxies in the brightest bin, moving it two sigma down from its original place. Even in this extreme case, the giant-to-dwarf ratio is 0.27 and is still 2.3 off from the factor 2 evolution in mass, corresponding to 98% rejection level.
4.4 Less massive galaxies
In contrast to the bright cluster galaxies, faint galaxies seem to have a much greater diversity of formation histories. The faint galaxies may be in general formed at later cosmic times than the massive galaxies, although this appears to be opposite to the hierarchical picture. If so, then distant clusters should have a LF that has a declining faint-end slope in contrast to the rising faint-end slope of local clusters (Balogh et al. 2001; De Propris et al. 1998). The progression of formation activity to lower-mass galaxies as the Universe ages is often referred to as the “down-sizing” effect (Cowie et al. 1996; Kodama & Bower 2001). Kajisawa et al. (2000) suggested just such a deficit of faint galaxies (, or +1.5) in the 3C324 cluster at .
In our two clusters, however, such a strong deficit is not confirmed down to (+2.7) (Fig. 6). A marginal discrepancy (2) between and 1 is seen in the least massive bin of the stellar mass functions (the solid lines and our data points in Figs. 8). However, given the fact that the faint-end slope of the local mass function of cluster galaxies (2MASS/LCRS; Balogh et al. 2001) is only poorly determined ( (1)), we cannot discuss further whether there is an evolution between and 1 in the faint end of the mass function from the current data set. To test the hypothesis of different formation epoch depending on galaxy mass, our data would need to go deeper than . However, we certainly see significant numbers of less massive galaxies below 1.51010M⊙, which are nearly absent in Kajisawa et al. (2000). We speculate that the reason why they saw such a deficit of less massive galaxies is their limited field coverage (cluster-centric distance 40′′ or 0.33 Mpc).
One might be concerned that our high giant-to-dwarf ratio at clusters and hence the relatively strong constraint on the mass growth rate, is partly driven by the deficiency of the less massive galaxies at as well as the abundance of massive galaxies. We verify this effect on our conclusions by artificially increasing the numbers of galaxies in the least massive bin at by 2, and by flattening the faint end slope of the curve (2MASS/LCRS) by . However, these effects on the constraint on the mass growth factor is found to be small. For example, in the first case, the giant-to-dwarf ratio goes down to =0.26 and 0.24 with and without the bright blue galaxies, respectively, but the mass evolution of factor 2 between and 0 (which gives =0.07) is still rejected at 98% level (2.3).
5 Discussion
It is now generally accepted that the stellar populations of galaxies in clusters are old with little on-going star formation based on the colours and the fundamental planes studies (eg., Bower et al., 1992; 1998; Ellis et al. 1997; van Dokkum et al. 1998; Stanford et al. 1998; Kodama et al. 1998; Kelson et al. 2000). However, the stellar populations of galaxies may be old, but at the same time the galaxies may not have been completely assembled. Between and the present-day, galaxies might grow in mass through collisions. This key issue can only be tested by comparing the luminosity functions of galaxies in clusters at different redshifts.
Early assembly of massive galaxies is a challenge for hierarchical models of galaxy formation since these models tend to grow galaxies through both on-going merging and gas accretion up to the present-day. The first generation of such models predicted very rapid galaxy growth (Kauffmann & Charlot 1998). More recent models within a -CDM universe and revised merging prescriptions (eg., Cole et al., 2000) have predicted evolution that is slower but still significant — see Cimatti et al. (2002) for a recent discussion and comparision with field data.
In clusters of galaxies, we might anticipate that the rate of evolution of galaxy mass is less than in the field since rich clusters are over dense regions of the universe in which gravitational collapse has been accelerated. Thus an important issue that has concerned us is that clusters which are observed at are not directly equivalent to the progenitors of clusters in the local universe (ie., while the galaxies in the distant clusters form part of the local cluster population, there are many galaxies in local clusters which were located in lower density environments at ). Care is therefore need to select galaxies from the semi-analytic models, and we have tried to select clusters in the same way in both the semi-analytic models and the data. We applied two different ways of selecting the systems in the models — by mass and by space density — but both definitions give similar results and predict a significant reduction in the characteristic stellar mass of cluster galaxies with redshift.
In contrast to the model, however, our observations of two distant clusters show that the evolution of the luminosity function is well modelled by passive evolution of the galaxy population. The -band luminosity function is slightly brighter at than at . However, when we correct the observed galaxy luminosities for the passive evolution of the stellar population, and cosmological dimming, we find that the galaxy mass function has evolved little over this time. A factor of 2 evolution is only marginally consistent with the data (2.5).
However, this level of uncertainty means that our data cannot yet completely rule out the heirarchical model. If we could fix the mass function normalisation using the total (ie., dark plus stellar mass) of the clusters the evolution in galaxy mass predicted by the theoretical models would be much clearer. Unfortunately the clusters we have studied have no reliable mass estimates that we can use to independently secure the LF normalisation (the only measure available is a velocity dispersion of 397 km s-1 for the 3C336 cluster, measured from eight cluster members: Steidel et al. 1997). This is an important area for future work.
There is no significant difference in the stellar mass function between the 3c336 and Q1335 clusters (). The cluster to cluster scatter in the theoretical models is also small ( (giant/dwarf)=0.05). In an individual cluster, the measured luminosity function is dependent on the background subtraction. However, even if we artificially change the background level by a factor 2, the resulting change in the giant/dwarf ratio is found to be less than 0.1. It therefore seems that our conclusion is not significantly affected by the field-to-field variation of the background.
Finally, there are uncertainties in the theoretical model predictions. For this reason it has been useful to check that we obtain similar results for both the Durham and Mitaka models. In addition, the simulations allow us to check that cluster to cluster variation is not significant. A concern when comparing theoretical and observational results is the radius over which the comparison is made. The wide field of our observations (1 Mpc) means that they include a large fraction of the cluster virial radius, and are thus directly comparable to the observational results. It is interesting to note that the discrepancy between our results and the deficit of faint (+1.5) galaxies by Kajisawa et al. (2000), might result from this type of mass segregation.
6 Conclusions
We have presented the near-infrared LF of galaxies in the two high confidence cluster candidates based on deep wide-field imaging. A third cluster was observed, but has then been excluded because of contamination by a foreground system. We find that the -band LF at is consistent with pure luminosity evolution with constant stellar mass according to the passive evolution with old age (), if compared to the lower redshift counterparts, such as 2MASS/LCRS LF for local clusters. We have transformed our LF at to a stellar mass function by correcting for the star formation contribution to the -band light as estimated from the colours. The derived stellar mass function is found to be very similar to the one for the 2MASS/LCRS local clusters. In particular, massive galaxies (M⊙) make up a significant fraction of the galaxy population. This result presents a challenge for current hierarchical galaxy formation models which tend to under-predict the fraction of massive galaxies compared to our observed data.
The next steps are threefold. One is to increase the sample of clusters at similar redshift () and to have better statistics on the derived stellar mass function at this epoch. The second is to extend this analysis to higher redshift () to identify the epoch at which the massive galaxies are assembled. The third is to extend this analysis along an environmental axis. Galaxy-galaxy mergers are likely to be most effective in the group environment rather than the cluster cores where velocity dispersion is too high (Binney & Tremaine 1987). Therefore, it may be the case that the mass growth can be clearly seen at lower redshifts in these lower density regions.
Acknowledgements
We are grateful to Dr. Masa Nagashima, Carlton Baugh, and Sarah Reed for providing us with the model predictions for stellar mass functions of galaxies from their semi-analytic models of galaxy formation, and also for useful discussion about the comparison with the observed data. We acknowledge to the referee, Dr. Aragón-Salamanca, for his useful comments which have improved the clarity of the paper. We thank Ian Smail for providing us with scripts for efficient observation with INGRID and data reduction in IRAF. TK thanks the Japan Society for the Promotion of Science for support through its Research Fellowships for Young Scientists between 1999-2001 during which these INGRID data were taken. RGB thanks PPARC and the Leverhulme Trust for their support. We also acknowledge the Daiwa-Adrian Prize 2001 given by The Daiwa Anglo-Japanese Foundation.
References
- [] Andreon, S., 2002, A&A, 382, 821
- [] Aragón-Salamanca, A., Baugh, C. M., Kauffmann, G., 1998, MNRAS, 297, 427
- [] Balogh, M. L., Christlein, D., Zabludoff, A. I., Zarisky, D., 2001, ApJ, 557, 117
- [] Barger, A. J., et al., 1998, ApJ, 501, 522
- [] Barger, A. J., Aragón-Salamanca, A., Ellis, R. S., Couch, W. J., Smail, I., Sharples, R. M., 1996, MNRAS, 279, 1
- [] Baugh, C. M., Benson, A. J., Cole, S., Frenk, C. S., Lacey, C., astro-ph/0203051
- [] Bertin, E., Arnouts, S., 1996, A&AS, 117, 393
- [] Bessell, M. S., Brett, J. M., 1988, AJ, 100, 1134
- [] Best, P. N., 2000, MNRAS, 317, 720
- [] Binney, J., Tremaine, S., 1987, in Galactic Dynamics, Princeton University Press
- [] Bower, R. G., Kodama, T., Terlevich, A., 1998, MNRAS, 299, 1193
- [] Bower, R, G., Smail, I, 1997, MNRAS, 290, 292
- [] Brinchmann, J., Ellis, R. S., 2000, ApJ, 536, L77
- [] Calzetti, D., Armus, L., Bohlin, R. C., Kinney, A. L., Koornneef, J., Storchi-Bergmann, T., 2000, ApJ, 533, 682
- [] Casali, M. M., Hawarden, T. G., 1992, JCMT-UKIRT Newsl. No.4, 33
- [] Cimatti, A. et al., 2002, A&A, 392, 395
- [] Cole, S., Lacey, C. G., Baugh, C. M., Frenk, C. S., 2000, MNRAS, 319, 168
- [] Cowie, L. L., Songaila, A., Hu, E. M., Cohen, J. G., 1996, AJ, 112, 839
- [] De Propris, R., Eisenhardt, P. R., Stanford, S. A., Dickinson, 1998, ApJ, 503, L45
- [] De Propris, R., Stanford, S. A., Eisenhardt, P. R., Dickinson, M., Elston, R., 1999, ApJ, 118, 719
- [] de Zeeuw, P. T. et al, 2002, MNRAS, 329, 513
- [] Dressler, A., Smail, I., Poggianti, B. M., Butcher, H., Couch, W. J., Ellis, R. S., Oemler, A. J, 1999, ApJS, 122, 51
- [] Drory, N., et al., 2001, ApJ, 562, L111
- [] Hawarden, T. G., Leggett, S. K., Letawsky, M. B., Ballantyne, D. R., Casali, M. M., 2001, MNRAS, 325, 563
- [] Huchings, J. B., Crampton, D., Johnson, A., 1995, AJ, 109, 73
- [] Kajisawa, M., et al., 2000, PASJ, 52, 53
- [] Kauffmann, G., 1996, MNRAS, 281, 487
- [] Kauffmann, G., Charlot, C., 1998, MNRAS, 297, 23
- [] Kelson, D. D., Illingworth, G. D., van Dokkum, P. G., Franx, M., 2000, ApJ, 531, 184
- [] Kennicutt, R. C., Jr., 1983, ApJ, 272, 54
- [] Kodama, T., Arimoto, N., 1997, A&A, 320, 41
- [] Kodama, T., Arimoto, N., Barger, A. J., Aragón-Salamanca, A., 1998, A&A, 334, 99
- [] Kodama, T., Bower, R. G., 2001, MNRAS, 321, 18
- [] Le Fèvre, et al., 2000, MNRAS, 311, 565
- [] Nakata F., Kajisawa, M., Yamada, T., Kodama, T., Shimasaku, K., Tanaka, I., 2001, PASJ, 53, 1139
- [] Nagashima, M., Yoshii, Y., Totani, T., Gouda, N., 2002, ApJ, in press
- [] Saracco, P., D’Odorico, S., Moorwood, A., Buzzoni, A., Cuby, J.-G., Lidman, C., 1999, A&A, 349, 751
- [] Saracco, P., Giallongo, E., Cristiani, S., D’Odorico, S., Fontana, A., Iovino, A., Poli, F., Vanzella, E., 2001, A&A, 375, 1
- [] Steidel, C. C., Dickinson, M., Meyer, D. M., Adelberger, K. L., Sembach, K. R., 1997, ApJ, 480, 568
- [] Tanaka, I., Yamada, T., Aragón-Salamanca, A., Kodama. T., Miyaji, T., Ohta, K., Arimoto, N. 2000, ApJ, 528, 123
- [] van Dokkum, P. G., Franx, M., Fabricant, D., Kelson, D. D., Illingworth, G. D., 1999, ApJ, 520, L95
- [] van Dokkum, P. G., Stanford, S. A., 2002, ApJ, accepted, astro-ph/0210643
- [] Yamada, T., Tanaka, I., Aragón-Salamanca, A., Kodama, T., Ohta, K., Arimoto, N., 1997, ApJ, 487, L125
- [] Yamada, T., et al., 2002, ApJ, in press
- [] Yee, H. K. C., Ellingson, E., Carlberg, R. G., 1996, ApJS, 102, 269