Diffuse X-ray emission in spiral galaxies
Abstract
We compare the soft diffuse X-ray emission from Chandra images of 12 nearby intermediate inclination spiral galaxies to the morphology seen in H, molecular gas, and mid-infrared emission. We find that diffuse X-ray emission is often located along spiral arms in the outer parts of spiral galaxies but tends to be distributed in a rounder morphology in the center. The X-ray morphology in the spiral arms matches that seen in the mid-infrared or H and so implies that the X-ray emission is associated with recent active star formation.
In the spiral arms there is a good correlation between the level of diffuse X-ray emission and that in the mid-infrared in different regions. The correlation between X-ray and mid-IR flux in the galaxy centers is less strong. We also find that the central X-ray emission tends to be more luminous in galaxies with brighter bulges, suggesting that more than one process is contributing to the level of central diffuse X-ray emission.
We see no strong evidence for X-ray emission trailing the location of high mass star formation in spiral arms. However, population synthesis models predict a high mechanical energy output rate from supernovae for a time period that is about 10 times longer than the lifetime of massive ionizing stars, conflicting with the narrow appearance of the arms in X-rays. The fraction of supernova energy that goes into heating the ISM must depend on environment and is probably higher near sites of active star formation. The X-ray estimated emission measures suggest that the volume filling factors and scale heights are high in the galaxy centers but low in the outer parts of these galaxies.
The differences between the X-ray properties and morphology in the centers and outer parts of these galaxies suggest that galactic fountains operate in outer galaxy disks but that winds are primarily driven from galaxy centers.
1 Introduction
Results from both Einstein and ROSAT have shown that spiral galaxies emit soft X-rays ( keV) with luminosities of erg s-1 (Fabbiano et al., 1992; Read et al., 1997; Cui et al., 1996). Before the launch of Chandra, the study of the diffuse X-ray emission from spiral galaxies was seriously impeded by lack of spatial resolution. Point sources could not be well separated from the diffuse thermal gas, making it difficult to compare the morphology of the X-ray emission to that in other bands. Study of the morphology of diffuse emission from the disks of spiral galaxies was therefore possible only for some nearby galaxies (e.g., M101, Snowden & Pietsch 1995; M51 Ehle et al. 1995, NGC 891 Bregman & Houck 1997).
The spatial resolution of Chandra not only allows separation between diffuse emission and point sources, but also allows a more precise morphological study of the diffuse emission. Among normal galaxies, recent Chandra imaging has shown that the diffuse emission can have different types of morphology: X-ray emitting gas above the plane of the galaxy that has been interpreted to be caused by winds escaping the galaxy due to mechanical energy output from massive stars and supernovae (e.g., Strickland et al. 2003b; Wang et al. 2001); coronal X-ray emitting gas associated with galactic fountains (e.g., Fraternali et al. 2002 in NGC 2403; Kuntz et al. 2003 in M101). The diffuse hot gas is due to thermal emission from a fairly cool keV () component (Read et al., 1997; Strickland et al., 2003a).
The gas detected in X-rays is suspected to be associated with supernovae and winds from young massive stars. Since supernovae generate metals, the transport of this hot gas is key toward understanding the metallicity evolution of galaxies (e.g., Edmunds 1990). Superwinds are of cosmological interest as they can transport large amounts of gas, in particular newly synthesized heavy elements, and energy into the intergalactic medium (IGM). However, if this gas cannot escape from the disk into the halo region, it will fall down onto the disk. In a galactic fountain model, the hot gas escaping from the disk cools quickly because of adiabatic expansion. Anomalous high velocity HI clouds are suspected to represent such an infalling phase of the galactic fountain, whereas the hot X-ray emitting gas would pertain to the initial outgoing phase of it (Bregman, 1980; de Avillez, 2000; Norman & Ikeuchi, 1989). When the star formation rate is sufficiently high, largescale energetic outflows are predicted (Chevalier & Clegg, 1985; Heckman et al., 1990). These “superwinds” may account account for the X-ray emission seen well above the planes of edge-on starburst galaxies and are potentially capable of enriching and heating the IGM (e.g., Martin et al. 2002).
The morphology and quantity of the hot X-ray emitting gas is therefore related to the general problem of understanding the scales (spatial and temporal) over which metal enrichment takes place in spiral galaxies. X-ray emission associated with spiral structure should trace local relatively short timescale galactic fountain type of metallicity enrichment due to the movement of the spiral density wave, whereas larger scale superwinds are more likely to be relevant to the enrichment of the IGM.
Many Chandra observing programs have focused their studies on individual galaxies, or on the populations of unresolved sources in these galaxies. Only in the last year have sufficient number of deep Chandra images of galaxies become available, enabling us to carry out a comparative study of the diffuse components. The recent study of Strickland et al. (2003a, b) focuses on edge-on galaxies. Here we carry out a complimentary study by focusing on low or intermediate inclination galaxies. These galaxies allow us to compare the X-ray morphology to the distribution of stellar components (bulge and spiral arms) and sites of active star formation.
In §2 we describe the sample of galaxies and our procedure for producing images that highlight the diffuse component. We also describe comparison data used to probe for correlations between galactic components. In §3 we compare X-ray fluxes and morphology to those observed at other wavelengths. A summary and discussion follows in §4.
2 Observations
2.1 The Sample
We searched the Chandra X-ray archive for intermediate or low inclination nearby galaxies, observed in imaging modes with ACIS-S at exposure times that are longer than 20 ks. Shorter exposures are not capable of detecting sufficient numbers of photons from a diffuse component to enable a good study of its morphology. We found 12 galaxies that met our criteria; they are listed in Table 1 along with additional descriptive information. NGC 1068 and NGC 4258 were omitted from the sample because of their bright Seyfert nuclei.
2.2 Diffuse X-ray emission maps
Reduction of Chandra ACIS-S images was done with CIAO2.3. Light curves were constructed from the entire S3 chip to allow detection and removal of background flares. Because the diffuse emission component is soft we removed photons with estimated energies greater than 1.5keV. This high energy cut increased our ability to detect the diffuse component against hard background events, which were possibly from low-level flares that were not detected from the lightcurves. To ensure that we were justified in making such an energy cut, we made color maps of all galaxies with respect to the estimated photon energy. The color maps were split into red (0.3 to 1.5 keV), green (1.5 to 2.5 keV), and blue (2.5 to 8.0 keV). The background contained points of all three colors, while the diffuse X-ray emission from the galaxies was mostly red, confirming that it is soft.
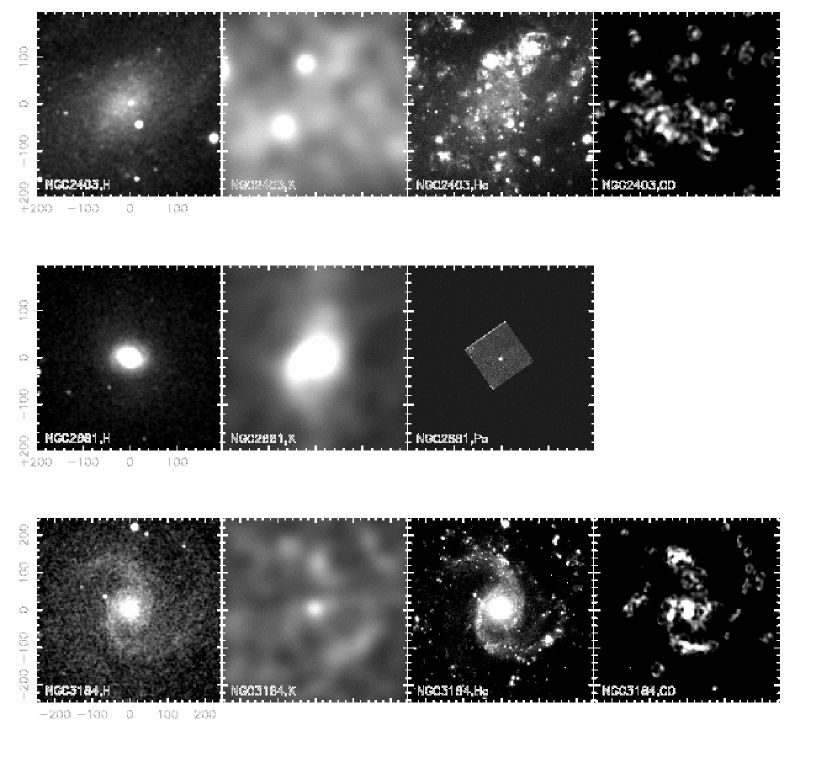
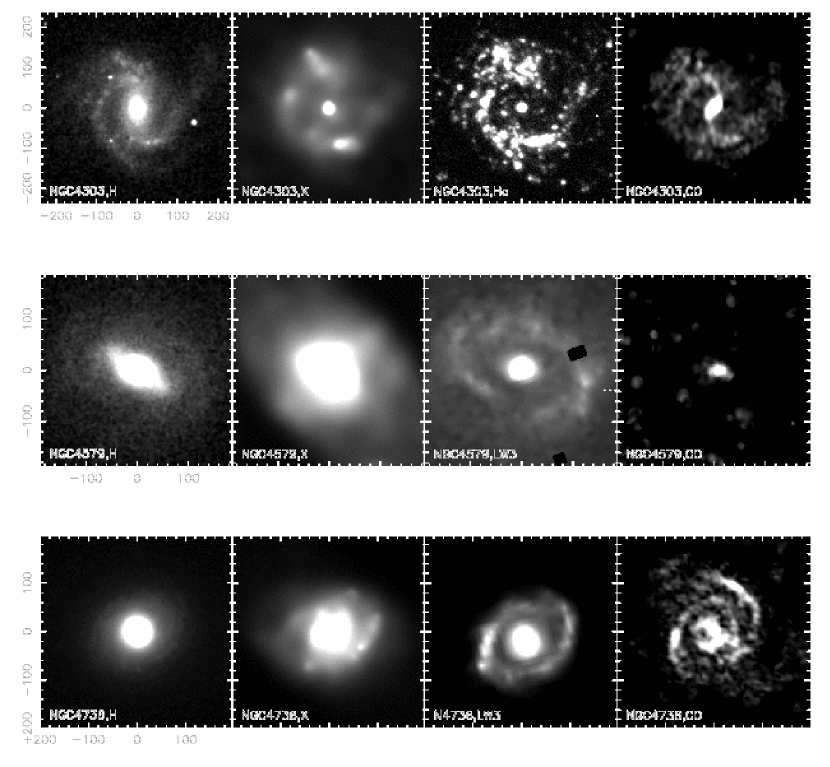
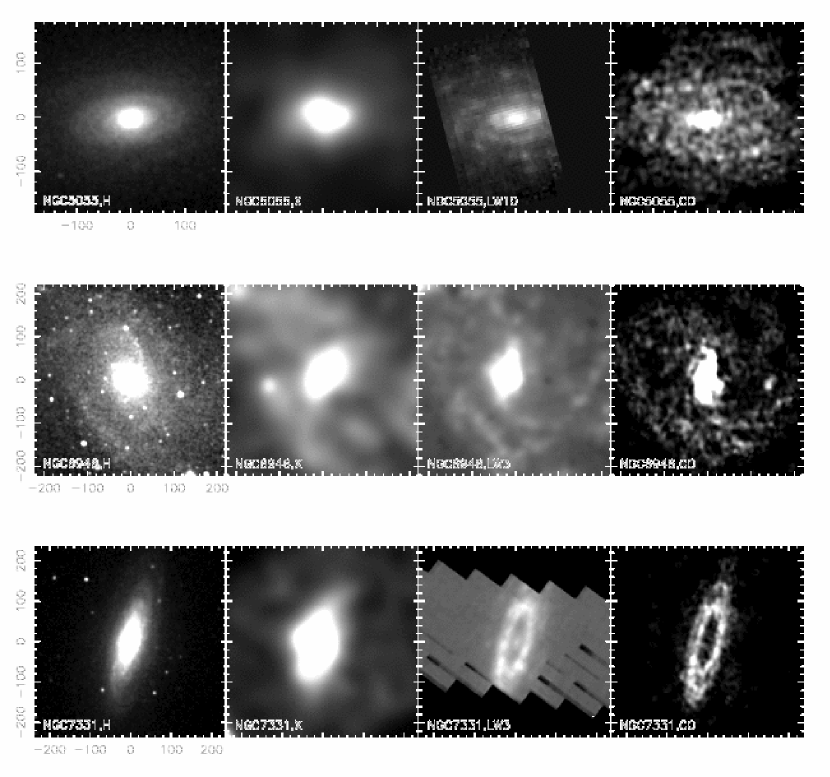
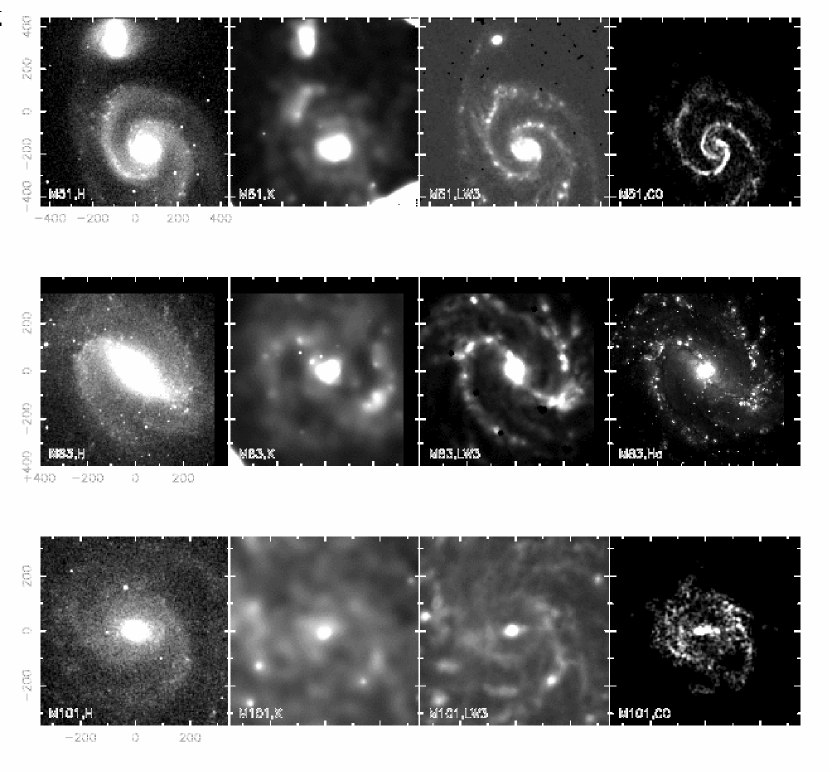
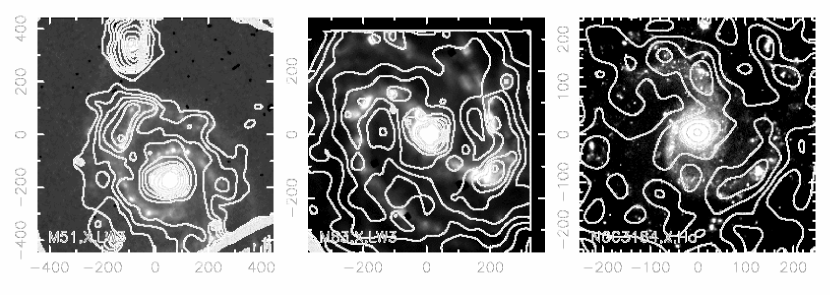
Point sources were identified from the Chandra event files by masking elliptical areas around each source. Each region was identified by the CIAO routine wavdetect and was then visually inspected to enlarge, if necessary, the masking area or to determine if diffuse emission had been misidentified as point sources, especially in crowded regions. Pixels inside the ellipses were filled in based on local background values using the CIAO routine dmfilth. We used the DIST method to fill in the background because the count rates were not sufficiently high to use the POISSON method. After point sources were removed we smoothed the images using the adaptive routine csmooth with a maximum smoothing length of 20 pixels. Images were corrected for the exposure time and effective telescope area using the CIAO routine mergeall to build the final fluxed images which are shown in Figure 1. The smoothed images shown in Figure 1 were used for morphological comparisons. However, to measure fluxes from particular regions, we used the unsmoothed images.
2.3 Comparison images
To identify what processes are affecting the distribution of X-ray gas we searched for images of our sample galaxies at other wavelengths. Many of these galaxies were also observed in CO(1-0) tracing the molecular gas component as part of the BIMA-SONG survey (Helfer et al., 2003). We also downloaded near-infrared H-band images tracing the stellar component from the 2 Micron All Sky Survey (2MASS). We searched NED for narrow band images of the H emission line and mid-infrared images at 12 or 15m from the Infrared Space Observatory (ISO) that provide tracers of recent star formation.
For NGC 2403, NGC 3184, NGC 6946 and M83 we use H images by Larsen & Richtler (1999); for NGC 4579 and NGC 4303 those by Koopman et al. (2001); for NGC 4736, NGC 5055, and M101 those by Wong & Blitz (2002). Mid-infrared at 12 or 15 images observed by the instrument ISOCAM are those made available on the NASA extragalactic database (NED) by Roussel et al. (2001); Bendo et al. (2002). For NGC 7331 we downloaded the 15 discussed by (Smith, 1998) from the ISO archive. The comparison images are shown in Figure 1 with the X-ray images of the diffuse emission in each galaxy.
3 Results
3.1 The morphology of the diffuse X-ray emission
In comparing the diffuse X-ray images with the images of other wavelengths, we see that the H and mid-infrared emission are coincident each other and with the diffuse X-ray images (see M83 for example). The mid-infrared emission is comprised of both continuum and PAH components and scales with the rate of star formation (Roussel et al., 2001; Bendo et al., 2002), as would be expected by dust reprocessing the interstellar radiation field. The images showing the molecular gas (CO) distribution, from which the stars are formed, also tend to be coincident with the diffuse X-ray, though not as closely as the H and mid-IR images.
The correlation between the diffuse X-ray morphology and that seen in H is consistent with previous studies (e.g., Strickland et al. 2003a; Fraternali et al. 2002). However, most previous studies have focused on individual H II regions, or filaments associated with coronal emission and outflows in edge-on galaxies (e.g., Fraternali et al. 2002; Strickland et al. 2003a; Wang et al. 2001). Because we have focused on spiral galaxies that are not at high inclination (except for NGC 7331), we are better able to view the changes in morphology across the disks of the galaxies. We find a clear correspondence between the morphology of the diffuse X-ray emission and the specific locations of active sites of star formation.
Except for NGC 2403, which is irregular, all the galaxies in our sample emit diffuse X-rays from their centers. Galaxies NGC 3184, NGC 4303, NGC 4736, M51, M83, and M101 show spiral structure in the diffuse X-ray emission, coinciding with star formation in the spiral arms, as traced in either H or in the mid-infrared ISOCAM images. The emission from the galaxy centers is almost round, whereas that from the spiral arms is located in linear features lying along the arms. Because we see a difference in X-ray morphology between the spiral arms and the galaxy centers, we compare the two type of regions separately.
3.2 The diffuse X-ray emission in the spiral arms
Most but not all of the spiral galaxies display X-ray emission along spiral arms. Galaxies NGC 3184, NGC 4303, NGC 4736, M51, M83, and M101 show prominent spiral structure in the diffuse X-ray emission, coinciding with star formation in the spiral arms, as traced by H or mid-infrared emission. NGC 4303, NGC 4736, and M101 show weaker spiral structure whereas that in in M51, M83, and NGC 3184 is particularly strong and open (not tightly wound). Little diffuse X-ray gas was detected in the outer regions of NGC 6946; however, NGC 6946 has a high Galactic absorption column, which may have affected our ability to detect the soft diffuse X-ray emission. NGC 6946 also has a low star formation rate in its outer disk compared to the other grand design galaxies in our sample.
Previous studies have shown that the soft X-ray luminosity of entire spiral galaxies is proportional to the total infrared luminosity (Read & Ponman, 2001; Strickland et al., 2003b), a direct indicator of the current star formation rate (Kennicutt, 1998). Because we can observe the spatial distribution of both the diffuse X-ray emission and the current sites of star formation, we can compare the X-ray and mid-IR fluxes measured at different regions in each galaxy. Because longer-wavelength infrared data lacks sufficient spatial resolution, we opt to use the mid-infrared ISO images. However, the total far-infrared bolometric flux used in previous studies can be estimated from the mid-infrared flux and is about 14 times the mid-infrared flux at (estimated as ) (Spinoglio et al., 1995). We have opted to use the mid-infrared ISOCAM images as a tracer of recent star formation rather than the H images because they were observed in a similar fashion with the same camera on the same telescope and so are more uniform in their calibration than the available H images. The mid-IR images also have the advantage that they do not require correction for extinction.
In Figure 5 we plot X-ray and mid-infrared fluxes measured in radius apertures at different locations along the spiral arms of these galaxies. Good quality spectra could not be extracted from the outer parts of these galaxies because of the low count rates, so we could not determine conversions between fluxes and count rates based on individual fitted emission models. Consequently we fit spectra extracted from the brighter (central) components of a few galaxies and used the resulting model to convert between counts and flux for other regions. To convert between counts cm and unabsorbed 0.1-2.0 keV flux, we used a XSPEC MEKAL model with keV and an abundance of solar, which provided a reasonable fit to spectra extracted from the brighter central components of M51, M83, NGC 5055, NGC 4736 and NGC 7331. When Chandra spectra of diffuse emission in nearby galaxies are fit with single component hot plasma models, they have been better fit by those with extremely low abundances. This problem has been discussed by Strickland et al. (2000); Wang et al. (2001) and others. Here we do not attach any undue significance to the parameters of these fits, but use them to derive conversion factors which we use to estimate physical quantities. We have noted that the conversion factors are insensitive to the value of the abundance used.
Background subtracted fluxes were corrected for Galactic absorption based on Galactic H I column depth in the direction of each galaxy but not for absorption internal to each galaxy. The data points used in Figure 5 are listed in Table 2.
From Figure 5 we see that the X-ray flux in different regions along the spiral arms of these galaxies is correlated with that in the mid-infrared. We find that the correlation between X-ray emission and star formation previously seen on whole galaxy scales also exists on smaller scales along individual spiral arms. NGC 4579 is the only galaxy with a significantly higher X-ray to infrared flux ratio, which is probably due to its AGN (discussed recently by Eracleous et al. 2002). Activity from the AGN has probably increased the quantity of diffuse X-ray emission at distances 3 to 7 kpc from the nucleus. Because of this large distance from the nucleus, we infer that the X-ray gas must have been heated mechanically rather than radiatively. Since the surface brightness of the diffuse X-ray emission is much lower than that seen in the Seyfert galaxies NGC 1068 and NGC 4258, we support the conclusions of Young et al. (2001) who found that the starburst is not the dominant source of soft extended X-ray emission in Seyfert galaxies.
In the spiral arms of the other galaxies, the flux of X-ray emission is about 4 orders of magnitude lower than the mid-infrared emission. Using the mid-infrared fluxes to estimate the total infrared bolometric fluxes, we estimate that the X-ray fluxes are 5 orders of magnitude below that comprising the bolometric far-infrared fluxes. This is one order of magnitude below the correlation found by Read & Ponman (2001); Strickland et al. (2003b). Part of the discrepancy between our estimated X-ray to infrared ratio and previous work could be due the temperature we assumed to convert between counts and flux. Alternately, the soft X-ray to infrared flux ratio could also be slightly dependent upon luminosity.
3.3 Nuclear diffuse X-ray emission
Except for NGC 2403, which is irregular, all the galaxies in our sample emit diffuse X-rays from their centers. With the exception of NGC 7331, the nuclei of these galaxies are also sites of star formation. NGC 7331 has a star forming region ring at about 8 kpc from its nucleus and little star formation within this ring. However the X-ray emission peaks at the galaxy nucleus and not at the location of the molecular ring. In NGC 7331, the X-ray emission could be associated with the bulge of the galaxy, the star forming ring or its faint Seyfert 2 nucleus. The bulge in the X-ray emission map north east of the nucleus which resembles cones seen in other edge-on galaxies (e.g., Strickland et al. 2003a), suggests that some of the X-ray emitting gas was heated in the galaxy center, by the AGN or a past episode of star formation.
We can consider three possible dominant energy sources resulting in the presence of hot X-ray emitting gas in the centers of these galaxies: supernovae associated with an old bulge population, superwinds driven by active star formation, and an active galactic nucleus. Since the X-ray emission is not closely associated with individual spiral arms in the centers of these galaxies, and the morphologies are nearly round, a galactic fountain type scenario is unlikely. To discriminate between the possible energy sources, in Figure 6 we plot diffuse X-ray fluxes compared to those in the same apertures at H-band (based on the 2MASS images), in CO (based on the BIMA-SONG data) and at 12 or 15m (based on the ISOCAM images). Apertures were adjusted to include the entire central diffuse X-ray component and have radii which range from 10 to . The 0.1-2.0keV unabsorbed X-ray fluxes have been measured in the same way as those along the spiral arms (see previous subsection) and are listed in Table 3.
If supernovae associated with older stars were responsible for the X-ray emission in the nuclear regions of these galaxies then we would expect a correlation between the nuclear X-ray flux and that at 1.6 m in H-band, tracing the old stellar population. To test this possibility we show in Figure 6a a comparison between the nuclear X-ray fluxes and the H-band magnitude measured from the 2MASS images in the same regions. The X-ray fluxes range over 4 orders of magnitude while the H-band fluxes range over 2 orders of magnitude. The range of these numbers is not strongly affected by the scatter in distances since the nearest galaxy in our sample is only 3 times nearer than the farthest one. We find a correlation between the two fluxes, suggesting that an old stellar population may be associated with the diffuse X-ray emission. Either supernovae from an old stellar population contribute to the X-ray emitting gas or the mass of the bulge provides a gravitational potential well that keeps the X-ray gas from escaping the galaxy.
ROSAT studies of early type galaxies confirmed the correlation between optical and X-ray luminosity previously revealed by Einstein studies (Brown & Bregman 1998), finding that the X-ray luminosity was about 4-5 orders of magnitude fainter than the optical luminosity. The points in Figure 6a are consistent with this, suggesting that the diffuse emission in bulges could be an extension of that seen in early type galaxies.
Figure 6b shows the X-ray and mid-infrared fluxes from the galaxy cores in the same apertures as for 6a. We see a larger scatter in the X-ray and mid-infrared fluxes in the cores than in the spiral arms. Most of the galaxies are consistent with the average mid-infrared to X-ray flux ratio seen in the spiral arms (see Figure 5); however, there are some outlying points. NGC 4579, again, has a higher X-ray to emitted infrared flux ratio, which is very likely due to the proximity of the AGN. NGC 6946 has an X-ray/infrared flux ratio of , two orders of magnitude below the mean seen in the spiral arms. NGC 6946’s low level of diffuse central X-ray emission is either due to its small bulge, or because it had been quiescent until recently. Prior star-forming activity could affect the total quantity of diffuse nuclear X-ray emission.
Since we see that the diffuse X-ray flux correlates with the infrared flux (and so the star formation rate), it should also be correlated with the quantity of molecular gas. Figure 6b shows X-ray and CO fluxes for the galaxy cores, using the same apertures. The CO fluxes were calculated using CO images from the BIMA-SONG survey and are also listed in Table 3. The fluxes are similarly scattered as in a), forming a weak correlation with two outlying points, again corresponding to NGC 6946 (upper left) and NGC 4579 (lower right). Two of the galaxies in our sample were not included in the BIMA-SONG survey, and as such, are not included in this graph: M83 and NGC 2681.
To test the dependence of diffuse X-ray emission on supernovae from older stars and starburst activity, we plotted the ratio of mid-infrared to 1.6m flux vs. the ratio of X-ray to 1.6 flux (Figure 6d). The lack correlation shown in the plot suggests that current star formation is not the only factor affecting the quantity of diffuse X-ray flux. Unfortunately many of the high points in Figure 6d are also high in Figures 6a,b implying that the galaxies with brighter X-ray nuclear components have bigger bulges and also higher levels of active star formation near their centers. This makes it difficult to discriminate between scenarios for producing the X-ray gas. We checked the nuclear spectral classification (listed in Table 1) of the galaxies in this plot and found no obvious correspondence between nuclear type and X-ray/infrared color.
In short we find weak correlations between central diffuse X-ray flux and bulge brightness and between the X-ray flux and the current rate of star formation. The correlation between the X-ray flux and mid-IR flux is weaker than seen in the spiral arms, suggesting that other factors are affecting the X-ray luminosity. These other factors could include the depth of the bulge potential, supernovae from bulge stars, AGN activity and previous episodes of star formation.
3.4 Constraints on the volume filling factor, electron density and cooling time of the X-ray emitting gas
As we mentioned above, we used the Sherpa analysis program to fit single component hot plasma MEKAL models to spectra extracted from the brighter galaxy nuclei. The MEKAL normalization, , required to fit these spectra, can be used to place constraints on the emission integral of the X-ray emitting gas and consequently on its volume filling factor, , and electron density . The electron density can be estimated from the normalization factor
| (1) |
by assuming that the emission integral . Here is the aperture area in square arcseconds where we measured the count rate. We have scaled the above expressions assuming a typical scale height kpc corresponding to for a nearby galaxy at a distance of 10 Mpc. This size scale would be appropriate for the central components of our galaxies if the central X-ray emission filled a spherical volume.
Estimated electron densities in the nuclear regions range from in the center of M101 to (same scaling) in the center of M83. The irregular galaxy NGC 2403 has a somewhat lower cm-3 and NGC 4579 which contains a bright AGN is higher with cm-3.
Given an estimated electron density and our assumed temperature we can estimate a radiative cooling time for the hot gas, where is in cm-3. This results in a cooling time of yr for the gas near the center of NGC 4579 and yr for NGC 2403 and M101. These times are quite short, and would be shorter if the filling factor or scale heights were lower. This suggests that the X-ray emission from the brighter galaxy centers has a fairly high volume filling factor and a large scale height, not inconsistent with previous studies of edge-on galaxies (Strickland et al., 2003a).
Following the same procedures as we previously used for the nuclear regions, we can estimate the electron density and cooling time for the diffuse X-ray emission in the spiral arms. The count rates in the arms using 20′′ apertures average around 10-6 cnts cm-2s-1, corresponding to an average electron density , and an associated cooling time of yr .
The electron densities in the spiral arms are naturally lower than those in the galaxy centers. However, the diffuse X-ray emission in the outer parts of the galaxy is mostly located in the spiral arms and not in between the arms. For the hot gas to be confined to regions near the spiral arms, we require that hot gas produced in the arms cool off before it rotates away from the spiral arms. Secondly, less hot gas can be produced interarm.
Hot gas produced in the arms can cool radiatively or by adiabatic expansion. In either case, the cooling time must not be longer than the time it takes for the spiral pattern to travel a large angle through the galaxy. For a galaxy rotating at 200 km/s the rotational period is 0.3 Gyrs at a radius of 10 kpc from the galaxy nucleus. Spiral patterns rotate at an angular rotation rate that is approximately the same size as the angular rotation rate. For the X-ray emission to appear in the spiral arms and be absent between them, the hot gas produced in the arms must cool faster than the rotational period. Since our estimated radiative cooling time was much larger than the angular rotation rate for and kpc, we infer that the scale height and volume filling factor are probably lower than these values.
We now consider cooling by adiabatic expansion. If the gas expands by a factor of 3 then the intensity of the X-ray emission can drop by an order of magnitude and so become undetectable interarm. The time for expansion depends on the sound speed km/s, . A time period of 10 Myr would cause the hot gas to lag the spiral arms. This suggests that even if cooling took place through adiabatic expansion, to keep the detected hot gas confined to the spiral arms, we would require a low volume filling factor and scale height kpc.
This conclusion is not inconsistent with the narrow appearance of the spiral arms, which implies that the hot gas is not in hydrostatic equilibrium. Because the ratio of the sound speed in K gas to the rotational velocity is nearly one, gas in hydrostatic equilibrium would necessarily have . If the volume filling factor is indeed lower than 1, then the density in the X-ray emitting medium could be high enough cm-3 to correspond to what we might expect from X-ray gas originating from supernovae in dense environments. To be consistent with such an electron density, we would infer that .
In summary, the high emission measures in the centers of these galaxies suggest that the volume filling factor and scale heights of the X-ray emitting gas are high ( a few kpc), whereas those in the spiral arms suggest the opposite, that the volume filling factor and scale heights are low ( less than a few kpc). It is tempting to consider a picture where a galactic fountain type scenario operates in the outer parts of these galaxies, and superwinds are driven from galaxy centers.
3.5 Comparison of diffuse X-ray emission and star forming regions with the predictions of population synthesis models
We now consider the predictions of population synthesis models. In the spiral galaxies the star formation rate is highest just after a spiral arm passes through the ISM. H and mid-infrared emission peak where the massive young stars are formed. Population synthesis models (e.g., Leitherer & Heckman 1995; Cervino et al. 2002) of instantaneous bursts predict a peak in H that lasts years until the most massive stars leave the main sequence. The energy deposition rate from subsequent supernovae rises at this time and remains fairly flat until years after the onset of the burst. This gives a characteristic timescale for the expected production of X-ray gas. Spiral arms contain H II regions as well as star clusters so clearly there is a range of ages along the arm (or widths if we think of the spiral arm as a pattern passing through the disk of the galaxy). So we can’t think of the arm as a wave where at each point we see one and only one age after the burst. However, because H II regions can only last a few million years and the mechanical energy deposition from supernovae takes place over a timescale 10 times as long, we do expect a difference between the morphology seen in H or mid-IR compared to that seen in X-ray. In particular we expect that the X-ray emission will lag or be offset from the H and mid-infrared emission in the spiral arm.
The angular size of the lag depends on the timescale for supernovae to occur and the angular rotation rate of the disk compared to the spiral pattern. We expect larger angular offsets or lags in the center of the galaxy where the rotation periods are fast compared to the outer parts. At a distance of 5 kpc from the nucleus and with a typical circular velocity of 200 km/s the rotational period of a star is 150 Myr. The timescale for supernovae to inject energy is about 30 million years. This is one fifth of the rotational period and so would correspond to an angular width of 70 degrees. For radii twice this the corresponding angular width would be 45 degrees, large enough to be easily detectable in our figures that compare the X-ray emission to that seen in H or the mid-IR.
Visually inspecting the images in Figure 1, there does not appear to be any such lag between the diffuse X-ray and the H or mid-IR emission in any of the images. The diffuse X-ray emission images have been smoothed to enhance the faint diffuse features; however, this should not affect the location of the diffuse emission. When we ran the adaptive smoothing routine, we restricted the maximum smoothing scale to be . The smoothing would not have moved the centroid of the X-ray emission, but only degraded the spatial resolution. We note that we saw no obvious visual evidence for fine structure in the diffuse X-ray emission in the non-smoothed maps. Higher signal to noise images would probably reveal more structure in the diffuse component, but we still expect that the hot gas is distributed over fairly large regions.
In Figure 8, we show diffuse X-ray contours on top of grayscale images of the H and mid-IR emission for each of the three galaxies M51, M83, and NGC 3184 that show strong, open spiral structure in all three wavelengths. In M83 and M51 it appears that the X-ray emission in some regions extend to somewhat larger radii than the mid-IR emission. However, there is no such extension seen in NGC 3184 where the X-ray contours are nearly centered on the regions of star formation.
While there is some difference between the distribution of hot gas and that seen in H, mid-IR, and diffuse X-ray emission, there is no clear lag between the X-ray emission and that tracing massive star formation. The only major difference is that the X-ray emission is more diffuse than the H emission. This would be expected if the X-ray emission arose from a somewhat larger scale height above the plane of the galaxy than the H II regions.
Population synthesis models for the X-ray luminosity are also dependent upon an efficiency factor that represents the fraction of mechanical energy that heats the ambient gas to X-ray emitting temperatures. The adiabatic phase for an individual phase depends on the density of the ambient medium and would be shorter in a denser medium, but the X-ray luminosity could be higher in such a medium because the density of shocked material would be higher. Supernovae that occur in denser regions probably produce more X-ray emission (Smith & Cox, 2001). Our observations suggest that is dependent upon environment and is higher near sites of massive star formation than in lower-density inner-arm regions. Because the X-ray emission along the spiral arms is quite narrow, we infer that supernovae from interarm regions must produce less soft X-ray emission than those that explode near the sites of massive star formation.
3.6 Comparison of diffuse X-ray emission and star forming regions with galactic fountain models
The narrowness of the X-ray emission associated with the strong spiral arms can be used to place a limit on the vertical scale height of coronal gas. The vertical scale height is likely to be smaller than the width of the features as seen on the sky. The width of the features seen in X-ray is typically less than wide, implying that the vertical scale height of the hot gas is likely to be less than 1-2 kpc for these galaxies. Since this emission is located at 5-10 kpc from the galaxy centers, this implies that the aspect ratio of the coronal emission . The X-ray gas at large radii in these galaxies is likely to be in a fairly thin layer. While the hot gas is likely to be above the H I disk, it is not likely to be more than a few kpc above the plane of the galaxy. We see no evidence for a bright X-ray halo component at large radii in these galaxies. Even in the starburst galaxy M83, the fact that the X-ray emission is associated with the spiral arms in the outer part of the galaxy suggests that it is tied to the disk and not part of the halo. This would suggest that a galactic fountain can operate at fairly high levels of star formation.
There is however a change in morphology seen in the X-ray emission from disk emission associated with spiral structure in the outer region to a more round distribution in the center of these galaxies. The edge-on galaxies atlas by Strickland et al. (2003a) also suggests that large scale outflows are primarily a phenomenon restricted to the central few kpc of galaxies. This suggests that many galaxies undergo a transition at some radius between low scale height hot gas disk, associated with a ‘galactic fountain’ to a more spherical distribution that might be associated with an outflow. At smaller radii the angular rotation rate is higher, so star formation associated with spiral arms will heat the ISM more frequently. If the gas cannot cool before the next spiral wave passes by then each wave additively inputs energy into the hot component of the ISM. If this scenario was correct then the radius at which the galaxy undergoes a transition in X-ray morphology could depend on the angular rotation rate and on the cooling time of the hot gas. Because the angular rotation rate is dependent upon the mass distribution (and bulge) this could in part explain the weak correlation seen between the central X-ray and bulge surface brightnesses (Figure 6a). Alternatively hot gas from type I supernovae associated with an old bulge stellar population could facilitate the driving of a superwind.
4 Summary and Discussion
In this paper we have carried out a study of the diffuse soft X-ray emission in a sample of nearby low and moderate inclination spiral galaxies. By using the high angular resolution possible with Chandra, we were able to separate between the diffuse component and that associated with point sources. We have compared the morphology of the diffuse emission with that at other wavelengths, finding the closest correspondence between the diffuse emission and indicators of massive star formation such as H emission or mid-infrared emission. In the spiral arms, the 0.1-2 keV X-ray energy flux is correlated with that in the mid-infrared tracing recent star formation, and is about 5 orders of magnitude below that in emitted in the far-infrared.
The outer regions of these galaxies show that X-ray emission is closely associated with star formation lying in linear features following the spiral arms. Most of the galaxies also exhibit diffuse X-ray emission in the centers; however, the morphology of this component is nearly round. The level of central X-ray emission is correlated with that seen in the mid-infrared and that from bulge stars in the near-infrared, though the correlation between the X-ray and mid-IR is not as tight as seen in the spiral arms. It is likely that more than one process is contributing to the level of diffuse X-ray emission in these galaxy centers.
The narrow size of the X-ray emission in the spiral arms and estimated emission measures imply that the volume filling factor and the scale height is less than a few kpc. Consequently the X-ray gas in the spiral arms is probably associated with a galactic fountain and not part of a superwind. By a similar argument we reach the opposite conclusion for the hot gas in these galaxy centers, suspecting that the scale heights are larger than a few kpc and the filling factors are larger. The X-ray emitting gas in these galaxy centers could be associated with galactic scale winds originating from the galaxy nucleus.
Contrary to the predictions of simple population synthesis models, the X-ray emission in the spiral arms does not lag the mid-IR or H emission. The narrowness of the X-ray emission implies that the X-ray gas produced in the arms must cool off quickly enough that it is not detected interarm, and that X-ray gas is not efficiently produced outside of spiral arms. This suggests that the fraction of mechanical energy from supernovae that heats the ambient gas to X-ray emitting temperatures is dependent on environment and is higher in near the sites of massive star formation.
In this paper we have compared the X-ray morphology to tracers of current star formation. However, future work could probe the dependence of X-ray luminosity and morphology on the past star formation history by comparing these observations to optical and near-infrared spectroscopic observations. Future studies could also probe the relation between the LINER classification and the X-ray properties of galaxies.


References
- Bendo et al. (2002) Bendo, G. J., et al. 2002, AJ, 123, 3067
- Bregman & Houck (1997) Bregman, J. N., & Houck, J. C. 1997, ApJ, 485, 159
- Bregman (1980) Bregman, J. N. 1980, ApJ, 236, 577
- Brown & Bregman (1998) Brown, B. A., & Bregman, J. N. 1998, ApJ, 495, L75
- Cervino et al. (2002) Cervino, M., Mas-Hesse, J. M., & Kunth, D. 2002, A&A, 392, 19
- Chevalier & Clegg (1985) Chevalier, R. A., Clegg, A. W. 1985, Nature, 317, 44
- Cui et al. (1996) Cui, W., Sanders, W. T., McCammon, D., Snowden, S. L., & Womble, D. S. 1996, ApJ, 468, 102
- de Avillez (2000) de Avillez, M. A. 2000, Ap&SS, 272, 23
- Edmunds (1990) Edmunds, M. G. 1990, MNRAS, 246, 678
- Ehle et al. (1995) Ehle, M., Pietsch, W., & Beck, R. 1995, A&A, 295, 289
- Eracleous et al. (2002) Eracleous, M., Shields, J. C., Chartas, G., & Moran, E. C. 2002, ApJ, 565, 108
- Fabbiano et al. (1992) Fabbiano, G., Kim, D.-W., & Trinchieri, G. 1992, ApJS, 80, 531
- Fraternali et al. (2002) Fraternali, F. , Cappi, M., Sancisi, R., & Oosterloo, T. 2002, ApJ, 578, 109
- Heckman et al. (1990) Heckman, T. M., Armus, L., Miley, G. K. 1990, ApJS, 74, 833
- Helfer et al. (2003) Helfer, T. T., Thornley, M. D., Regan, M. W., Wong, T., Sheth, K., Vogel, S. N., Blitz, L., & Bock, D. C.-J. 2003, ApJS, 145, 259
- Kennicutt (1998) Kennicutt, R. C., Jr. 1998, ARA&A, 36, 189
- Koopman et al. (2001) Koopmann, R. A., Kenney, J. D. P., & Young, J. 2001, ApJS, 135, 125
- Kuntz et al. (2003) Kuntz, K. D., Snowden, S. L., Pence, W. D., & Mukai, K. 2003, ApJ, 588, 264
- Larsen & Richtler (1999) Larsen, S. S., & Richtler T. 1999, A&A, 345, 59
- Leitherer & Heckman (1995) Leitherer, C., & Heckman, T. M. 1995, ApJS, 96, 9
- Martin et al. (2002) Martin, C. L., Kobulnicky, H. A., Heckman, T. M. 2002, ApJ, 574, 663
- Norman & Ikeuchi (1989) Norman, C. A., & Ikeuchi, S. 1989, ApJ, 345, 372
- Read & Ponman (2001) Read, A. M., & Ponman, T. J. 2001, MNRAS, 328, 127
- Read et al. (1997) Read, A. M., Ponman, T. J., Strickland, D. K. 1997, MNRAS, 286, 626
- Roussel et al. (2001) Roussel, H., et al. 2001, A&A, 369, 473
- Smith (1998) Smith, B. J. 1998, ApJ, 500, 181
- Smith & Cox (2001) Smith, R. K., & Cox, D. P. 2001, ApJS, 134, 283
- Snowden & Pietsch (1995) Snowden, S. L., & Pietsch, W. 1995, ApJ, 452, 627
- Spinoglio et al. (1995) Spinoglio, L., Malkan, M. A., Rush, B., Carrasco, L., & Recillas-Cruz, E. 1995, ApJ, 453, 616
- Strickland et al. (2000) Strickland, D. K., Heckman, T. M., Weaver, K. A., & Dahlem, M. 2000, AJ, 120, 2965
- Strickland et al. (2003a) Strickland, D. K., Heckman, T. M., Colbert, E. J. M., Hoopes C. G.,& Weaver K. A. 2003, submitted to ApJS, astro-ph/0306592
- Strickland et al. (2003b) Strickland, D. K., Heckman, T. M., Colbert, E. J. M., Hoopes C. G.,& Weaver K. A. 2003, submitted to ApJ, astro-ph/0306598
- Thim et al. (2003) Thim, F., Tammann, G. A., Saha, A., Dolphin, A., Sandage, A., Tolstoy, E., & Labhardt, L. 2003, ApJ, 590, 256
- Tully (1988) Tully, R. B. 1988, Nearby Galaxies Catalog (Cambridge University Press: New York)
- Wang et al. (2001) Wang, Q. D., Immler, S., Walterbos, R., Lauroesch, J. T., & Breitschwerdt, D. 2001, ApJ, 555, L99
- Wang et al. (1995) Wang, Q. D., Walterbos, R. A. M., Steakley, M. F., Norman, C. A., & Braun, R. 1995, ApJ, 439, 176
- Wong & Blitz (2002) Wong, T, & Blitz, L. 2002, ApJ, 569, 157
- Young et al. (2001) Young, A. J., Wilson, A. S., & Shopbell, P. L. 2001, ApJ, 556, 6Y
| Galaxy | X-ray morphology | Observation ID | nuclear type | Distance (Mpc) |
|---|---|---|---|---|
| M51 | arms, center | 1622 | Sy2 | 7.7 |
| M83 | arms, center | 793 | H2 | 4.5 |
| M101 | arms, center | 934 | 7.4 | |
| NGC 2403 | irregular | 2014 | H2 | 4.2 |
| NGC 2681 | center | 2060 | L1.9 | 13.3 |
| NGC 3184 | arms, center | 804,1520 | H2 | 8.7 |
| NGC 4303 | arms, center | 2149 | H2 | 15.2 |
| NGC 4579 | center | 807 | S1.9/L1.9 | 16.8 |
| NGC 4736 | arms, center | 808 | L2 | 4.3 |
| NGC 5055 | center | 2197 | T2 | 7.2 |
| NGC 6946 | arms,center | 1043 | H2 | 5.5 |
| NGC 7331 | center | 2198 | T2 | 15.1 |
| Galaxy | X-ray | Mid-IR |
|---|---|---|
| (erg cm-2 s-1) | (erg cm-2 s-1) | |
| M51 | 6.4e-15 | 1.8e-11 |
| 8.2e-15 | 1.0e-11 | |
| 5.6e-15 | 1.7e-11 | |
| 3.7e-15 | 8.7e-12 | |
| 3.4e-15 | 4.8e-12 | |
| 2.6e-15 | 1.5e-11 | |
| M83 | 1.6e-14 | 3.3e-11 |
| 1.0e-14 | 2.7e-11 | |
| 6.0e-15 | 1.6e-11 | |
| 4.0e-15 | 2.5e-11 | |
| 7.2e-15 | 2.8e-11 | |
| 5.6e-15 | 1.7e-11 | |
| M101 | 2.2e-15 | 4.7e-12 |
| 5.4e-16 | 2.7e-12 | |
| 1.3e-15 | 6.1e-12 | |
| 1.0e-16 | 3.0e-12 | |
| 3.4e-16 | 3.0e-12 | |
| 1.3e-16 | 2.1e-12 | |
| 9.3e-16 | 6.2e-12 | |
| NGC 4579 | 5.5e-15 | 1.9e-12 |
| 2.8e-15 | 2.9e-12 | |
| 3.6e-15 | 2.4e-12 | |
| 8.8e-16 | 1.3e-12 | |
| NGC 4736 | 2.3e-14 | 1.8e-11 |
| 1.8e-14 | 1.8e-11 | |
| 2.2e-14 | 1.6e-11 | |
| 1.5e-14 | 2.8e-11 | |
| 8.5e-15 | 2.0e-11 | |
| NGC 5055 | 1.8e-15 | 1.1e-11 |
| 1.9e-15 | 10.0e-12 | |
| 3.0e-15 | 1.4e-11 | |
| 3.0e-15 | 1.1e-11 | |
| NGC 6946 | 3.7e-15 | 9.9e-12 |
| 4.2e-15 | 8.3e-12 | |
| 6.5e-15 | 5.9e-12 | |
| 4.6e-15 | 1.4e-11 | |
| 3.6e-15 | 9.5e-12 |
Note. — Fluxes are measured in apertures in the spiral arms of given galaxies. X-ray fluxes have been corrected for Galactic absorption. Both X-ray and mid-infrared fluxes have been background-subtracted. Mid-infrared fluxes have been measured from ISOCAM 12 or 15m images using and calibration factors given by the ISO archive. A plot of these data is shown in Figure 5.
| Galaxy | X-ray | Mid-IR | CO | -band | Aperture | Galactic Column |
|---|---|---|---|---|---|---|
| (erg cm-2 s-1) | (erg cm-2 s-1) | (Jy km s-1) | (mag) | (′′) | ||
| M51 | 4.0e-13 | 9.1e-11 | 3.4e4 | 7.7 | 25 | 1.52 |
| M83 | 5.8e-13 | 3.6e-10 | 7.3 | 20 | 3.70 | |
| M101 | 2.1e-15 | 9.8e-12 | 4.2e3 | 10.2 | 10 | 1.15 |
| NGC 2403 | 1.6e-15 | 1.7e3 | 9.4 | 20 | 4.17 | |
| NGC 2681 | 4.9e-15 | 8.8 | 10 | 2.48 | ||
| NGC 3184 | 1.2e-15 | 1.8e3 | 10.9 | 10 | 1.15 | |
| NGC 4303 | 5.3e-14 | 1.2e4 | 9.4 | 10 | 1.65 | |
| NGC 4579 | 1.3e-12 | 7.8e-11 | 3.5e3 | 8.1 | 20 | 2.51 |
| NGC 4736 | 1.5e-13 | 1.1e-10 | 1.7e4 | 6.4 | 20 | 1.44 |
| NGC 5055 | 1.4e-14 | 2.7e-11 | 1.5e4 | 8.1 | 15 | 1.30 |
| NGC 6946 | 1.0e-14 | 7.7e-10 | 4.1e4 | 9.4 | 10 | 20.05 |
| NGC 7331 | 5.2e-14 | 4.1e-11 | 9.7e3 | 7.6 | 20 | 8.25 |
Note. — Values in the cores of galaxies for the given apertures for the diffuse X-ray, Mid-IR, CO, and 2MASS -band images. X-ray fluxes have been corrected for the indicated Galactic absorption. X-ray, mid-IR, CO, and 2MASS IR have all been background-subtracted. These data points are plotted in Figure 6.